Troubleshooting guidance for Sentinel Integration via Logstash
This article lists out pointers to spot in order to resolve an issue that you might encounter when you integrate Microsoft Sentinel with Citrix Analytics using Logstash. To know more about the same, refer SIEM integration using Kafka or Logstash based data connector.
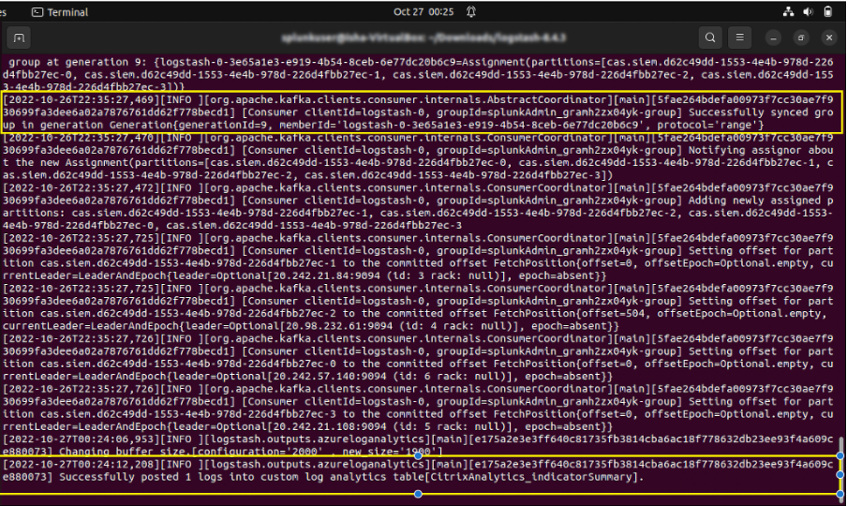
Check Logstash Server Logs
You can check the Logstash server logs appearing on your terminal window to verify whether data has been correctly ingested into the custom log tables in your Sentinel workspace.
-
To view the log details, you must download the Logstash configuration file from Settings > Data Exports > Configuration tab > expand the SIEM Environment. Under the Azure Sentinel (Preview), click Download Logstash Config File.
-
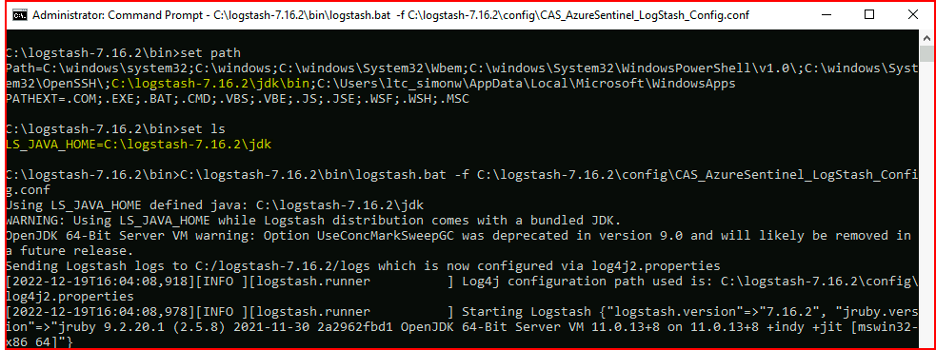
Once you start the Logstash server using the configuration file, you can look out for the following logs in the same terminal window that indicate a successful connection with Log Analytics workspace hosted by Microsoft Azure.
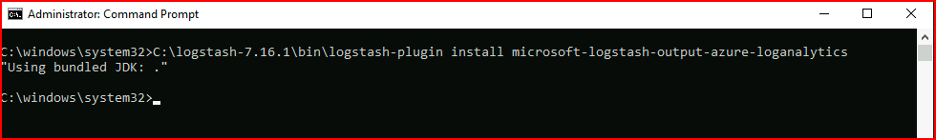
Common Error: Using bundled JDK
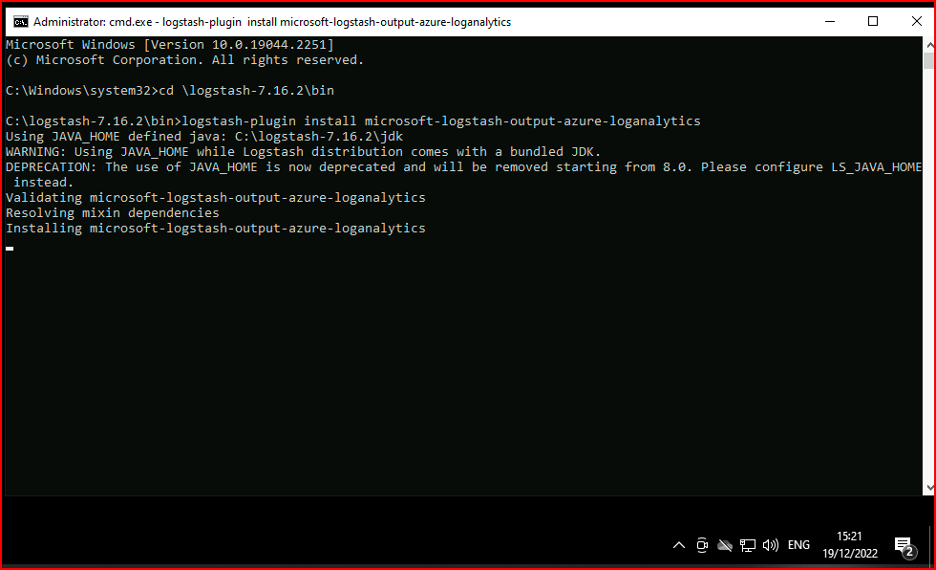
When trying to install the Microsoft log analytics plug-in, a common error reported is the one shown below:
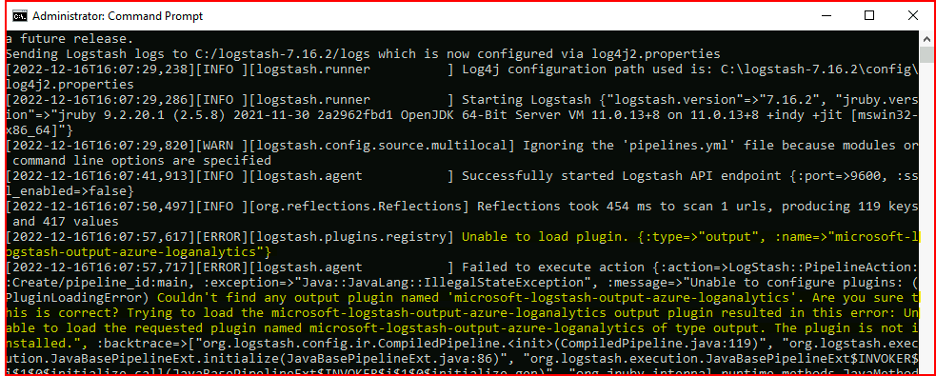
After this, upon trying to run Logstash server, you might see the following error:
To resolve this, set JAVA_HOME to the bundled JDK:
- Go to Windows Environment Variables
- Create a new system variable with the name “JAVA_HOME”
- Add the path to the bundled Logstash JDK (< path_to_logstash >/logstash-X.X.X/jdk)
After going through the above steps, upon trying to install the plug-in again, the following screen appears:
If you use LS_JAVA_HOME (as JAVA_HOME is deprecated), you also have to specify the location of the bundled JDK in the system PATH variable, and this path must point to the jdk\bin folder (unlike the LS_JAVA_HOME variable) :
If you use LS_JAVA_HOME (as JAVA_HOME is deprecated), you also have to specify the location of the bundled JDK in the system PATH variable, and this path must point to the jdk\bin folder (unlike the LS_JAVA_HOME variable):
Check Microsoft Sentinel Workbook
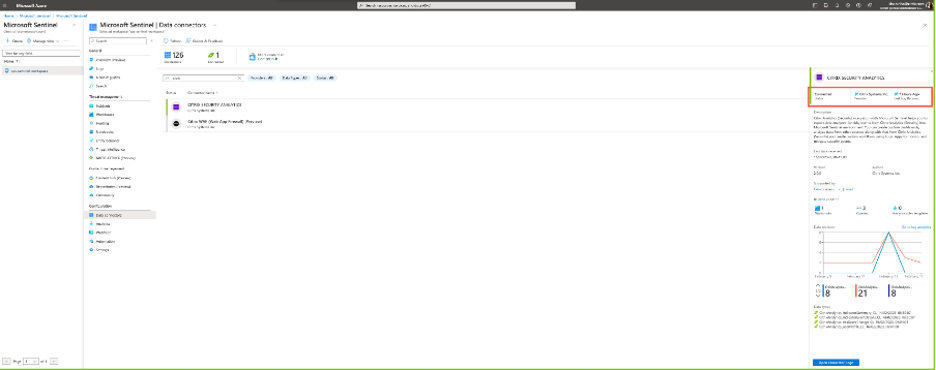
To confirm whether data sent by Citrix Analytics has been successfully entered into the appropriate custom log table in the Log Analytics Workspace (To know more about Microsoft Sentinel integration with Citrix Analytics, refer Microsoft Sentinel integration):
- Navigate to Azure portal > Microsoft Sentinel > Select appropriate_workspace > Data connectors > select and click Citrix Security Analytics.
-
Check the top bar to verify the connectivity status.
-
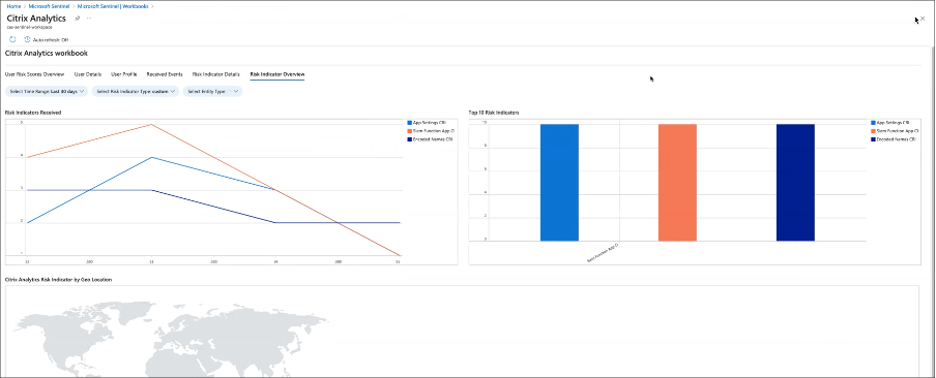
Under the Workbooks, you can use intuitive filters to further drill-down on the data to get the risk indicator information. To get the information, navigate to Azure portal > Microsoft Sentinel > Data connectors > CITRIX SECURITY ANALYTICS > Workbooks.
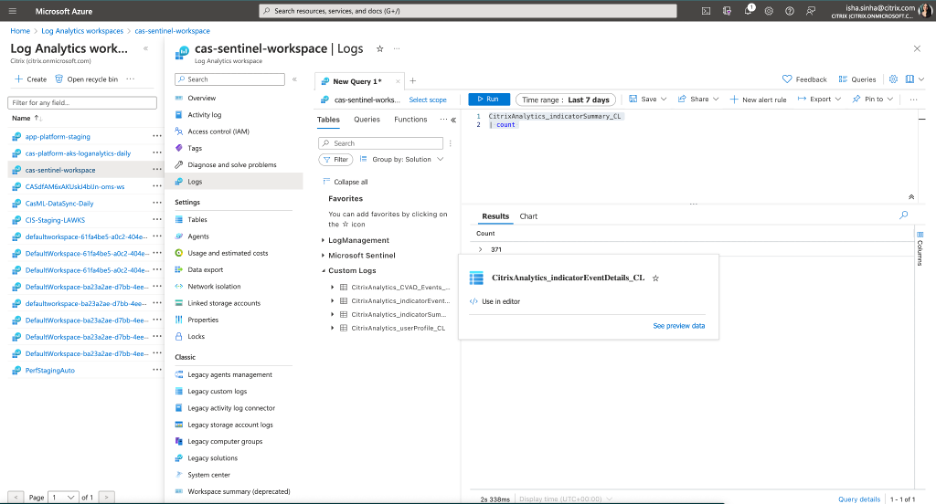
Check Log Analytics workspace logs using KQL
You can also check if the correct data made its way to your LogAnalytics workspace by running KQL queries on the respective custom log tables.
-
Navigate to Azure portal > Log Analytics workspaces and search for the correct workspace.
-
Under the left panel, select Logs and search for the custom log analytics table under the Tables tab.
-
Select the custom log analytics table and click Use in editor. (For guidance on KQL queries on Log Analytics workspace, refer Log Analytics tutorial).
-
Click Run.