Configuration issues with Citrix Analytics add-on for Splunk
Citrix Analytics add-on settings unavailable
After installing Citrix Analytics Add-on for Splunk on your Splunk Forwarder or Splunk Standalone environment, you don’t see the Citrix Analytics Add-on settings under Settings > Data inputs.
Reason
This issue occurs when you install Citrix Analytics Add-on for Splunk in an unsupported Splunk environment.
Fixes
Install the Citrix Analytics Add-on for Splunk in a supported Splunk environment. For information on the supported versions, see Splunk integration.
No data available on Splunk dashboards
After installing and configuring Citrix Analytics Add-on for Splunk on your Splunk Forwarder or Splunk Standalone environment, you don’t see any data from Citrix Analytics in your Splunk dashboards.
Checks
To troubleshoot the issue, verify the following on your Splunk Forwarder or Splunk Standalone environment:
-
Ensure that the prerequisites for the Splunk integration are met.
-
Go to Settings > Data inputs > Citrix Analytics Add-on. Ensure that the Citrix Analytics configuration details are available.
-
If the configuration details are available, run the following query to check the logs for any errors related to Citrix Analytics add-on for Splunk:
index=_internal sourcetype=splunkd log_level=ERROR component=ExecProcessor cas_siem_consumer -
If you don’t find any errors, Citrix Analytics add-on for Splunk is working as expected. If you find any errors in the logs, it might be because of one of the following reasons:
-
Failed to established connection between your Splunk environment and Citrix Analytics Kafka endpoints. This issue might be because of the firewall settings.
Fixes: Check with your network administrator to resolve this issue.
-
Incorrect configuration details in Settings > Data inputs > Citrix Analytics Add-on.
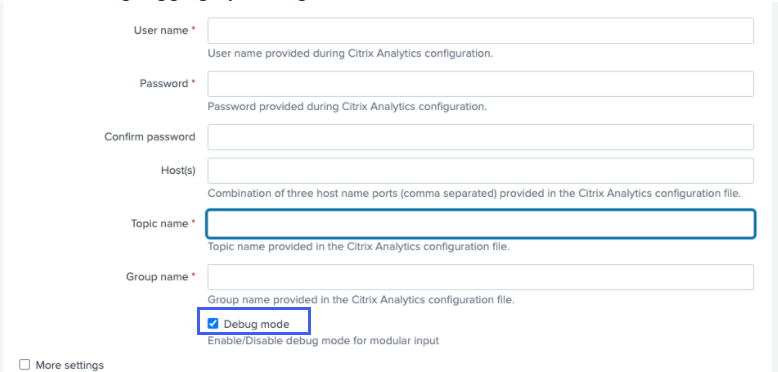
Fixes: Ensure that the Citrix Analytics configuration details such as user name, password, host endpoints, topic, and consumer group are correctly entered as per the Citrix Analytics configuration file. For more information, see Configure Citrix Analytics add-on for Splunk.
-
-
If you are unable to find the cause of the issue from the preceding logs and want to investigate further:
-
Enable the Debug mode in Settings > Data inputs > Citrix Analytics Add-on.
Note
By default, the Debug mode is disabled. Enabling this mode generates too many logs. So, use this option only when required and disable it after completing your debugging task.
-
Locate the generated debug logs at the following location and check for any errors:
$SPLUNK_HOME$/var/log/splunk.Filename splunk_citrix_analytics_add_on_debug_connection.log -
(Optional) Use the debug script
splunk cmd python cas_siem_consumer_debug.pythat is available with Citrix Analytics add-on for Splunk. This script generates a log file that contains the details of your Splunk environment and the connectivity checks. You can use the details to debug the issue. Run the script using the following command:cd $SPLUNK_HOME$/etc/apps/TA_CTXS_AS/bin/; /opt/splunk/bin/splunk cmd python cas_siem_consumer_debug.py
-
Error message
In the logs related to Citrix Analytics add-on for Splunk, you might see the following error:
ERRORKafkaError{code=_TRANSPORT,val=-195,str="Failed to get metadata: Local: Broker transport failure"}
This error is because of either a network connectivity issue or an authentication issue.
To debug the issue:
-
On your Splunk Forwarder or Splunk Standalone environment, enable the Debug mode to get the debug logs. Refer to the preceding step 5.a.
-
Run the following query to find any authentication issues in the debug logs:
index=_internal source="*splunk_citrix_analytics_add_on_debug_connection.log*" "Authentication failure" -
If you don’t find any authentication issues in the debug logs, the error is because of a network connectivity issue.
-
Find and resolve the issue by using telnet or the debug script mentioned in the preceding step 5.c.
Add-on upgrade fails from a version earlier than 2.0.0
On your Splunk Forwarder or Splunk Standalone environment, when you upgrade Citrix Analytics add-on for Splunk to the latest version from a version earlier than 2.0.0, the upgrade fails.
Fixes
-
Delete the following files and folders located within the
/binfolder of the Citrix Analytics add-on for Splunk installation folder:-
cd $SPLUNK_HOME$/etc/apps/TA_CTXS_AS/bin -
rm -rf splunklib -
rm -rf mac -
rm -rf linux_x64 -
rm CARoot.pem -
rm certificate.pem
-
-
Restart your Splunk Forwarder or Splunk Standalone environment.