This content has been machine translated dynamically.
Dieser Inhalt ist eine maschinelle Übersetzung, die dynamisch erstellt wurde. (Haftungsausschluss)
Cet article a été traduit automatiquement de manière dynamique. (Clause de non responsabilité)
Este artículo lo ha traducido una máquina de forma dinámica. (Aviso legal)
此内容已经过机器动态翻译。 放弃
このコンテンツは動的に機械翻訳されています。免責事項
이 콘텐츠는 동적으로 기계 번역되었습니다. 책임 부인
Este texto foi traduzido automaticamente. (Aviso legal)
Questo contenuto è stato tradotto dinamicamente con traduzione automatica.(Esclusione di responsabilità))
This article has been machine translated.
Dieser Artikel wurde maschinell übersetzt. (Haftungsausschluss)
Ce article a été traduit automatiquement. (Clause de non responsabilité)
Este artículo ha sido traducido automáticamente. (Aviso legal)
この記事は機械翻訳されています.免責事項
이 기사는 기계 번역되었습니다.책임 부인
Este artigo foi traduzido automaticamente.(Aviso legal)
这篇文章已经过机器翻译.放弃
Questo articolo è stato tradotto automaticamente.(Esclusione di responsabilità))
Translation failed!
Viewing Performance Data
Note:
XenCenter YYYY.x.x is not yet supported for use with Citrix Hypervisor 8.2 CU1 in production environments. To manage your Citrix Hypervisor 8.2 CU1 production environment, use XenCenter 8.2.7. For more information, see the XenCenter 8.2.7 documentation.
You can install XenCenter 8.2.7 and XenCenter YYYY.x.x on the same system. Installing XenCenter YYYY.x.x does not overwrite your XenCenter 8.2.7 installation.
The Performance tab shows performance data for the selected server or virtual machine in graph form.
For servers you can view:
- CPU, memory, and network I/O usage data.
- You can add graphs showing extra resource usage data, if necessary. For example, you can include the Control Domain Load. This load is the average (Linux
loadavg) of the number of processes queued inside the control domain over the last 5 minutes. - Lifecycle events for all the VMs hosted on the server are shown in the VM Lifecycle Events pane.
For VMs, graphs showing CPU, memory, network I/O, and disk usage data are shown by default.
At the bottom of the tab, the summary graph gives a quick overview of what is happening on the machine. This graph also allows you to adjust the time frame that is shown in the other graphs. The time frame can be changed either to show data from a longer or shorter period, or to show data from an earlier period.
To include other types of performance data on the tab or to change the appearance of the graphs, see Configuring performance graphs.
To view data from a longer or shorter time period
By default, data from the last 10 minutes is displayed. To view data from a longer or shorter time period, do one of the following:
- To view available performance data for the last hour, 24 hours, week, month, or year, click Zoom. Select 1 Hour, 1 Day, 1 Week, 1 Month, or 1 Year.
-
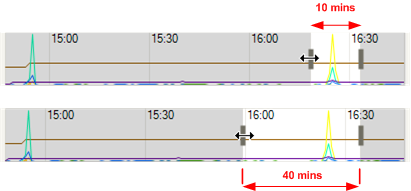
To resize the time period that is displayed in the graphs, in the summary graph, point to the vertical split bar at the edge of the sample area. When the pointer changes to a double-headed arrow, drag the vertical split bar right or left.

For example:
To view data from a different time period
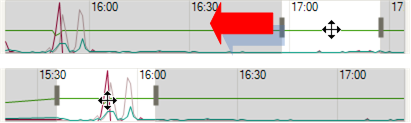
To move the time frame for data displayed in the graphs, point to any graph. When the pointer changes to a move cursor, drag the graph or the sample area in the summary graph to the left or right.

For example:
To view VM lifecycle event data on a server
To view lifecycle events for the VMs hosted on a server, use the VM Lifecycle Events list.
- Each event has a tooltip with the full message for that lifecycle event (“Virtual Machine ‘Sierra’ has been started”).
- You can use the cursor keys to navigate the items in the list.
- Double clicking or pressing Enter zooms the graphs to the point when the selected lifecycle event occurred.
- Selecting (single click or highlight with cursor keys) one of the events causes the lifecycle event on the graph itself to be highlighted.
Share
Share
This Preview product documentation is Cloud Software Group Confidential.
You agree to hold this documentation confidential pursuant to the terms of your Cloud Software Group Beta/Tech Preview Agreement.
The development, release and timing of any features or functionality described in the Preview documentation remains at our sole discretion and are subject to change without notice or consultation.
The documentation is for informational purposes only and is not a commitment, promise or legal obligation to deliver any material, code or functionality and should not be relied upon in making Cloud Software Group product purchase decisions.
If you do not agree, select I DO NOT AGREE to exit.