
Citrix DaaS use cases
Citrix Aidrien™ is your intelligent assistant designed to simplify and accelerate troubleshooting and environment analysis within your Citrix infrastructure. Powered by deep integration with Citrix infrastructure and telemetry, Citrix Aidrien understands your environment contextually, allowing it to surface relevant data, assist with diagnostics, and guide you through resolution steps using natural language queries.
Whether you're investigating machine failures, analyzing session performance, or reviewing configuration details, Citrix Aidrien reduces the time spent navigating multiple consoles, correlating logs, and searching documentation by delivering insights directly within your workflow. Citrix Aidrien is available in Citrix Cloud across Citrix Director, Studio, and Analytics, making it a seamless part of your daily operations.
Note:
On-premises Studio and Citrix Director integrate with Citrix Aidrien through Citrix Cloud. Starting with the CR 2603 release, a Citrix Aidrien button is available in the Studio and Citrix Director consoles. Administrators can launch Citrix Aidrien in Citrix Cloud by signing in with their Citrix Cloud credentials. For more information about Citrix Cloud access, see How to use Citrix Aidrien.
For more information about Citrix Cloud access, see How to use Citrix Aidrien?.
Before you begin
| Requirement | Details |
|---|---|
| Access | A Full administrator enables Citrix Aidrien in Citrix Cloud under Account Settings. All Full access administrators then get access. To grant access to an administrator with a custom role, go to Identity and Access Management > Administrators > Edit Access, and select Citrix Aidrien under General. For more information, see Citrix Aidrien overview. |
| Data scope | Citrix Aidrien honors the administrator scopes set in Citrix Cloud. For example, an administrator scoped to one of two Delivery Groups receives answers about that Delivery Group only. |
| Feature prerequisites | Citrix Aidrien uses the data that Monitor and Studio collect. Monitor and Studio features can have their own prerequisites, such as supported versions or agents. Those prerequisites must be met for the data to be collected. When the data is available, Citrix Aidrien uses it. For example: The VDA registration health check requires the WEM agent integrated with Citrix Monitor. Integrated AOT analysis requires AOT enabled for the site in Monitor. Session performance analysis uses the session performance metrics available for your versions. See Session performance metrics. |
Note:
For Citrix DaaS, Citrix Aidrien only reads data and runs diagnostics, such as the VDA registration health check. It does not perform actions or change your configuration.
Ways to start Citrix Aidrien
From the Citrix Aidrien chat
Sign in to Citrix Cloud and select the Citrix Aidrien icon in the top navigation bar of Cloud home or DaaS. Select a suggested prompt or enter your own question. Previous conversations are available in the chat history.
From Monitor and Studio
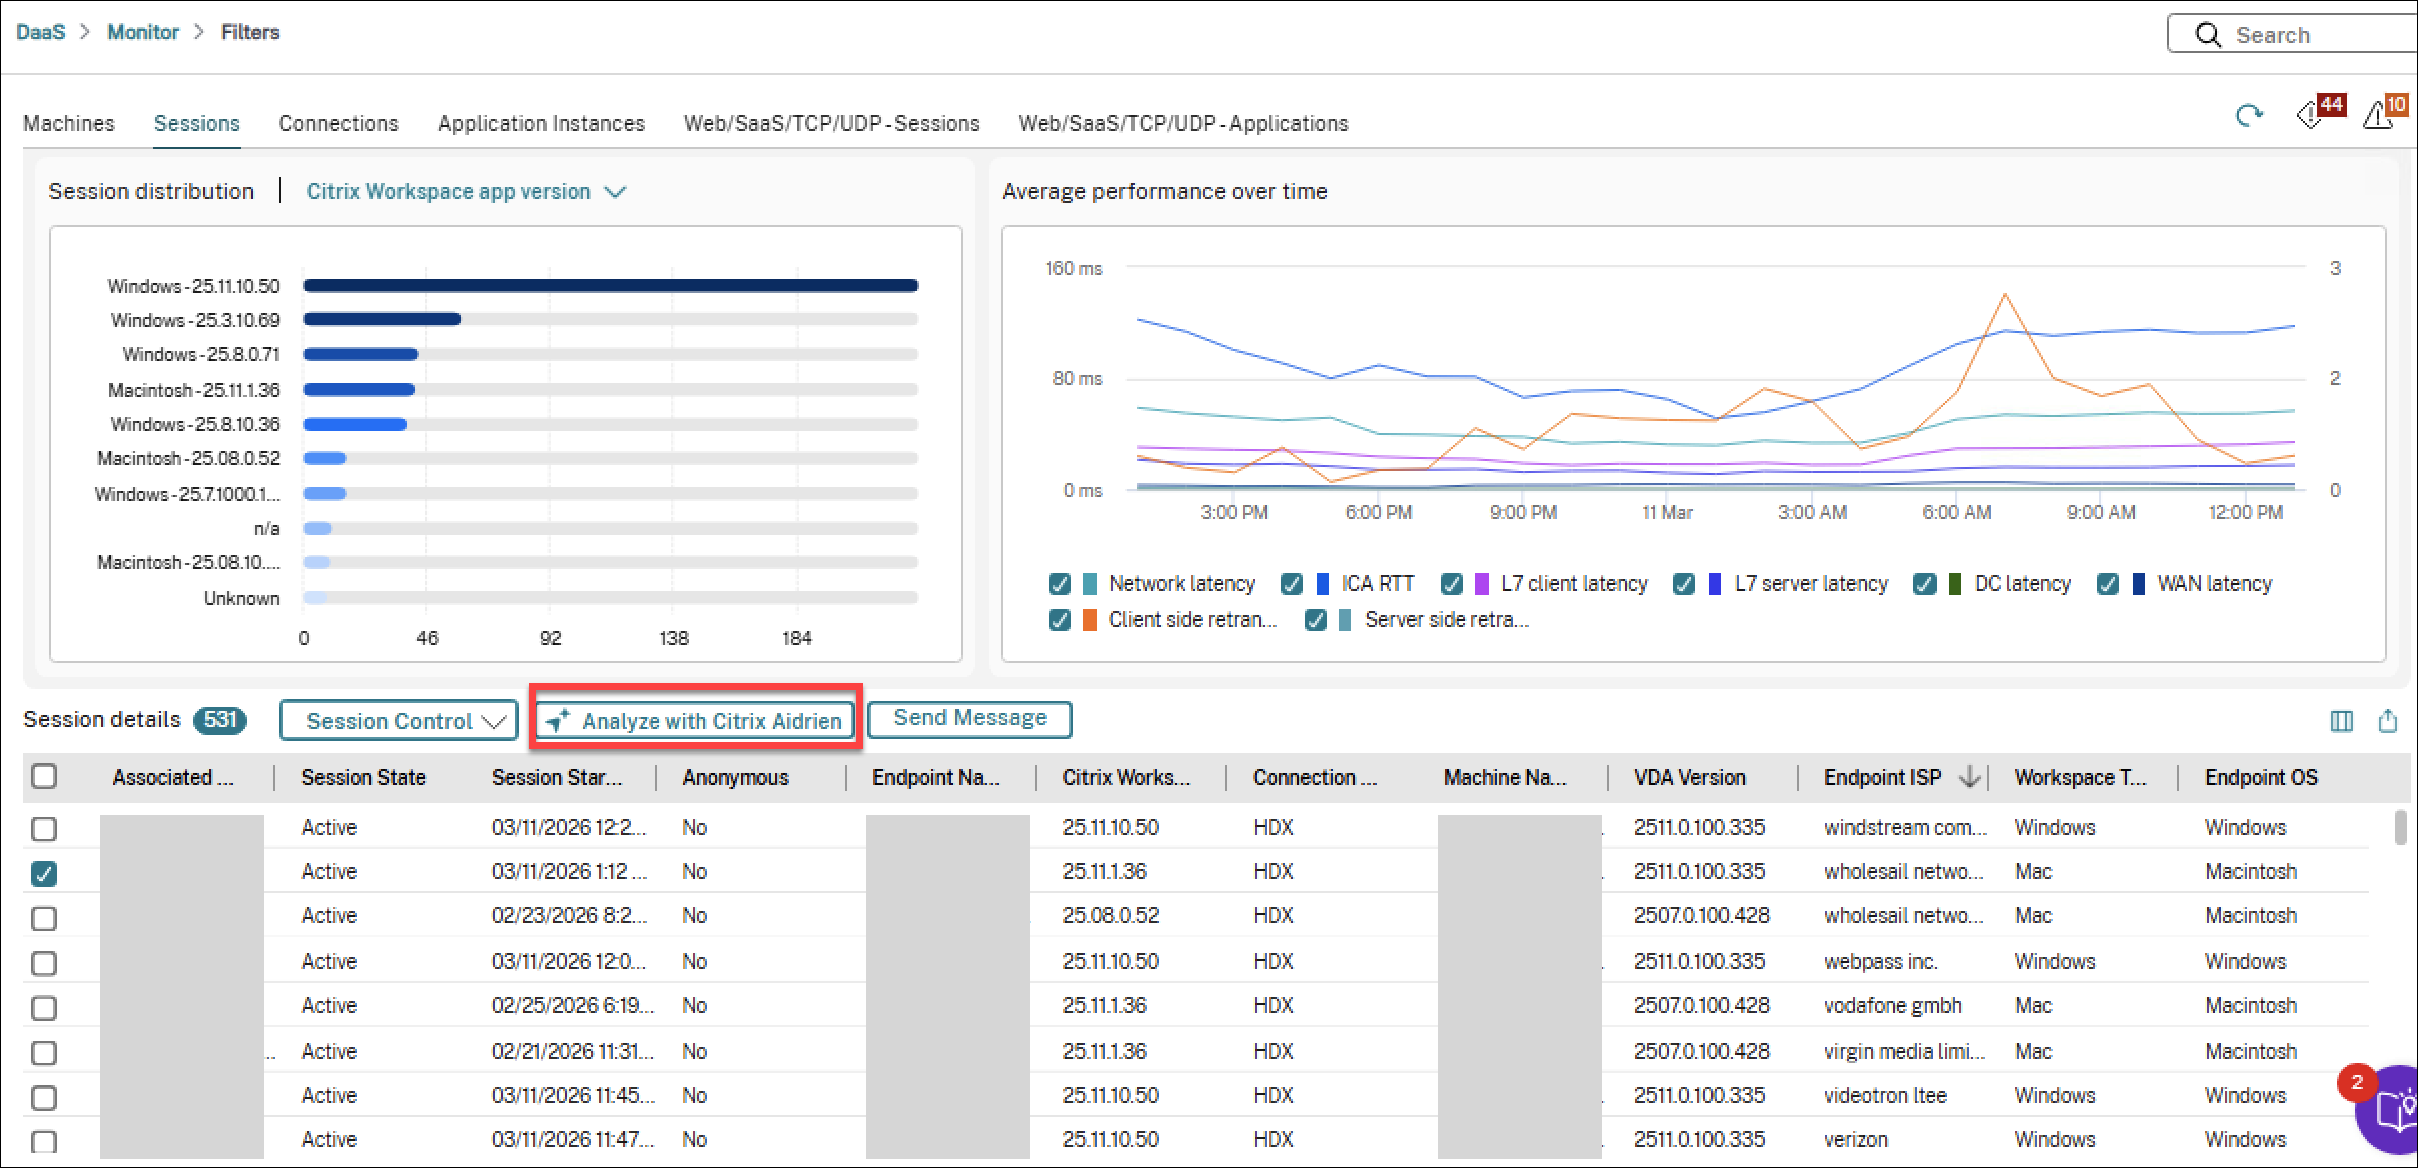
Select Analyze with Citrix Aidrien to start an analysis with the selected session, machine, failure, or error passed in as context.
| Where | How to launch | What Citrix Aidrien analyzes |
|---|---|---|
| Monitor, Sessions view | Select a session, then select Analyze with Citrix Aidrien. | Session performance |
| Monitor, Dashboard failure panels | Select Analyze with Citrix Aidrien on a failure panel. | Multiple machine or connection failures |
| Monitor, machine details page | Open a machine, then select Analyze with Citrix Aidrien. | A single machine failure |
| Monitor, Machines Filters | Select a machine, or a failure panel, then select Analyze with Citrix Aidrien. | A single machine failure, or multiple machine failures |
| Monitor, Connections Filters | Select a failed connection, or a failure panel, then select Analyze with Citrix Aidrien. | A single connection failure, or multiple connection failures |
| Monitor, Session Launch Diagnostics | Open a failed transaction, then select Analyze with Citrix Aidrien. | A single connection failure |
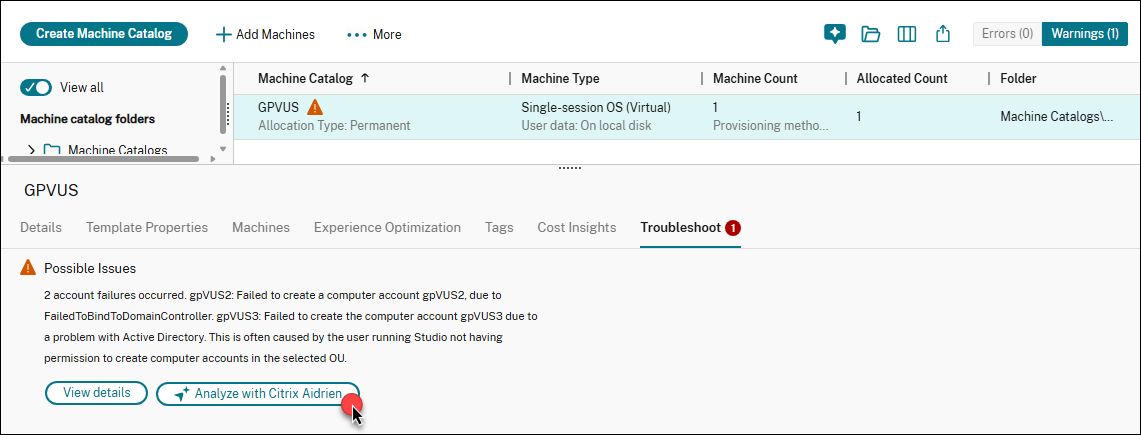
| Studio, Troubleshoot tab | In a resource's details view, open the Troubleshoot tab and select Analyze with Citrix Aidrien. | Configuration warnings and errors |
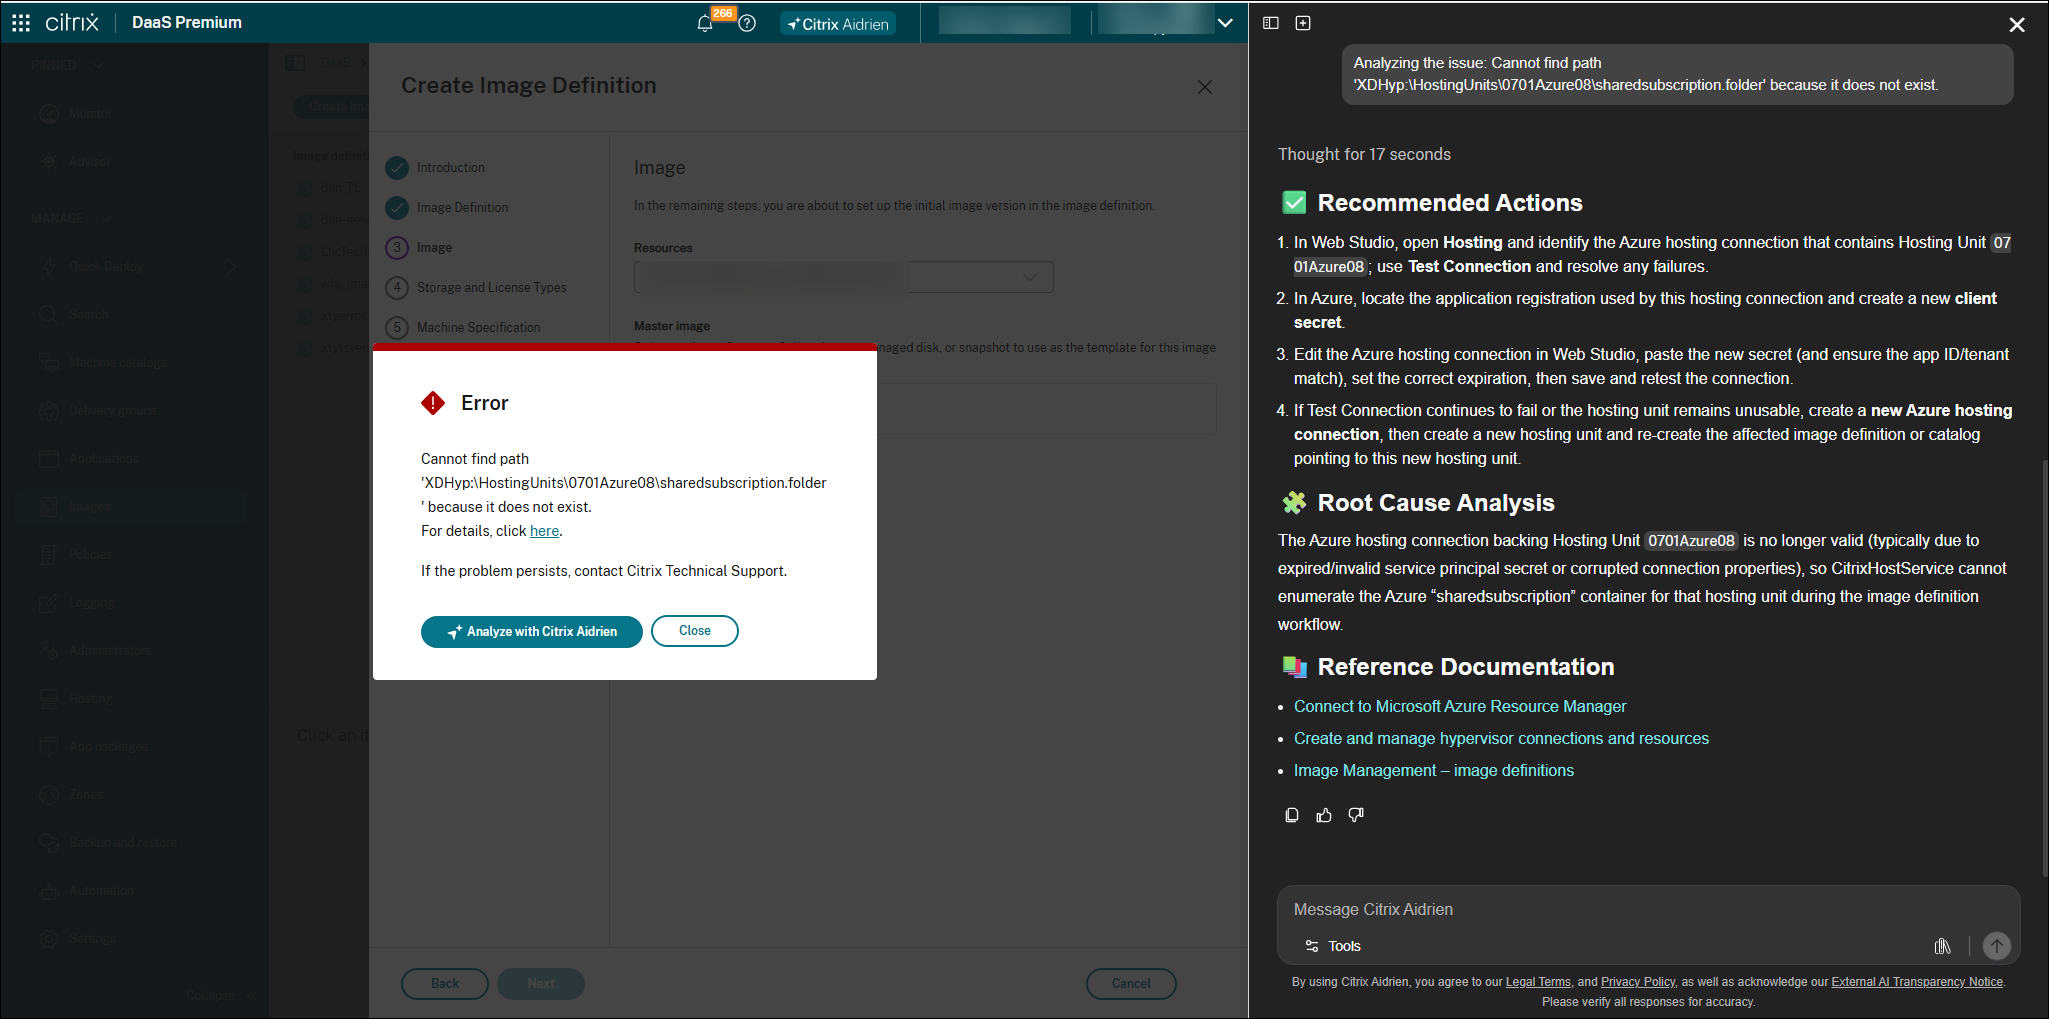
| Studio, warning, and error popups | Select Analyze with Citrix Aidrien in the popup. | Configuration warnings and errors |
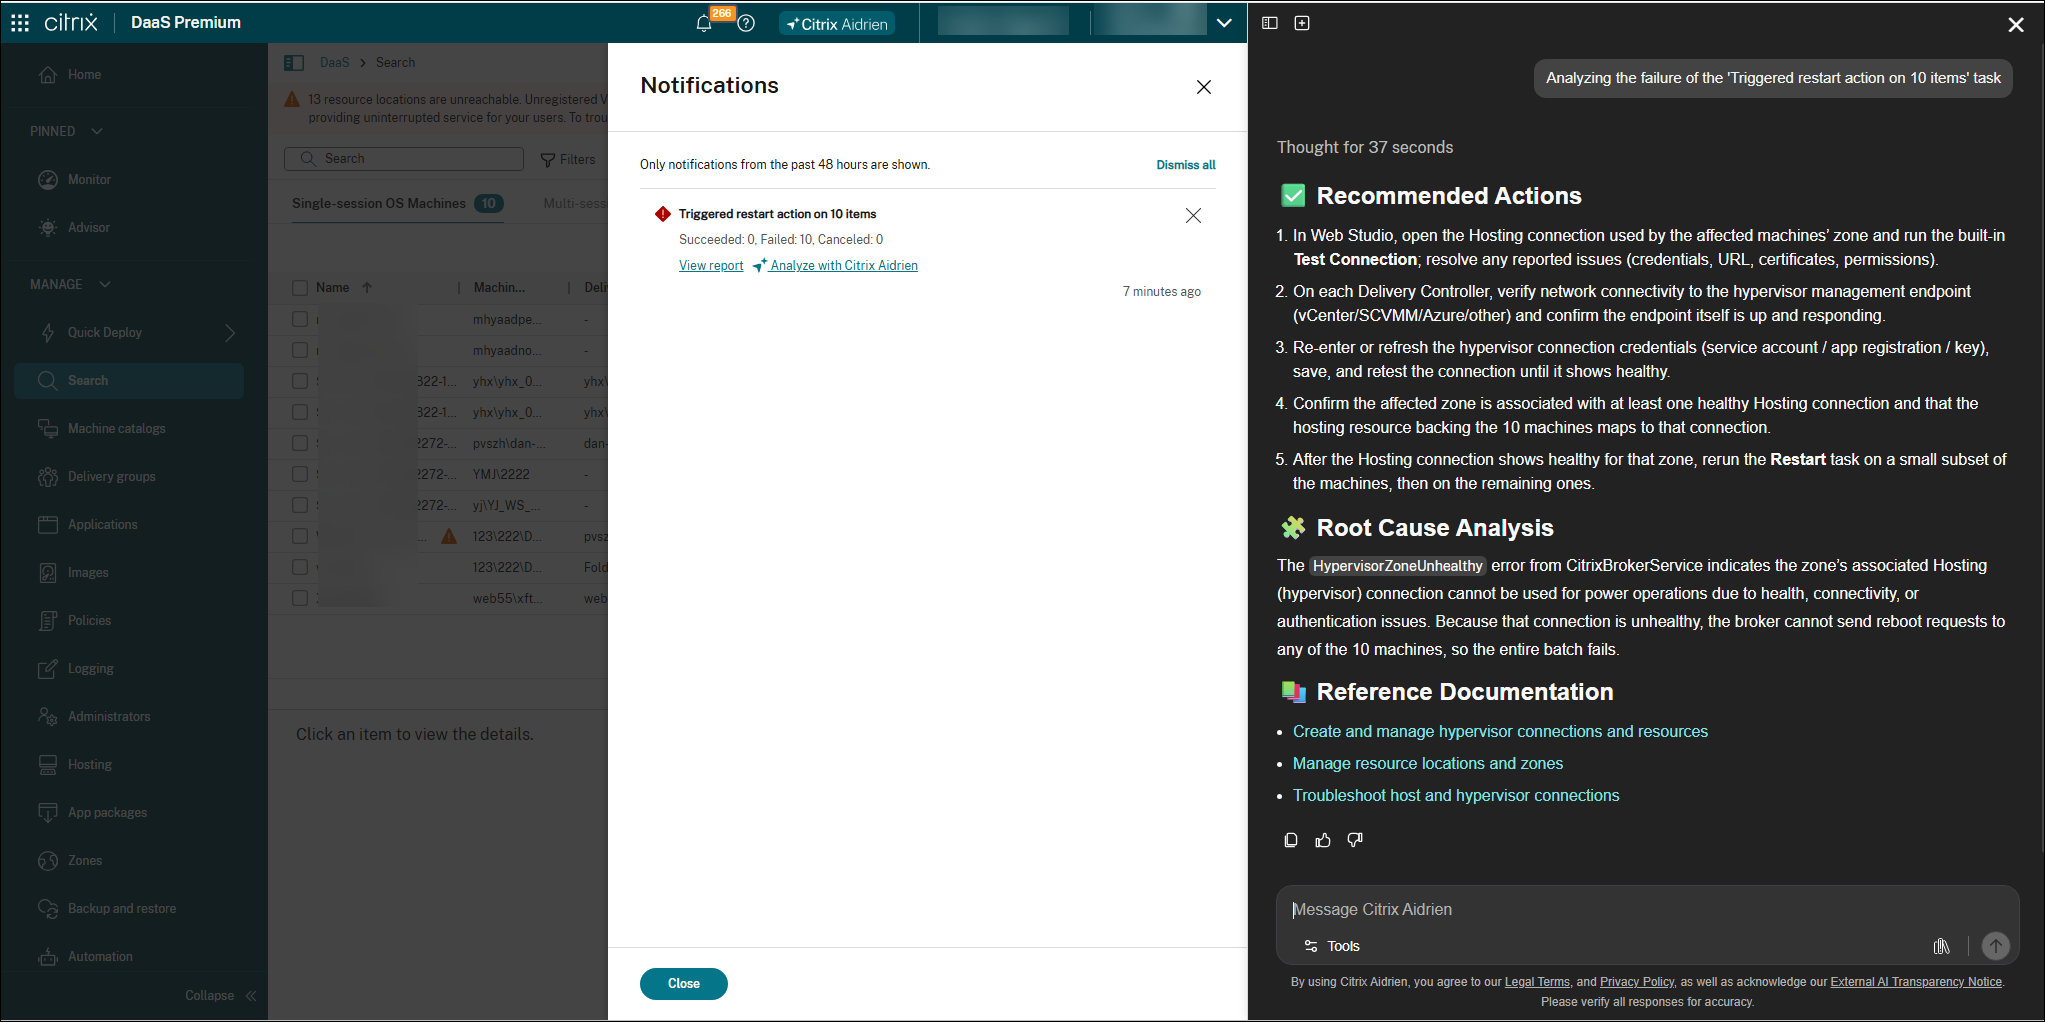
| Studio, Notifications center | Select Analyze with Citrix Aidrien on a reported warning or error. | Configuration warnings and errors |
| On-premises Studio and Citrix Director | Select the Citrix Aidrien button and sign in with Citrix Cloud credentials. | Any use case |
Specialized use cases
Citrix Aidrien provides deep, contextual troubleshooting through specialized sub-agents, with each sub-agent focused on a time-consuming problem in Citrix environments.
| Use case | Sub-agent | What it does | One at a time | Many at once |
|---|---|---|---|---|
| Troubleshoot session performance | Session performance sub-agent | Finds why a user's session is slow and recommends fixes. | Yes | No |
| Troubleshoot machine failures | Failure sub-agent | Finds why machines are unregistered or failed and recommends fixes. | Yes | Yes |
| Troubleshoot connection failures | Failure sub-agent | Finds where and why a session launch failed and recommends fixes. | Yes | Yes |
| Analyze AOT logs | AOT analysis sub-agent | Finds root causes in Always-On Tracing data. Runs automatically with the failure sub-agent when AOT data is available. | Not applicable | Yes |
| Troubleshoot configuration errors in Studio | Not applicable | Explains Studio warnings and errors in context and recommends fixes. | Yes | No |
Troubleshoot session performance
Session slowness is one of the most frequent issues Citrix administrators face. Troubleshooting it requires correlating metrics across Director, endpoint logs, and other tools. The session performance sub-agent finds why a user's session is slow and recommends fixes.
What Citrix Aidrien does:
-
Understands the user baseline: Knows what normal looks like for a specific user, based on historical session data.
-
Compares across peers: Benchmarks the user's experience against other users in the same Delivery Group to detect anomalies.
-
Analyzes session telemetry: Considers ICA round trip time, network latency, endpoint performance, network conditions, and session reliability events.
-
Surfaces root causes: Identifies the most likely cause, such as poor Wi-Fi, an endpoint CPU bottleneck, VDA utilization, or network lag.
What you get back:
-
The most likely cause of the slowness, with the supporting session metrics.
-
How the session compares to the user's baseline and to peers in the same Delivery Group.
-
Recommended actions and reference documentation.
Outcome for customers:
-
Confidence in diagnosis: A clear explanation of why the session is slow.
-
Faster resolution: Recommendations administrators can act on immediately.
Sample prompts:
-
Troubleshoot session slowness for user Jane Doe.
Troubleshoot machine failures
Unregistered machines can bring entire workloads to a halt. Diagnosing them often involves checking network paths, DNS resolution, VDA version compatibility, and more. When many machines fail at once, investigating each machine individually hides the common cause. The failure sub-agent finds why machines are unregistered or failed and recommends fixes for one machine or many.
One machine:
-
Context-aware analysis: Understands the machine's configuration, provisioning method, and Delivery Group.
-
Failure pattern recognition: Identifies common failure signatures and correlates them with known issues.
-
VDA registration health check: Uses the WEM integration with Citrix Monitor to run a health check script that identifies common points of failure.
-
Expert-guided remediation: Pulls in relevant Citrix Knowledge Center articles, support documentation, and best practices for the specific failure.
Start a single machine analysis from the machine details page or Machines Filters in Monitor by selecting Analyze with Citrix Aidrien, or enter a prompt with the machine name.
Multiple machines:
-
Bulk investigation: Analyzes all machine failures of a selected failure type or sub-type in one investigation.
-
Full context: Receives the failure type, count, and sub-type, along with machine IDs, Delivery Groups, audit logs, and associated AOT logs.
-
Cohort triage: For large selections, segments failures into cohorts and guides you through one cohort at a time.
Start a multiple machine analysis from a failure panel in the Monitor Dashboard or Machines Filters. To narrow the scope, select a failure sub-type before you select Analyze with Citrix Aidrien.
Data used:
| Data source | What it provides |
|---|---|
| Machine telemetry | Current and historical machine state, resource utilization, and registration events. |
| Audit logs | Recent configuration changes, policy updates, or administrative actions affecting the machine. |
| Connection history | Session launch attempts and failures associated with the machine. |
| AOT records | Always-On Tracing data from the affected machine, when AOT is enabled. AOT analysis is included automatically. |
What you get back:
-
Root cause analysis for the machine, or for each cohort of machines.
-
Recommended actions and relevant Knowledge Center articles.
-
The evidence used to reach the conclusion.
Outcome for customers:
-
Reduced support escalations: First-line administrators can resolve issues without deep Citrix expertise.
Sample prompts:
-
Troubleshoot why DomainName\VDA-US-123KG is unregistered.
-
Analyze all machines currently failing with the Unregistered failure type.
Troubleshoot connection failures
When a user reports a launch error, administrators must collect logs from the user or correlate transaction logs and timestamps across infrastructure tiers in Monitor. Generic error codes rarely reveal the specific factor that caused the failure. When many connections fail at once, the shared cause is hard to see one transaction at a time. The failure sub-agent finds where and why a session launch failed and recommends fixes for one connection or many.
One connection:
-
Reconstructs the failure: Uses Session Launch Diagnostics logs and failure events from Citrix Monitor to identify the exact stage where the launch failed.
-
Correlates events: Ties the failure to the specific user, machine, and infrastructure telemetry.
-
Checks the target machine: When the root cause is an infrastructure issue, also analyzes the machine the user was connecting to.
Start a single connection analysis from Connections Filters or the Session Launch Diagnostics page in Monitor by selecting Analyze with Citrix Aidrien, or enter a prompt with the user name or transaction ID.
Multiple connections:
-
Bulk investigation: Analyzes all connection failures of a selected failure type or sub-type in one investigation.
-
Full context: Receives the failure type, count, and sub-type, along with transaction IDs, machine IDs, Delivery Groups, audit logs, and associated AOT logs.
-
Cohort triage: For large selections, segments failures into cohorts and guides you through one cohort at a time.
Start a multiple connection analysis from a failure panel in the Monitor Dashboard or Connections Filters. To narrow the scope, select a failure sub-type before you select Analyze with Citrix Aidrien.
Data used:
| Data source | What it provides |
|---|---|
| Transaction logs | Session launch events, brokering records, and handshake sequences. |
| Machine health data | State and health of the target VDA at the time of the connection attempt. |
| Brokering data | Broker decision logs, capacity availability, and Delivery Group assignment. |
| AOT records | Always-On Tracing data for the connection path, when AOT is enabled. AOT analysis is included automatically. |
What you get back:
-
The launch stage where the failure occurred and the likely cause. For example: "Jane Doe's session failed at the Credentials Verification stage due to a Broker timeout."
-
For multiple connections, the root cause for each cohort.
-
Recommended actions and the evidence used.
Outcome for customers:
-
Precision over patterns: The specific sequence of events and environmental factors for one transaction ID.
-
Reduced MTTR: No manual correlation of transaction logs across infrastructure tiers.
Sample prompts:
-
Analyze the last session failure for user Jane Doe.
-
Analyze the transaction ID transaction123.
Analyze AOT logs
Always-On Tracing (AOT) data contains detailed evidence for complex failures, but reading traces manually requires deep expertise and time. The AOT analysis sub-agent finds root causes in Always-On Tracing data and recommends next steps.
What Citrix Aidrien does:
-
Parses AOT traces: Identifies failure patterns, timing anomalies, and error sequences.
-
Ranks probable causes: Produces a root cause assessment based on the trace evidence.
-
Recommends next steps: Returns actionable recommendations inline in the chat panel.
Two analysis paths are available:
-
Integrated analysis: Citrix Aidrien accesses AOT data directly through the Monitor integration. The failure sub-agent includes AOT analysis automatically when AOT data is available.
-
File upload: Upload an AOT log file (.log, .txt, .json, .xml, .csv) to the chat panel.
What you get back:
| Section | Description |
|---|---|
| Summary | Overview of the AOT trace scope (time range, machine, session). |
| Identified issues | Errors, warnings, and anomalies detected in the trace data. |
| Timing analysis | Latency breakdowns and timing anomalies across the trace sequence. |
| Root cause assessment | Ranked list of probable causes based on the trace evidence. |
| Recommended next steps | Suggested actions to resolve the identified issues. |
Troubleshoot configuration errors in Studio
Configuration warnings and errors in Studio often require searching documentation to understand the cause and the resolution. Citrix Aidrien explains Studio warnings and errors in context and recommends fixes.
What Citrix Aidrien does:
-
Contextual analysis: Reviews the warning or error together with the affected resource, such as a machine catalog or hosting connection.
-
Root cause identification: Explains the most likely cause of the issue, without searching documentation.
-
Guided recommendations: Returns step-by-step troubleshooting recommendations to resolve the issue.
Where to start:
-
Troubleshoot tab: Use the Troubleshoot tab in a resource's details view to review detected issues and analyze them with Citrix Aidrien.
-
Warning and error popups: When Studio displays a warning or error message, you can launch Citrix Aidrien directly from the popup to analyze the issue and receive contextual guidance.
-
Notifications center: You can also access Citrix Aidrien from the Notifications center when warnings or errors are reported. Launch Citrix Aidrien to investigate the issue without navigating away from your current workflow.
What you get back:
-
The root cause of the warning or error and the affected resource, such as a hosting connection with an expired service principal secret.
-
Recommended actions, with steps in Studio or in the related platform, such as the hypervisor or cloud provider.
-
Links to the relevant Citrix documentation.
Outcome for customers:
-
Faster diagnosis: Reduces the time required to diagnose and resolve configuration issues.
-
Stay in your workflow: Investigate without navigating away from Studio.
Sample prompts:
-
Not required. Citrix Aidrien builds the prompt from the selected warning or error.
Explore your site data
Ask Citrix Aidrien about your site in natural language. Citrix Aidrien retrieves the data and displays it directly in the chat, so you can investigate without leaving the conversation. Answers include only the data within your administrator scope.
What you can ask about:
| Topic | What you get | Example |
|---|---|---|
| Machine states and details | Real-time state of any VDA or machine, including configuration details useful for troubleshooting. | What is the state of my DomainName\VDA-US-123KG? |
| Machine failures | Machines with recent failures, with guided troubleshooting steps. | List the machines with recent failures and help me troubleshoot them. |
| Machine configurations | Machine Catalog, Delivery Group, provisioning method, and Broker policy details for any machine. | List the configuration details of my DomainName\VDA-US-123KG. |
| Host configurations | Hypervisor host configuration and host-level resource allocations. | Show me the list of hypervisors in my environment. |
| Machine resource utilization | CPU, memory, disk IOPS, and disk latency for machine performance troubleshooting. | Are my VDAs having high resource utilization; if yes, troubleshoot it for me. |
| VDA registration and communication | Registration issues and VDA version compatibility with Delivery Controllers. | Why are my VDAs unregistered? Is the correct VDA version installed on DomainName\VDA-US-123KG, and is it compatible with the Delivery Controller? |
| Session state and performance | State and performance metrics for specific user sessions. | What are the session metrics for user "Jane Doe"? |
| Session logon breakdown | Duration of each logon stage, to identify delays or failures. | What are the logon metrics for user "Jane Doe"? |
| Questions across your Monitor data | Validated, schema-accurate Monitor OData queries generated from natural language, for questions about machine usage, sessions, failures, and performance trends. | Show me failed logins |
Search for resources
| Data type | Description | Example queries |
|---|---|---|
| Machines | Search for machines and view machine-specific details. | Show all unregistered machines; Find machines with registration issues; Show details for machine VDA-001 |
| Sessions | Search for user sessions and view session details. | Show active sessions; Find sessions for user John Smith; Show details for a specific session |
| Machine catalogs | Search for machine catalogs and view catalog details, including configuration and resource information. | Show all machine catalogs; Find machine catalogs containing "Windows 11"; Show details for the Finance machine catalog |
| Delivery groups | Search for delivery groups and view delivery group details. | List all delivery groups; Find delivery groups assigned to Finance users; Show details for the Finance delivery group |
Work with large results
When a response contains a large volume of data, such as a list of machines, catalogs, or sessions, Citrix Aidrien displays the results in an interactive table in the chat panel.
| Capability | Description |
|---|---|
| Inline display | Up to 200 records displayed directly in the chat panel. |
| Filter | Filter table rows by column values. |
| Search | Search across all columns to find specific records. |
| Pagination | Navigate through records when the result set exceeds the visible rows. |
| Copy | Copy the table contents to the clipboard. |
| Export to CSV | Export result sets that exceed the inline display limit, up to 10,000 records or 3 MB, whichever is reached first. |
Limitations:
-
Exported CSV files are not retained in chat history.
-
Large result display and CSV export are available for data from Monitor APIs only, not for data from Studio APIs.
Data, privacy, and feedback
-
Customer data is not used to train large language models.
-
Prompts and responses are stored to support chat history.
-
Answers about your environment honor the administrator scopes set in Citrix Cloud.
-
To share feedback, select the thumbs up or thumbs down icon on any response, or email citrix.copilot@cloud.com.
-
For more information, see Data security and FAQ.
Current limitations
-
Citrix Aidrien can help with many Citrix DaaS tasks, but it might not be able to complete every request. For unsupported requests, Citrix Aidrien offers suggestions or a reference to related documentation.
-
Citrix Aidrien does not modify configurations or perform remediation actions. You perform the recommended steps.
-
Answers about your environment are limited to the data described in this article and to your administrator scope.
-
Some responses that display lists are limited to the top N items.
Citrix environment data
-
Machine states and details: Get real-time information on the state of any Virtual Delivery Agent (VDA) or machine, including configuration details useful for troubleshooting. Here is an example:
-
"What is the state of my DomainName\VDA-US-123KG?"
-
-
Machine failures: Identify machines with recent failures and receive guided troubleshooting steps based on machine state and configuration. Here is an example:
-
"List the machines with recent failures and help me troubleshoot them."
-
-
Machine configurations: Access detailed configuration data for any machine, including Machine Catalogs, Delivery Groups, Provisioning methods, and Broker Policies. Here is an example:
-
"List the configuration details of my DomainName\VDA-US-123KG."
-
-
Host configurations: Fetch hypervisor host configuration details to assist in troubleshooting VDAs and understanding host-level resource allocations. Here is an example:
-
"Show me the list of hypervisors in my environment."
-
-
Machine resource utilization: Monitor machine resource utilization, such as CPU, Memory, Disk IOPS, and Disk latency, for machine performance troubleshooting, and reporting. Here is an example:
-
"Are my VDAs having high resource utilization; if yes, troubleshoot it for me."
-
-
VDA registration and communication: Diagnose registration issues and verify VDA version compatibility with Delivery Controllers. Here are a few examples:
-
"Why are my VDAs unregistered?"
-
"Is the correct VDA version installed on DomainName\VDA-US-123KG, and is it compatible with the Delivery Controller?"
-
-
Session state and performance details: Information about specific user sessions, including their state and performance metrics, enabling analysis for individual users or groups. Here is an example:
-
"What is the session metrics for user “Jane Doe”?"
-
-
Session logon breakdown: Fetch and analyze each stage of the session logon process for a user session, to identify delays or failures during logon. Here is an example:
-
"What are the logon metrics for user "Jane Doe”?"
-
-
OData query generation: Constructs responses on DaaS environments. This capability converts the natural user intent (“Show me failed logins”) and the strict schema requirements of Citrix Monitor’s OData API into outcomes. The feature resolves common challenges such as terminology mismatches, schema ambiguity, syntax errors by generating validated, schema‑accurate OData queries. Combined with Citrix Aidrien’s natural language conversation capabilities, you can now reliably inquire about your data, enabling richer data exploration across machine usage, sessions, failures, and performance trends.-->