Self-service search
What is self-service search?
The self-service search feature enables you to find and filter user events received from your data sources. You can explore the underlying user events and their attributes. These events help you to identify any data issues and troubleshoot them. The search page displays various facets (dimensions) and metrics for a data source. You can define your search query and apply filters to view the events that match your defined criteria. By default, the self-service search page displays user events for the last one day.
Currently, the self-service search feature is available for the following data sources:
Also, you can perform self-service search on the events that met your defined policies. For more information, see Self-service search for Policies.
How to access self-service search
You can access the self-service search by using the following options:
-
Top bar: Click Search from the top bar to view all user events for the selected data source.
-
Risk timeline on a user profile page: Click Event Search to view the events for the respective user.
Self-service search from the top bar
Use this option to go to the self-service search page from any place in the user interface.
-
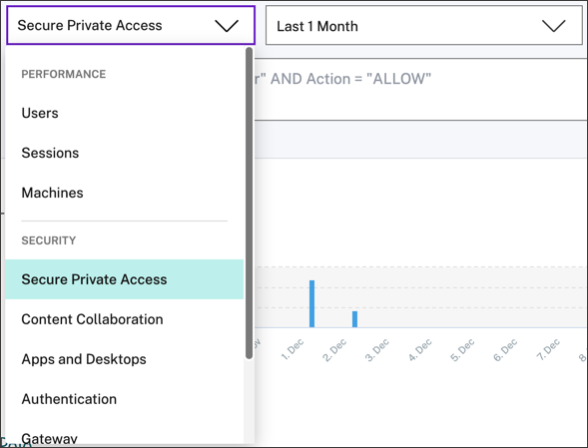
Click Search to view the self-service page.

-
Select the data source and the time period to view the corresponding events.
Self-service search from user’s risk timeline
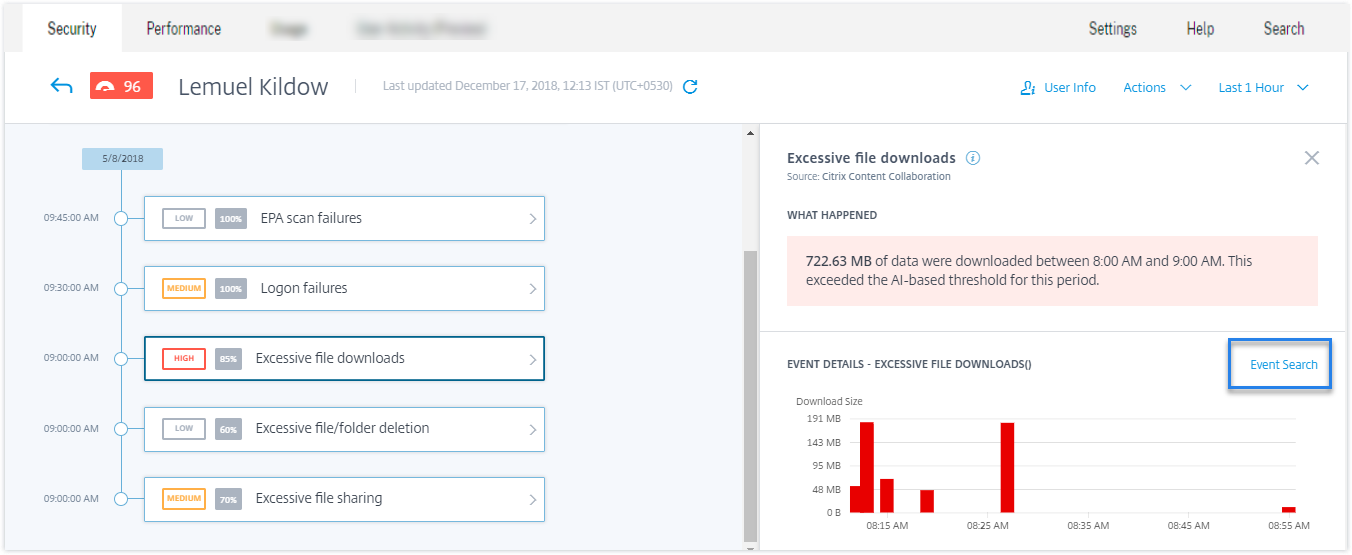
Use this option if you want to view the user events associated with a risk indicator.
When you select a risk indicator from a user’s timeline, the risk indicator information section is displayed on the right pane. Click Event Search to explore the events associated to the user and the data source (for which the risk indicator is triggered) on the self-service search page.
For more information on the user risk timeline, see Risk timeline.
How to use self-service search
Use the following features on the self-service search page:
-
Facets to filter your events.
-
Search box to enter your query and filter events.
-
Time selector to select the time period.
-
Timeline details to view the event graphs.
-
Event data to view the events.
-
Export to CSV format to download your search events as a CSV file.
-
Export visual summary to download the visual summary report of your search query.
-
Multicolumn sorting to sort the events by multiple columns.
Use facets to filter events
Facets are the summary of data points that constitute an event. Facets vary depending on the data source. For example, the facets for the Secure Private Access data source are reputation, actions, location, and category group. Whereas the facets for Apps and Desktops are event type, domain, and platform.
Select the facets to filter your search results. The selected facets are displayed as chips.
For more information on the facets corresponding to each data source, see the self-service search article for the data source mentioned earlier in this article.
Use search query in the search box to filter events
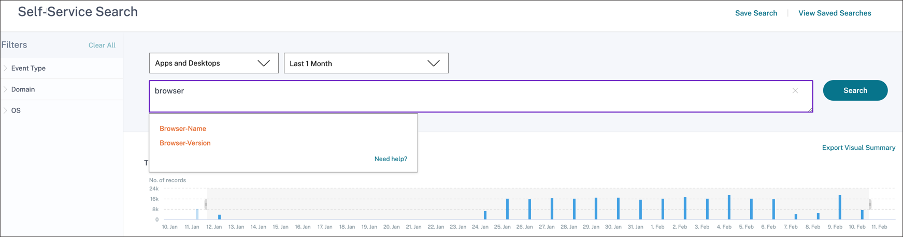
When you place your cursor in the search box, the search box displays a list of dimensions based on the user events. These dimensions vary according to the data source. Use the dimensions and the valid operators to define your search criteria and search for the required events.
For example, in the self-service search for Apps and Desktops, you get the following values for the dimension Browser. Use the dimension to type your query, select the time period, and then click Search.
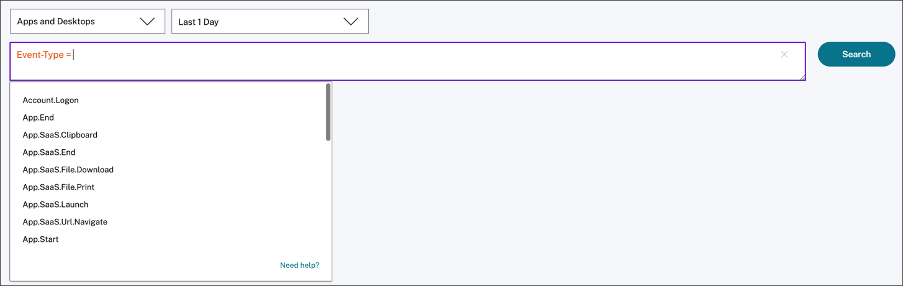
When selecting certain dimensions like Event-Type and Clipboard-Operation along with a valid operator, the values of the dimension are shown automatically. You can choose a value from the suggested options or enter a new value depending on your requirements.
Supported operators in search query
Use the following operators in your search queries to refine your search results.
| Operator | Description | Example | Output |
|---|---|---|---|
| Assign a value to a search dimension. | User-Name : John | Displays events for the user John. | |
= |
Assign a value to a search dimension. | User-Name = John | Displays events for the user John. |
~ |
Search events with similar values. | User-Name ~ test | Displays events having similar user names. |
"" |
Enclose values separated by spaces. | User-Name = “John Smith” | Displays events for the user John Smith. |
< >
|
Search for relational value. | Data Volume > 100 | Displays events where data volume is greater than 100 GB. |
AND |
Search events where the specified conditions are true. | User-Name : John AND Data Volume > 100 | Displays events of user John where data volume is greater than 100 GB. |
!~ |
Checks events for the matching pattern that you specify. This NOT LIKE operator returns the events that do not contain the matching pattern anywhere in the event string. | User-Name !~ John | Displays events for the users except John, John Smith, or any such users that contain the matching name “John”. |
!= |
Checks events for the exact string that you specify. This NOT EQUAL operator returns the events that do not contain the exact string anywhere in the event string. | Country != USA | Displays events for the countries except USA. |
* |
Search events that match the specified strings. Currently, the * operator is supported only with the following operators :, =, and !=. The search results are case-sensitive. |
User-Name = John* | Displays events for all user names that begin with John. |
| User-Name = John | Displays events for all user names that contain John. | ||
| User-Name = *Smith | Displays events for all user names that end with Smith. | ||
| User-Name : John* | Displays events for all user names that begin with John. | ||
| User-Name : John | Displays events for all user names that contain John. | ||
| User-Name : *Smith | Displays events for all user names that end with Smith. | ||
| User-Name != John* | Displays events for all user names that do not begin with John. | ||
| User-Name != *Smith | Displays events for all user names that do not end with Smith. | ||
IN |
Assign multiple values to a search dimension to get the events related to one or more values. Note: Currently, you can use this operator with the following dimensions of Apps and Desktops- Device ID, Domain, Event-Type, and User-Name. This operator is applicable only for the string values. |
User-Name IN (John, Kevin) | Find all events related to John or Kevin. |
NOT IN |
Assign multiple values to a search dimension and find the events that do not contain the specified values. Note: Currently, you can use this operator with the following dimensions of Apps and Desktops- Device ID, Domain, Event-Type, and User-Name. This operator is applicable only for the string values. |
User-Name NOT IN (John, Kevin) | Find the events for all users except John and Kevin. |
IS EMPTY |
Checks for null value or empty value for a dimension. This operator works for only string type dimensions such as App-Name, Browser, and Country. It does not work for non-string (number) type dimensions such as Upload-File-Size, Download-File-Size, and Client-IP. |
Country IS EMPTY | Find events where the country name is not available or empty (not specified). |
IS NOT EMPTY |
Checks for not null value or a specific value for a dimension. This operator works for only string type dimensions such as App-Name, Browser, and Country. It does not work for non-string (number) type dimensions such as Upload-File-Size, Download-File-Size, and Client-IP. |
Country IS NOT EMPTY | Find events where the country name is available or specified. |
OR |
Searches for values where either or both conditions are true. | (User-Name = John* OR User-Name = *Smith) AND Event-Type = “Session.Logon” |
Displays Session.Logon events for all user names that begin with John or end with Smith. |
Note
For the NOT EQUAL operator, while entering the values for the dimensions in your query, use the exact values available on the self-service search page for a data source. The dimension values are case-sensitive.
For more information on how to specify your search query for the data source, see the self-service search article for the data source mentioned earlier in this article.
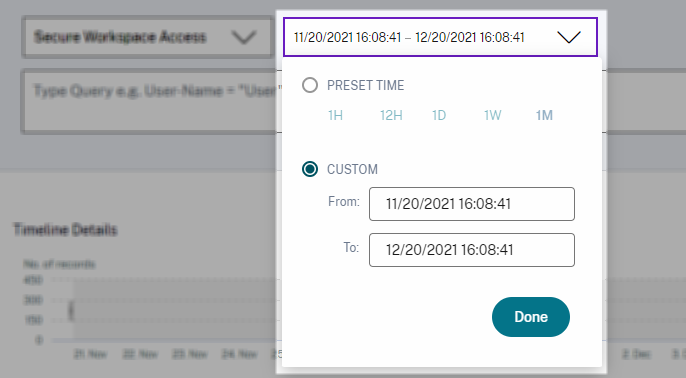
Select time to view event
Select a preset time or enter a custom time range and click Search to view the events.
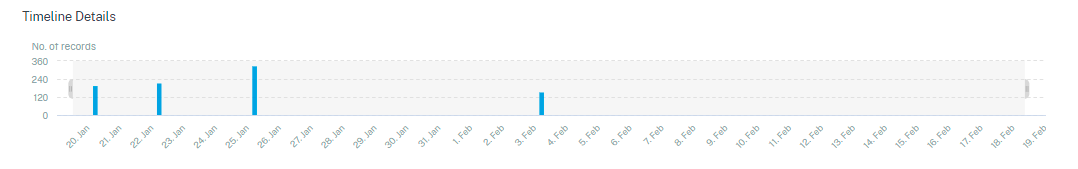
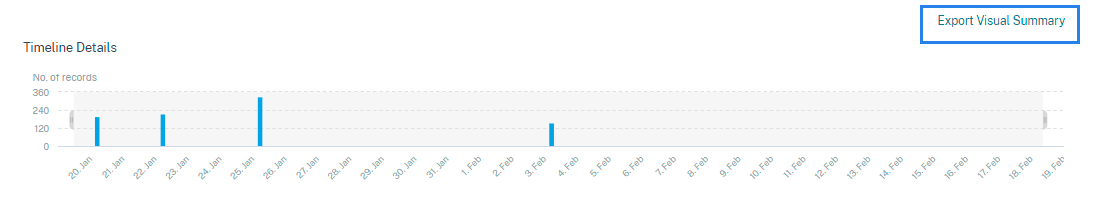
View the timeline details
The timeline provides a graphical representation of user events for the selected time period. Move the selector bars to choose the time range and view the events corresponding to the selected time range.
The figure shows timeline details for access data.
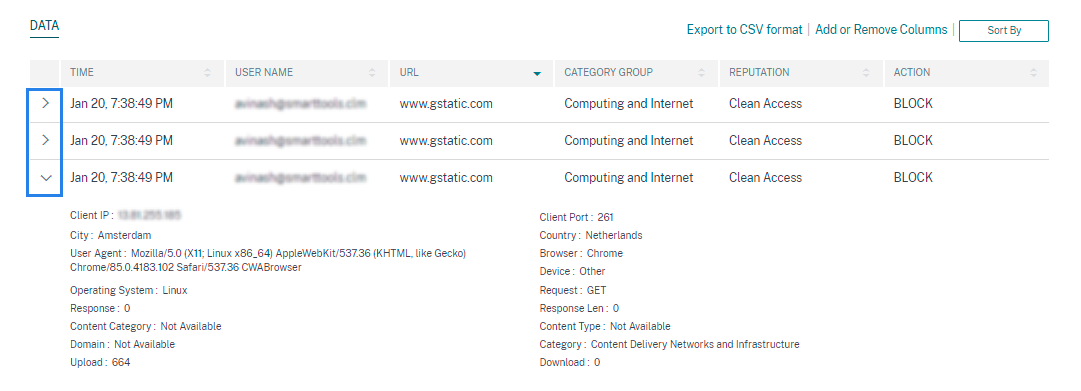
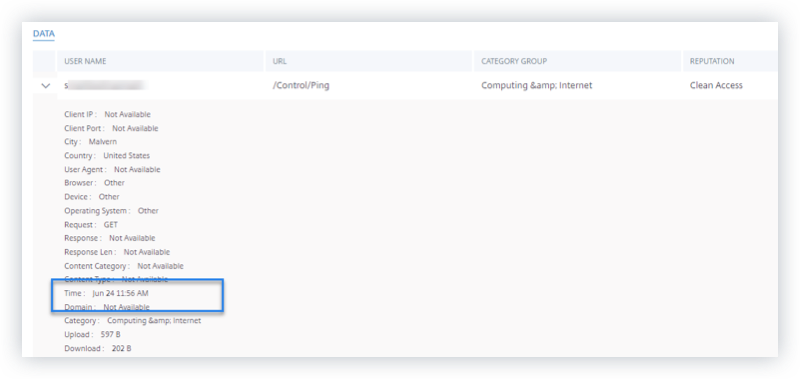
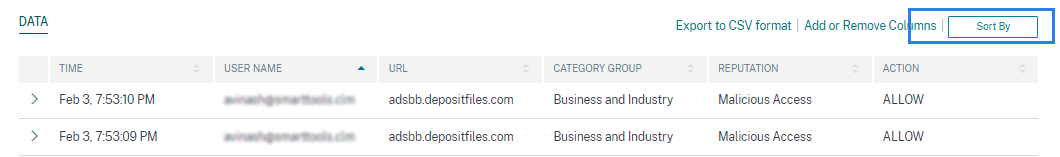
View the event
You can view the detailed information about the user event. On the DATA table, click the arrow for each column to view the user event details.
The figure shows the details about the user’s access data.
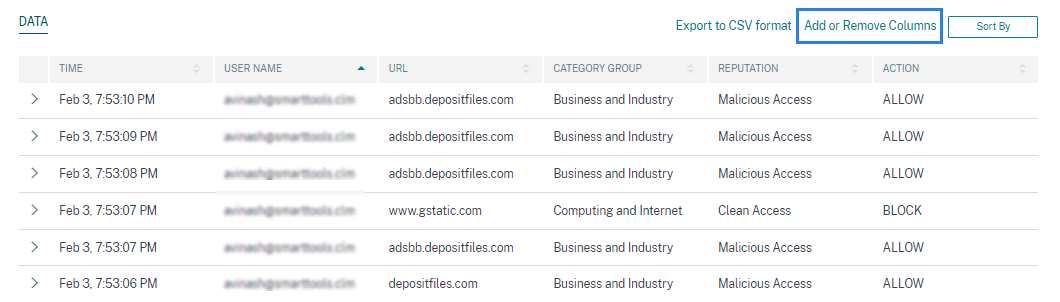
Add or remove columns
You can either add or remove columns from the event table to display or hide the corresponding data points. Do the following:
-
Click Add or Remove Columns.
-
Select or deselect the data elements from the list and then click Update.
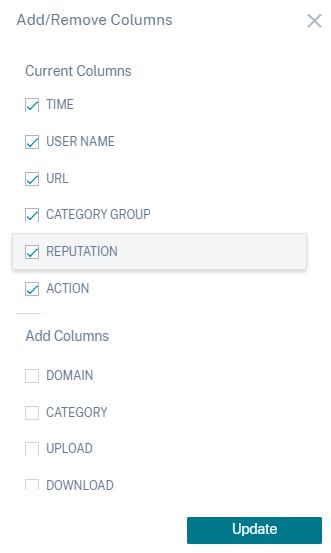
If you deselect a data point from the list, the corresponding column is removed from the event table. However, you can view that data point by expanding the event row for a user. For example, when you deselect the TIME data point from the list, the TIME column is removed from the event table. To view the time record, expand the event row for a user.
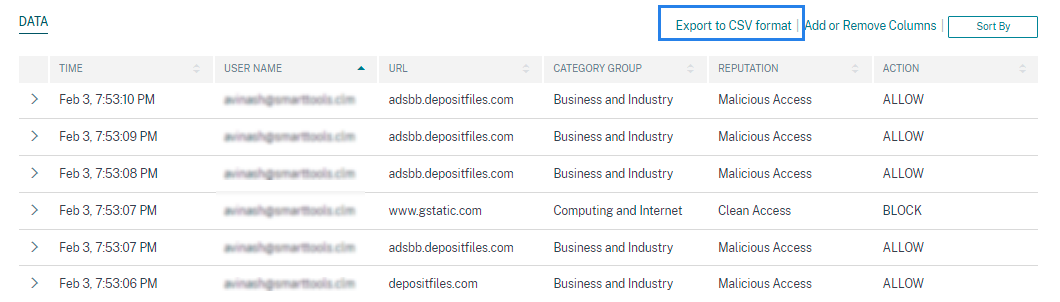
Export the events to a CSV file
Export the search results to a CSV file and save it for your reference. Click Export to CSV format to export the events and download the CSV file that is generated. You can export 100K rows using the Export to CSV format feature.
Export visual summary
You can download the visual summary report of your search query and share a copy with other users, administrators, or your executive team.
Click Export Visual Summary to download the visual summary report as a PDF. The report contains the following information:
-
The search query that you have specified for the events for the selected time period.
-
The facets (filters) that you have applied on the events for the selected time period.
-
The visual summary such as the timeline charts, bar charts, or graphs of the search events for the selected time period.
For a data source, you can download the visual summary report only if the data is displayed in visual formats such as bar charts, timeline details. Otherwise, this option is not available. For example, you can download the visual summary report of the data sources such as Apps and Desktops, Sessions, where you see data as timeline details and bar charts. For the data sources such as Users and Machines, you see data only in tabular format. Therefore, you cannot download any visual summary report.
Multi-column sorting
Sorting helps to organize your data and provides better visibility. On the self-service search page, you can sort the user events by one or more columns. The columns represent the values of various data elements such as user name, date and time, and URL. These data elements vary based on the selected data sources.
To perform a multi-column sorting, do the following:
-
Click Sort By.
-
Select a column from the Sort By list.
-
Select the sorting order- ascending (up arrow) or descending (down arrow) to sort the events in the column.
-
Click + Add Columns.
-
Select another column from the Then By list.
-
Select the sorting order- ascending (up arrow) or descending (down error) to sort the events in the column.
Note
You can add up to six columns to perform the sorting.
-
Click Apply.
-
If you do not want to apply the preceding settings, click Cancel. To remove the values of the selected columns, click Clear All.
The following example shows a multi-column sort on the Secure Private Access events. The events are sorted by time (in latest to oldest order) and then by URL (in alphabetical order).
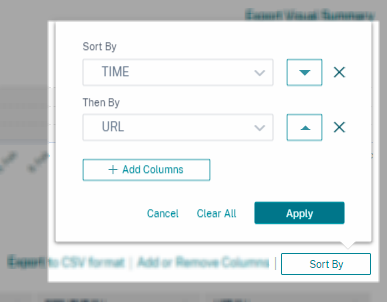
Alternatively, you can perform multi-column sorting by using the Shift key. Press the Shift key and click the column headers to sort the user events.
How to save the self-service search
As an administrator, you can save a self-service query. This feature saves the time and effort of rewriting the query that you use often for analysis or troubleshooting. The following options are saved with the query:
- Applied search filters
- Selected data source and duration
Do the following to save a self-service query:
-
Select the required data source and duration.
-
Type a query in the search bar.
-
Apply the required filters.
-
Click Save Search.
-
Specify the name to save the custom query.
Note
Ensure that the query name is unique. Otherwise, the query does not save.
-
Enable the Schedule email report button if you want to send a copy of the search query report to yourself and other users at a regular interval. For more information, see Schedule an email for a search query.
-
Click Save.
To view the saved searches:
-
Click View Saved Searches.
-
Click the name of the search query.
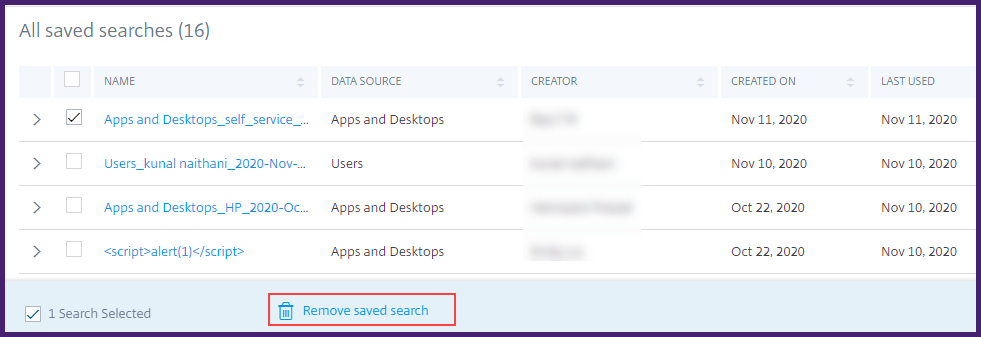
To remove a saved search:
-
Click View Saved Searches.
-
Select the search query that you have saved.
-
Click Remove saved search.
To modify a saved search:
-
Click View Saved Searches.
-
Click the name of the search query that you have saved.
-
Modify the search query or the facet selection based on your requirement.
-
Click Update Search > Save to update and save the modified search with the same search query name.
-
If you want to save the modified search with a new name, click the down arrow and click Save as new search > Save As.
If you replace the search with a new name, the search is saved as a new entry. If you retain the existing search name while replacing, then the modified search data overrides the existing search data.
Note
- Only a query owner can modify or remove their saved searches.
- You can copy the saved search link address to share with another user.
Schedule an email for a search query
You can send a copy of the search query report to yourself and other users on regular intervals by setting up an email delivery schedule.
This option is available only if your search query report contains data in visual formats such as bar charts, timeline details. Otherwise, you cannot schedule an email delivery. For example, you can schedule an email for the data sources such as Apps and Desktops, Sessions, where you see data as timeline details and bar charts. For the data sources such as Users and Machines, you see data only in tabular format. Therefore, you cannot schedule an email.
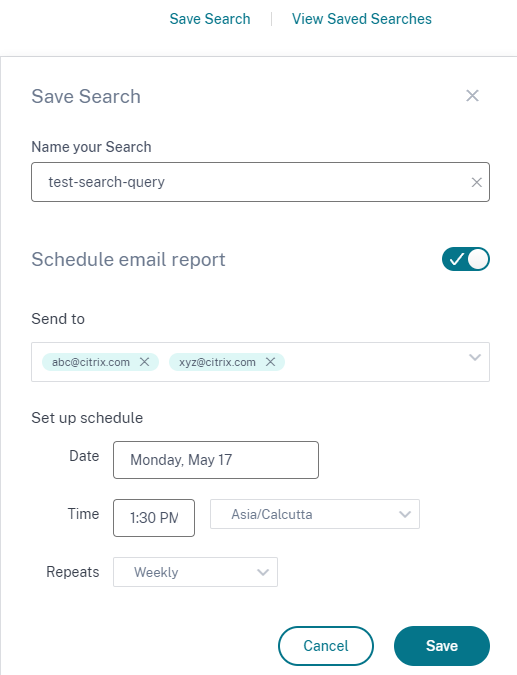
Schedule an email while saving a search query
While saving a search query, set up an email delivery schedule as follows:
-
On the Save Search dialog box, enable the Schedule email report button.
-
Enter or paste the email addresses of the recipients.
Note
Email groups are not supported.
-
Set the date and time for the email delivery.
-
Select the delivery frequency- daily, weekly, or monthly.
-
Click Save.
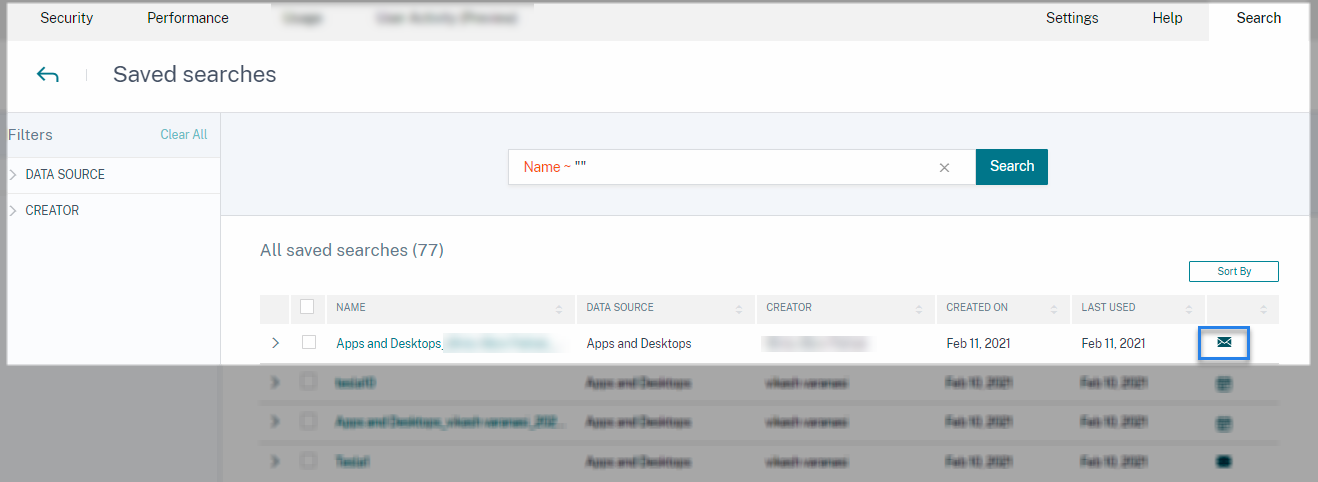
Schedule an email for an already saved search query
If you want to set up an email delivery schedule for a search query that you previously saved, do the following:
-
Click View Saved Searches.
-
Go to the search query that you have created. Click the Email this query icon.
Note
Only a query owner can schedule email delivery of their saved search query.
-
Enable the Schedule email report button.
-
Enter or paste the email addresses of the recipients.
Note
Email groups are not supported.
-
Set the date and time for the email delivery.
-
Select the delivery frequency- daily, weekly, or monthly.
-
Click Save.
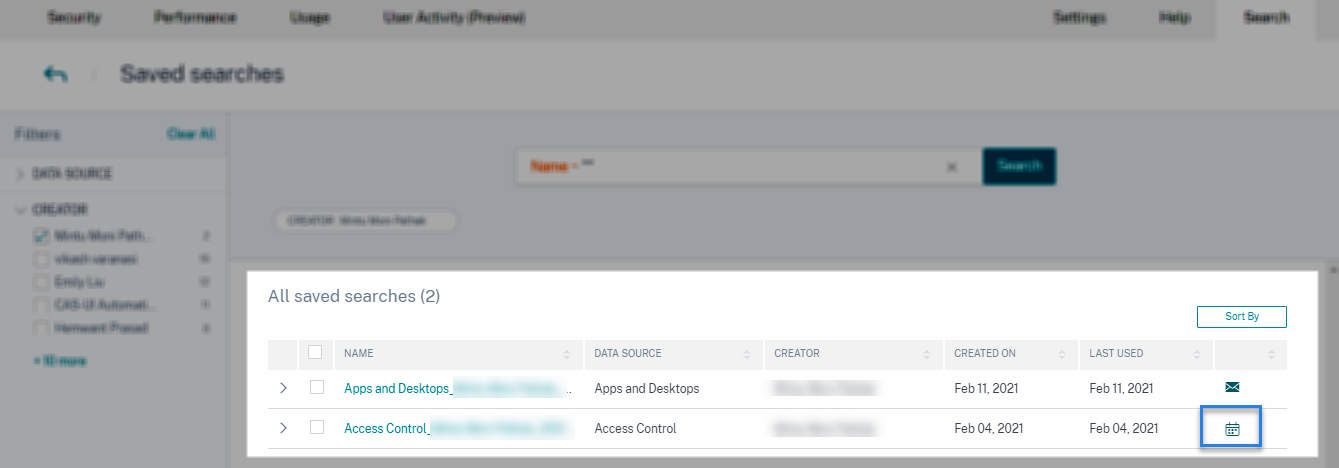
Stop an email delivery schedule for a search query
-
Click View Saved Searches.
-
Go to the search query that you have created. Click the View email delivery schedule icon.
Note
Only a query owner can stop the email schedule of their saved search query.
-
Disable the Schedule email report button.
-
Click Save.
Email content
The recipients receive an email from “Citrix Cloud - Notifications donotreplynotifications@citrix.com” about the search query report. The report is attached as a PDF document. The email is sent at a regular interval defined by you in the Schedule email report settings.
The search query report contains the following information:
-
The search query that you have specified for the events for the selected period.
-
The facets (filters) that you have applied on the events.
-
The visual summary such as the timeline charts, bar charts, or graphs of the search events.
Permissions for full access and read-only access administrators
-
If you are a Citrix Cloud™ administrator with full access, you can use all the features available on the Search page.
-
If you are a Citrix Cloud administrator with read-only access, you can only do the following activities on the Search page:
-
View the search results by selecting a data source and the time period.
-
Enter a search query and view the search results.
-
View the saved search results of other administrators.
-
Export the visual summary and download the search results as a CSV file.
-
For information about the administrator roles, see Manage administrator roles for Citrix Analytics.