
Local Host Cache Visibility Tool
This article describes the Local Host Cache (LHC) Real-time Visibility Tool, a PowerShell-based solution that provides visibility into Citrix Local Host Cache environments. Using this tool, you can monitor Cloud Connector health, identify the elected leader during LHC mode, control-forced outage mode, and query event logs to troubleshoot LHC behavior.
Overview
The Local Host Cache (LHC) Real-time Visibility Tool is a comprehensive PowerShell-based solution for providing visibility in Citrix Local Host Cache environments. It provides both a command-line interface and simple GUIs accessible from the Cloud Connector for you to:
-
Discover Cloud Connectors in a zone or resource location.
-
Identify the elected leader during LHC mode.
-
Enable or disable forced outage mode across all Cloud Connectors in the zone or resource location.
-
Query event logs from specific providers and Event IDs.
-
Run Broker PowerShell commands on the elected leader.
Prerequisites
Before you deploy and run the Local Host Cache Visibility Tool, make sure that your environment meets the following system requirements, permissions, and file requirements.
System requirements
-
Windows Server 2016 or later
-
PowerShell 5.1 or higher
-
Must be run on a Citrix Cloud Connector™
-
Required services:
-
Citrix High Availability Service
-
Citrix ConfigSync Service
-
Permissions
-
Administrator privileges on the local machine
-
Remote PowerShell execution permissions for all Cloud Connectors in the zone
-
Network connectivity to all Cloud Connectors
Files required
-
LHCVisibilityTool.ps1- Core PowerShell module -
LHCVisibilityToolGUI.ps1- GUI application -
HighAvailabilityServiceControl.psm1- Citrix HA Service Control module
The GUI PowerShell script is located at:
C:\Program Files\Citrix\Broker\Service\LHCVisibilityToolScripts
Get started
Before you run the tool, set the PowerShell execution policy using one of the following options:
-
Option 1: RemoteSigned (more restrictive):
Set-ExecutionPolicy -ExecutionPolicy RemoteSigned -Scope CurrentUser -
Option 2: Current session only (temporary):
Set-ExecutionPolicy -ExecutionPolicy Bypass -Scope Process
Note:
You might need to run PowerShell as Administrator to change the execution policy. If you have only user-level permissions, use
-Scope CurrentUser.
Use the tool via the GUI application
The GUI provides a tabbed interface for discovering Cloud Connectors, controlling outage mode, querying event logs, and running broker commands. After you launch the tool, select a task to go to its instructions:
Launch the GUI
cd "C:\Program Files\Citrix\Broker\Service\LHCVisibilityToolScripts"
 .\LHCVisibilityToolGUI.ps1
The tool uses a three-tab layout with a persistent status bar at the bottom.
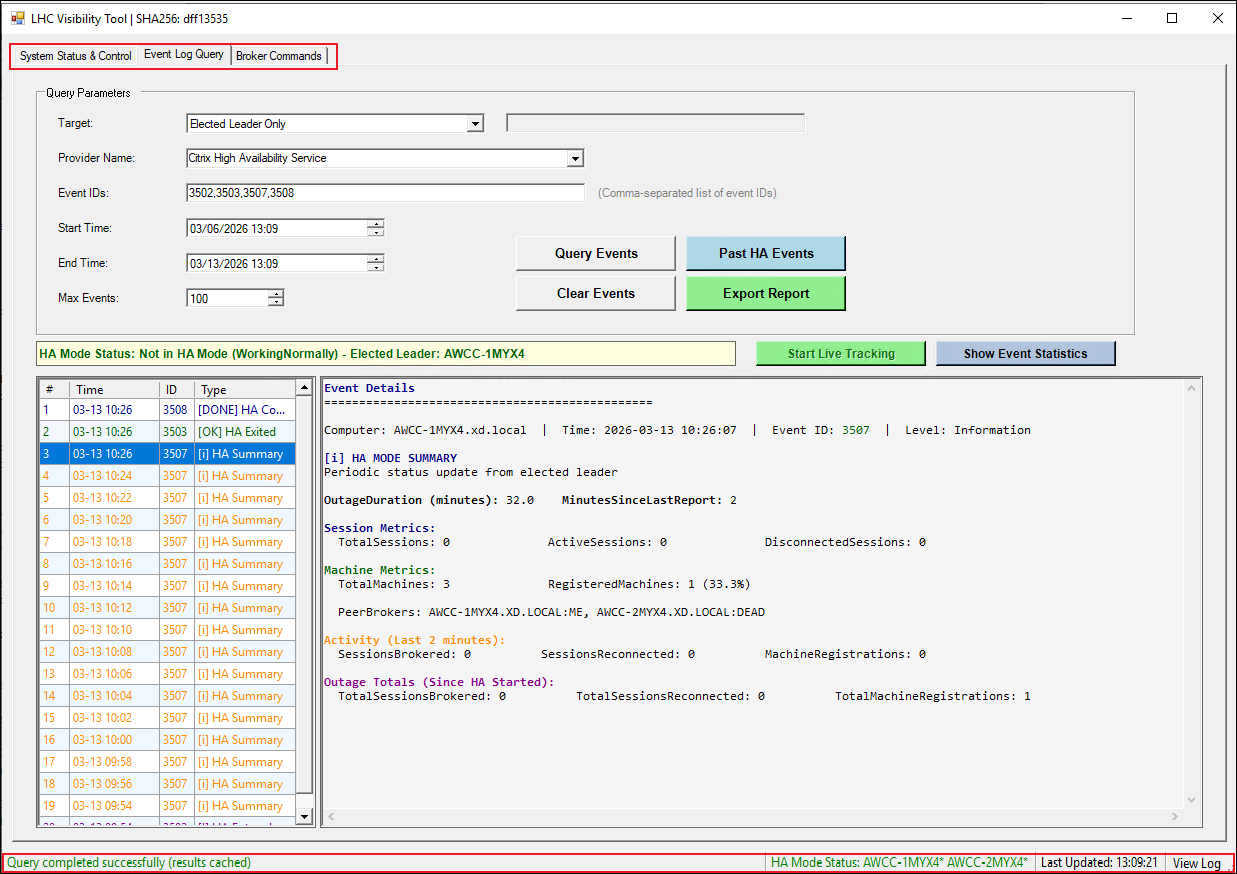
The status bar spans the bottom of the window and contains:
| Item | Description |
|---|---|
| Operation status (left) | Current operation, or "Ready" |
| HA Mode Status | Per-connector dot indicators (maximum 5 shown; "+N more" if truncated); the hover tooltip shows the full list |
| Last Updated | Timestamp of the last successful HA state refresh |
| View Log | Opens the session log file in Notepad |
The status bar uses the following colors to indicate the HA state:
| State | Color |
|---|---|
| WorkingNormally | Green |
| PendingHA | Goldenrod |
| PendingRecovery | Orange |
| InitialHA | Red |
| ExtendedHA | Red |
| Unknown / Unreachable | Gray |
Discover Cloud Connectors and identify the leader
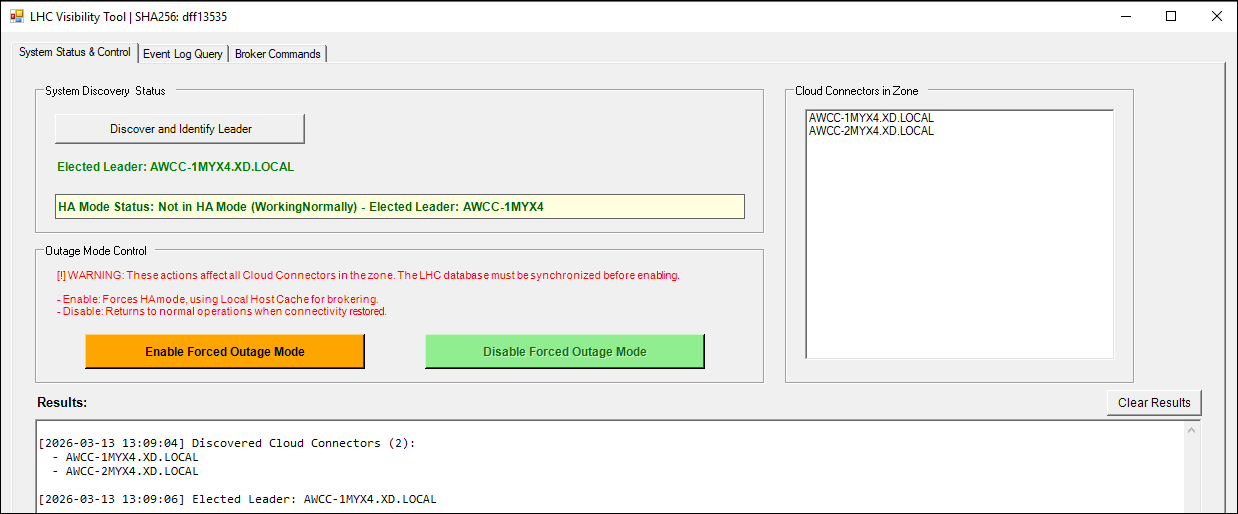
On the System Status & Control tab, click Discover and Identify Leader. The tool automatically detects and shows the elected leader among all Cloud Connectors in the zone using:
-
Event log analysis (Event ID 3504)
-
Registry PeerStatus and IsElected information
-
Local service verification
Control forced outage mode
On the System Status & Control tab, use the outage mode controls to manage HA mode across the zone:
-
Enable Forced Outage Mode:
-
Forces all Cloud Connectors in the zone to enter HA mode
-
Uses Local Host Cache for brokering
-
Requires the LHC database to be synchronized
-
-
Disable Forced Outage Mode:
-
Allows the system to return to normal operations
-
Reconnects to the primary site when available
-
Warning:
These actions affect all Cloud Connectors in the zone.
Query and track event logs
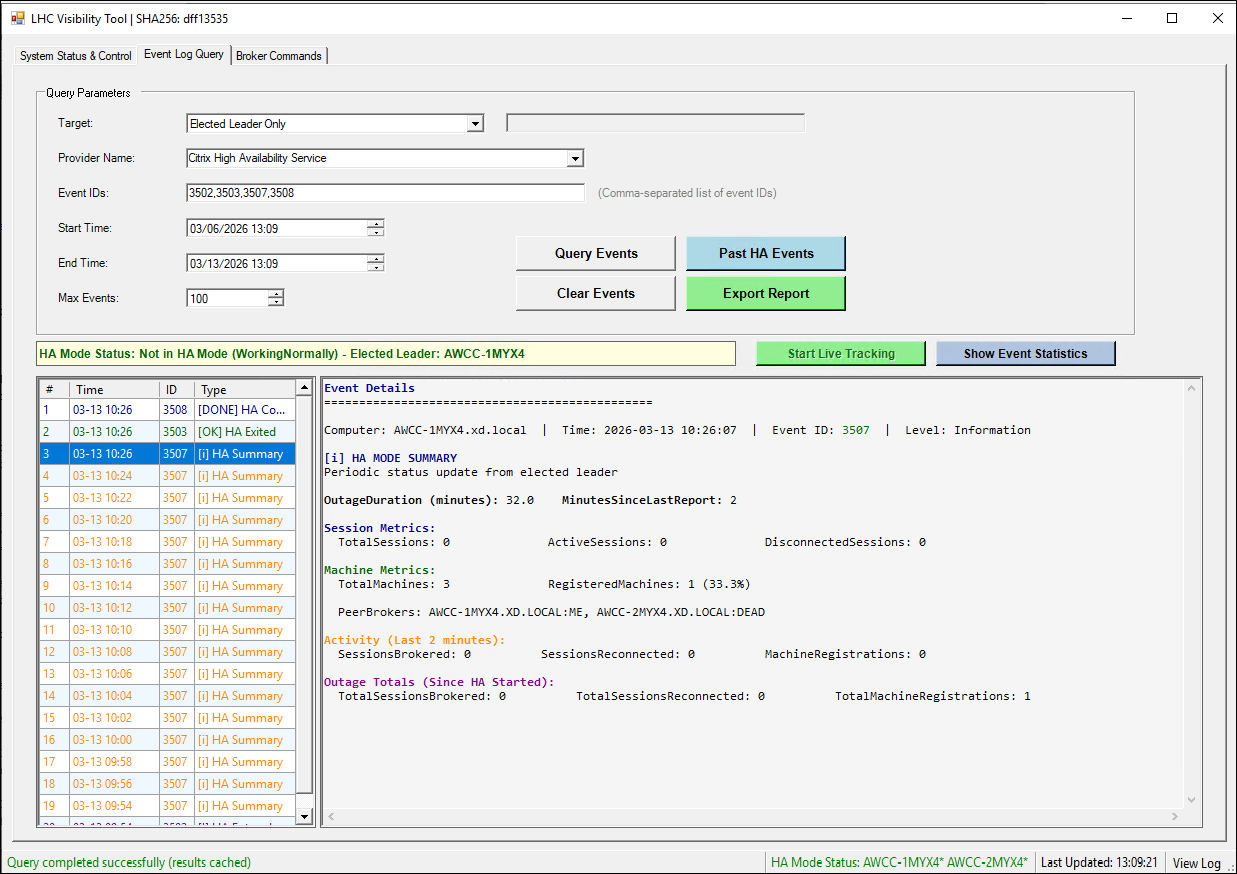
On the Event Log Query tab, configure the following query parameters:
-
Target: Choose from:
-
All Cloud Connectors
-
Elected Leader Only
-
Specific Computer (enter FQDN)
-
-
Provider Name: Select or enter a custom provider:
-
Citrix High Availability Service
-
Citrix ConfigSync Service
-
Citrix Broker Service
-
-
Event IDs: Comma-separated list (for example,
3502,3503,3506) -
Time Range: Optionally filter by start and end time
-
Max Events: Maximum number of events to retrieve per computer (default: 100)
Use the following buttons to work with events:
-
Query Events: Queries the event logs using the configured query parameters.
-
Past HA Events: Finds LHC begin and end boundaries (events 3502, 3503, 3508) from the configured query parameters and display the end summary event to give an overview.
-
Clear Events: Clears the event list, detail panel, and tracking state.
-
Export Report: Creates statistics from the queried events in the GUI and saves them as a text file. (Uses the output from the Show Event Statistics button.)
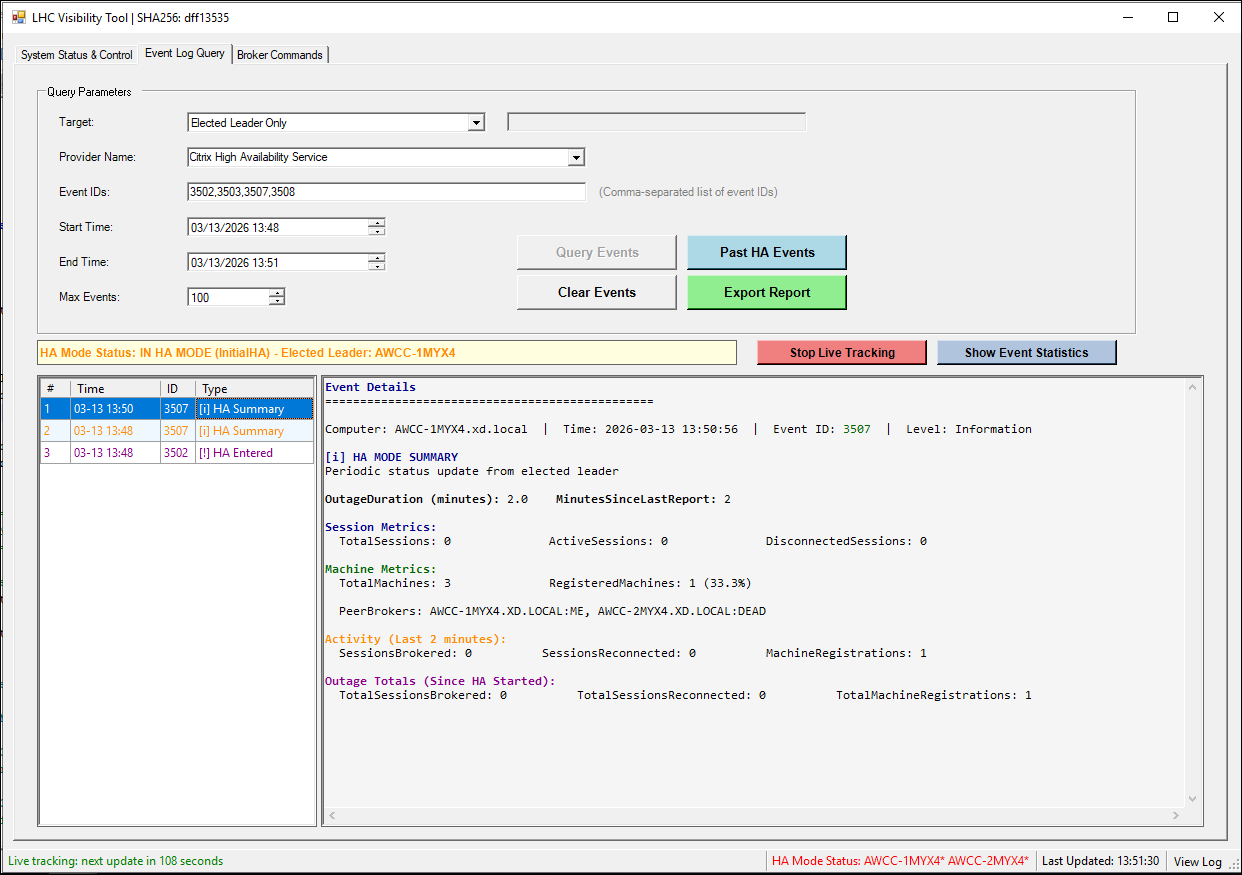
Live tracking behaves as follows:
-
Live tracking monitors for new summary events every 120 seconds while LHC is active.
-
When live tracking begins, it determines the start time for LHC mode by referencing event 3502 and lists all events that appeared since the start.
-
Live tracking can be stopped manually, or automatically when LHC mode concludes.
The lower section provides two main views:
-
Left panel:
-
Events are listed chronologically with key details (event number, time, ID, type).
-
Each event is visually distinguished by color based on its type, following the event ID reference.
-
Selecting an event displays further information about it.
-
-
Right panel: Two display options let you toggle between statistical summaries and detailed information for the selected event:
-
Show Event Details: Comprehensive details for the chosen event.
-
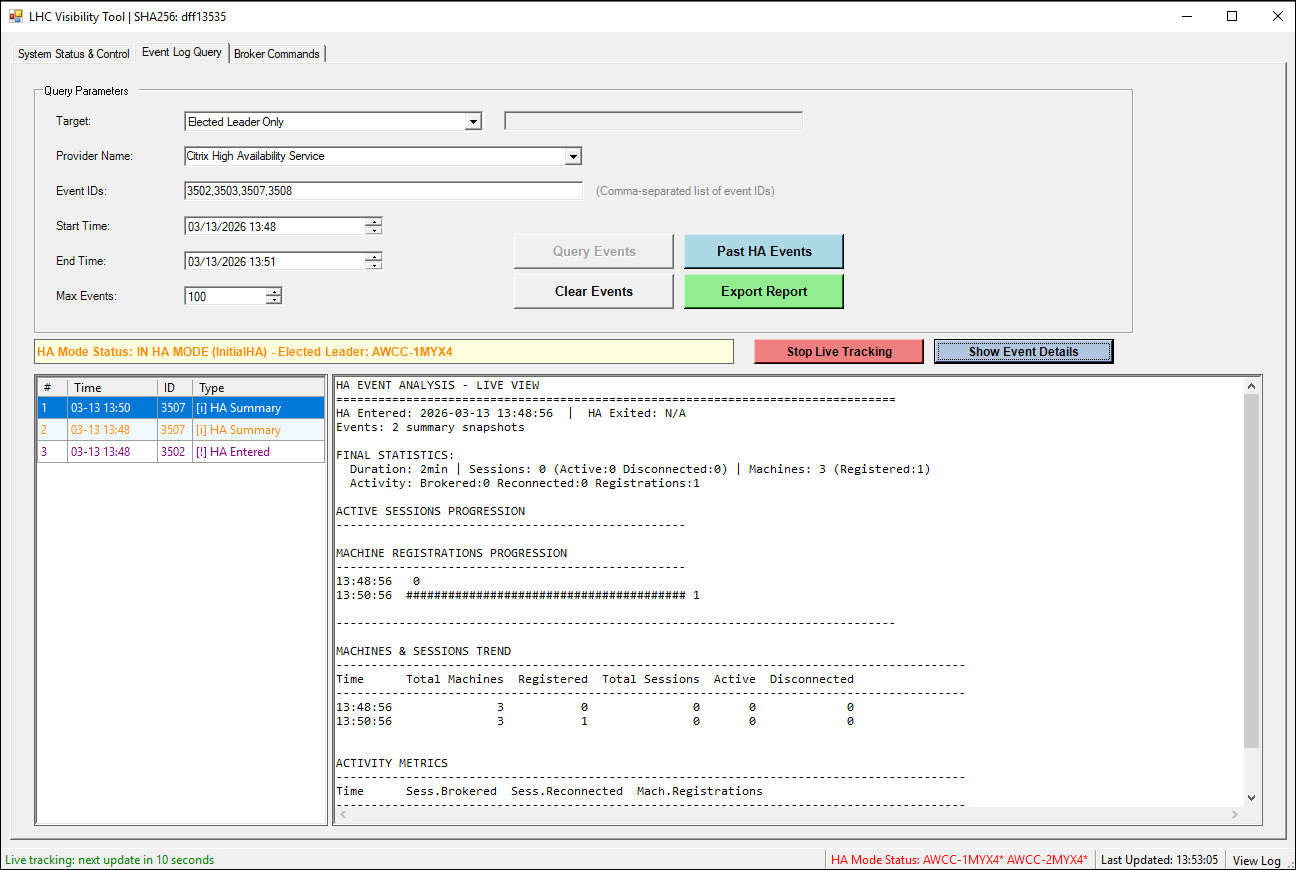
Show Event Statistics: Statistics summarizing HA mode events, including tabular metrics and ASCII bar charts from summary events (3507).
-
The following image shows the event details view:
The following image shows the event statistics view:
Reference: HA and ConfigSync event IDs
The following sections list common Event IDs by provider.
Citrix High Availability Service:
| Event ID | Description |
|---|---|
| 3502 | HA mode entered (elected broker) |
| 3503 | Out of HA mode (normal operations resumed) |
| 3506 | HA mode entered (non-elected broker) |
| 3507 | Periodic HA mode summary (elected broker) |
| 3508 | End of HA mode summary (elected broker) |
Citrix ConfigSync Service:
| Event ID | Description |
|---|---|
| 503 | Synchronization process started |
| 504 | Synchronization completed successfully |
| 505 | Synchronization failed |
| 507 | Sync abandoned due to HA mode |
| 510 | No configuration data received |
| 517 | Problem communicating with primary broker |
| 518 | ConfigSync aborted (HA Service not running) |
Run broker commands
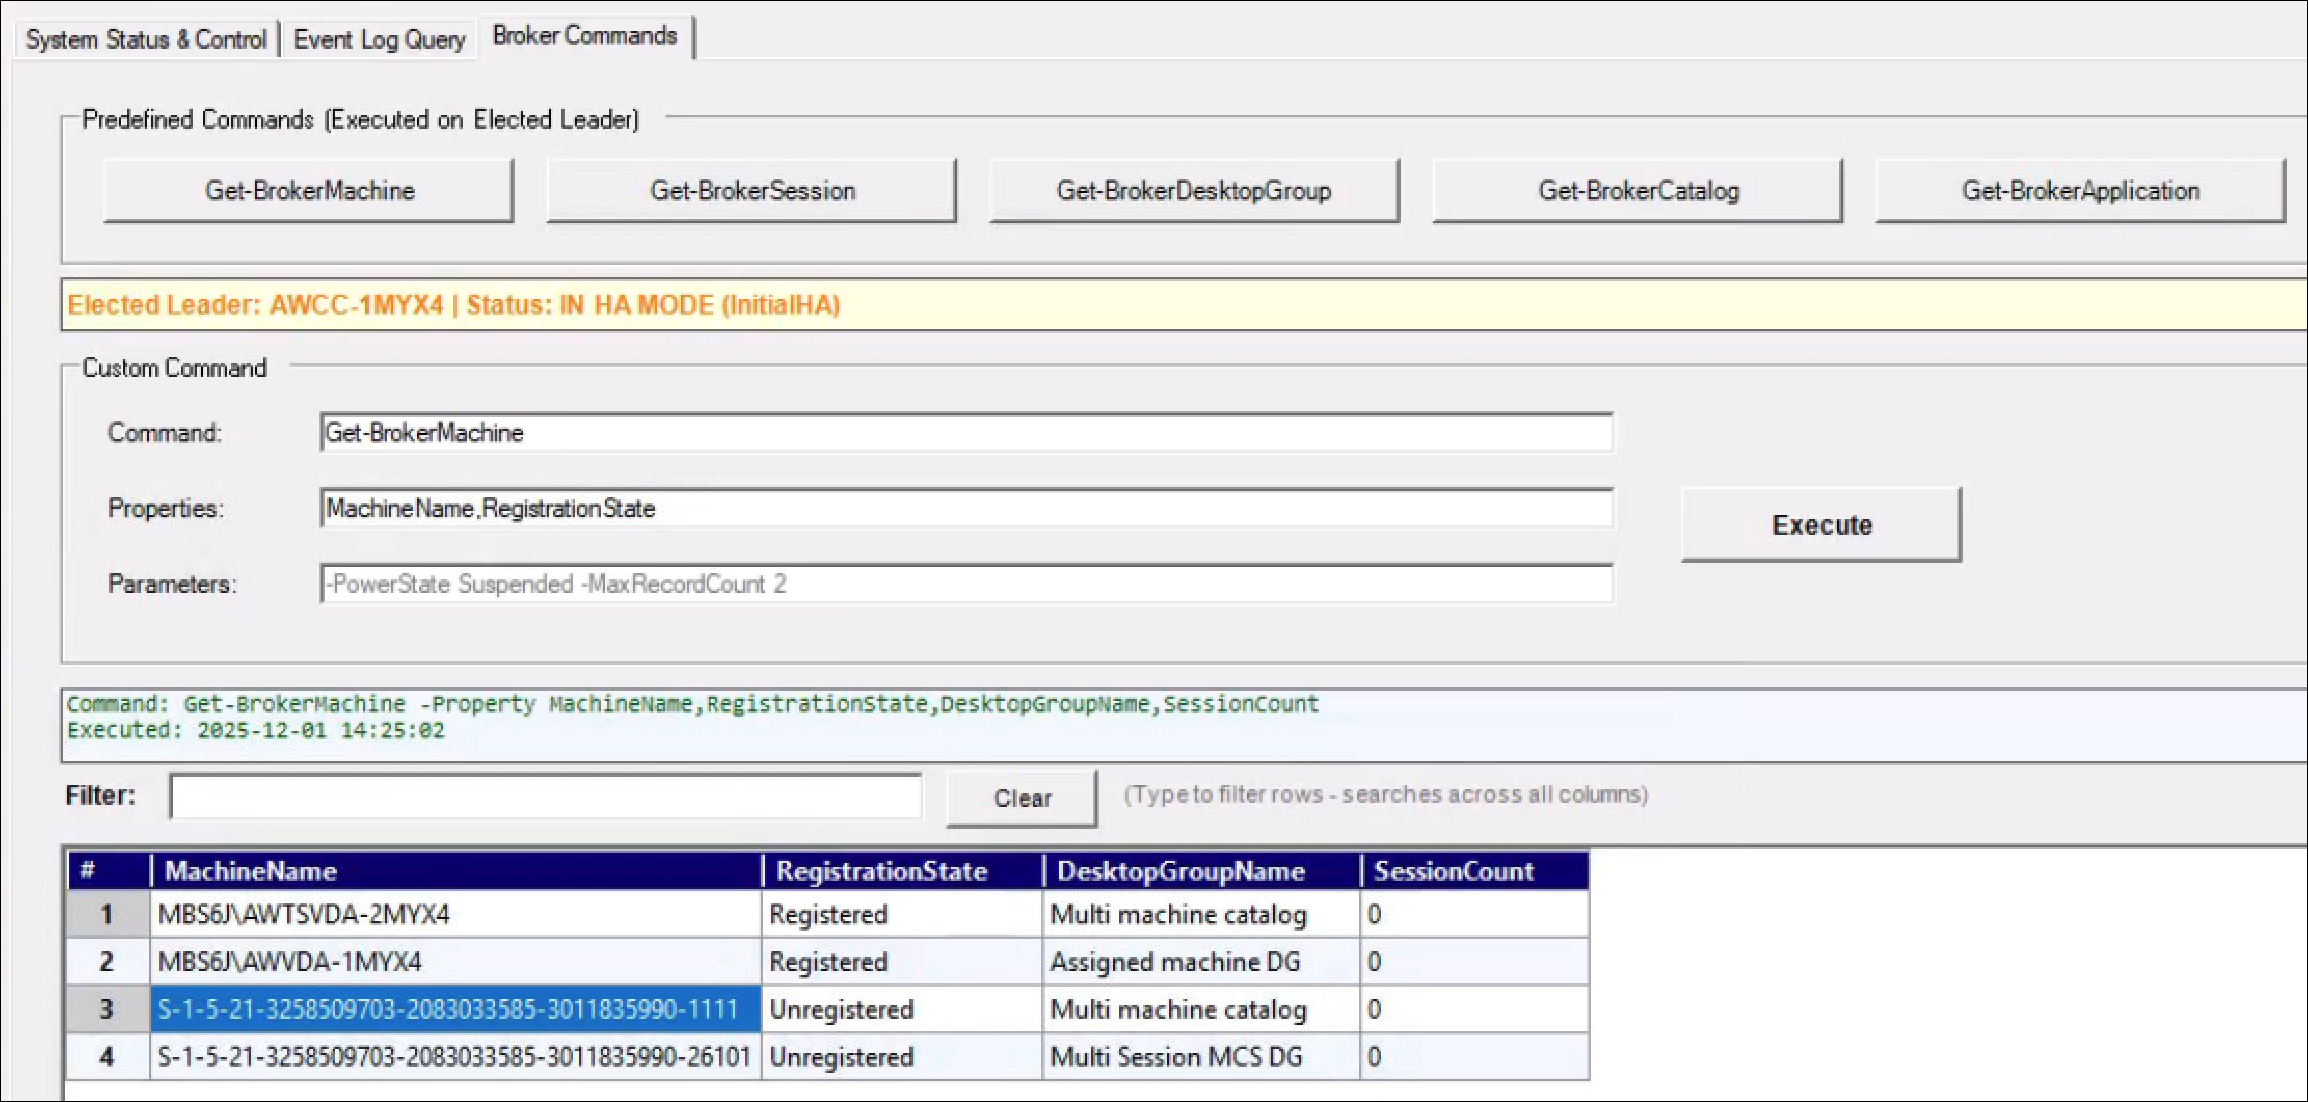
On the Broker Commands tab, the predefined commands are:
-
Get-BrokerMachine: Retrieve VDA/machine information
-
Get-BrokerSession: Retrieve active sessions
-
Get-BrokerDesktopGroup: Retrieve delivery groups
-
Get-BrokerCatalog: Retrieve machine catalogs
-
Get-BrokerApplication: Retrieve published applications
Tip:
Use the filter text box to search across all string columns simultaneously for a specific item in the results.
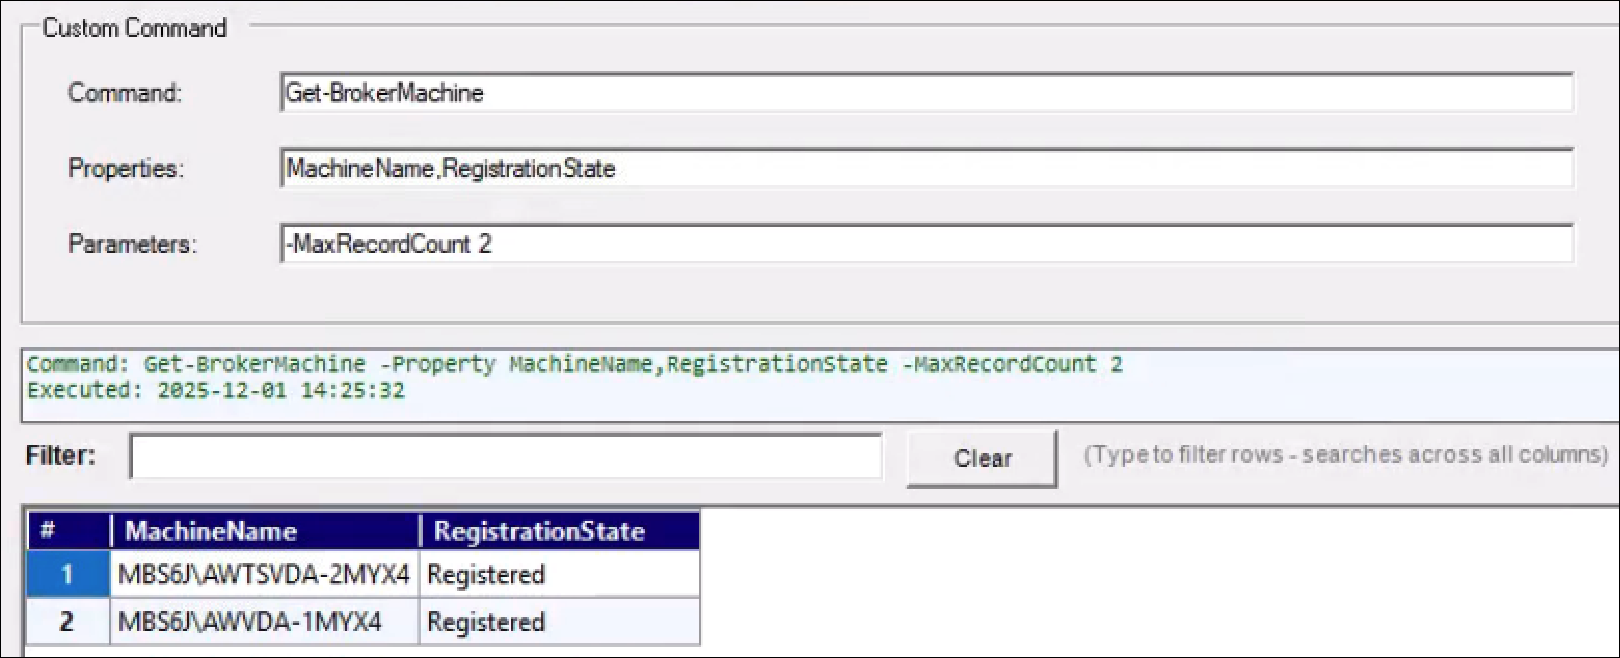
To run a custom command:
-
Enter a command, for example
Get-BrokerMachine -MaxRecordCount 2. -
Optionally specify the properties to return (comma-separated).
-
Click Execute.
Note:
Broker commands give recent information from the LHC database when:
-
The system is in LHC mode.
-
An elected leader has been identified.
-
The LHC database is available.
View session logs
To open the current session log, click View Log in the status bar. The log opens in Notepad.
Each session creates a log file at
%TEMP%\LHCVisibilityTool_<yyyyMMdd_HHmmss>.log. Messages are also written to the host console with color coding.
Use the tool via the command line
In addition to the GUI, you can run the tool directly from PowerShell. After you import the module, use the following commands to perform each task. Select a task to go to its command:
Launch the command-line tool
cd "C:\Program Files\Citrix\Broker\Service\LHCVisibilityToolScripts"
 . .\LHCVisibilityTool.ps1
Discover Cloud Connectors
$connectors = Get-CloudConnectorsInZone
 $connectors | ForEach-Object { Write-Host $_ }
Identify the elected leader
$leader = Get-ElectedLeader
 Write-Host "Elected Leader: $leader"
Get the outage state
$states = Get-OutageState
 foreach ($connector in $states.Keys) {
     Write-Host "$connector : $($states[$connector].State)"
 }
Query event logs
Query all Cloud Connectors for HA events:
$results = Get-LHCEventLogs -EventID @(3502, 3503, 3506) `
     -ProviderName "Citrix High Availability Service" `
     -StartTime (Get-Date).AddDays(-7) `
     -EndTime (Get-Date) `
     -MaxEvents 100

 # Display results
 foreach ($computer in $results.Keys) {
     Write-Host "`n=== $computer ==="
     if ($results[$computer].Success) {
         $results[$computer].Events | Format-Table TimeCreated, Id, Message -AutoSize
     } else {
         Write-Host "ERROR: $($results[$computer].Error)" -ForegroundColor Red
     }
 }
Query only the elected leader:
$results = Get-LHCEventLogs -ComputerName "ElectedLeader" `
     -EventID @(3507) `
     -ProviderName "Citrix High Availability Service" `
     -MaxEvents 50
Query a specific computer:
$results = Get-LHCEventLogs -ComputerName "CC-01.domain.com" `
     -EventID @(503, 504, 505) `
     -ProviderName "Citrix ConfigSync Service"
Run broker commands
Get all machines:
$machines = Invoke-BrokerCommand -Command "Get-BrokerMachine" `
     -Properties @("MachineName", "RegistrationState", "SessionCount")
 $machines | Format-Table -AutoSize
Get active sessions:
$sessions = Invoke-BrokerCommand -Command "Get-BrokerSession" `
     -Properties @("UserName", "MachineName", "SessionState")
 $sessions | Format-Table -AutoSize
Run a custom command with parameters:
$params = @{
     MaxRecordCount = 10
 }
 $results = Invoke-BrokerCommand -Command "Get-BrokerMachine" `
     -Parameters $params `
     -Properties @("MachineName", "DesktopGroupName")
Control outage mode
Enable forced outage mode on all Cloud Connectors:
$results = Set-LHCOutageMode -Enable

 # Check results
 foreach ($connector in $results.Keys) {
     $status = if ($results[$connector].Success) { "SUCCESS" } else { "FAILED" }
     Write-Host "$connector : $status"
     if (-not $results[$connector].Success) {
         Write-Host "  Error: $($results[$connector].Error)" -ForegroundColor Red
     }
 }
Disable forced outage mode:
$results = Set-LHCOutageMode

 # Check results
 foreach ($connector in $results.Keys) {
     $status = if ($results[$connector].Success) { "SUCCESS" } else { "FAILED" }
     Write-Host "$connector : $status"
 }
Troubleshooting
To troubleshoot issues with the tool, follow this general process:
-
Check the Application event log for detailed error messages.
-
Verify that all prerequisites are met.
-
Review the common issues in the following table and the best practices described later in this article.
-
Refer to Local Host Cache and the Avoid Common Misconfigurations that Can Negatively Impact DaaS Resiliency technical brief.
The following table lists common issues that you might encounter when using the tool and their recommended solutions.
| Issue | Solution |
|---|---|
| No Cloud Connectors found |
|
| Cannot identify elected leader |
|
| Broker command failed |
|
| Remote execution errors |
|
| Event log query returns no results |
|
Best practices
Follow these best practices to get the most out of the tool and to operate your Local Host Cache environment safely.
Regular monitoring
-
Run Discover Cloud Connectors and Identify Elected Leader periodically.
-
Monitor
ConfigSyncevents (503, 504, 505) for synchronization issues.
Event log analysis
-
Query the last 7 days of HA events to understand outage patterns.
-
Look for Event ID 3507 during HA mode for detailed statistics.
Broker commands
-
Only run on the elected leader.
-
Limit property selection to improve performance.
-
Use the
MaxRecordCountparameter for large environments.
Outage mode
-
Only use forced outage mode for testing or planned maintenance.
-
Always verify that the LHC database is synchronized before enabling.
-
Disable forced outage mode once primary connectivity is restored.
Security
-
Run with tleast-privilege accounts where possible.
-
Use secure channels for remote execution.
-
Audit outage mode changes.
Examples
The following examples assume that you have created a folder at
C:\Reports to hold the output.
Example 1: Daily HA mode report
# Import module
 . "C:\Program Files\Citrix\Broker\Service\LHCVisibilityToolScripts\LHCVisibilityTool.ps1"

 # Discover environment
 $connectors = Get-CloudConnectorsInZone
 Write-Host "Found $($connectors.Count) Cloud Connectors"

 # Check HA status
 $leader = Get-ElectedLeader
 if ($leader) {
     Write-Host "System is in HA mode. Elected leader: $leader"

     # Get HA summary events from elected leader
     $events = Get-LHCEventLogs -ComputerName "ElectedLeader" `
         -EventID @(3507, 3508) `
         -ProviderName "Citrix High Availability Service" `
         -StartTime (Get-Date).AddHours(-24) `
         -MaxEvents 100

     # Export to file
     $events[$leader].Events | Select-Object TimeCreated, Id, LevelDisplayName, Message | Export-Csv -Path "C:\Reports\HA-Status-$(Get-Date -Format 'yyyyMMdd').csv" -NoTypeInformation
 } else {
     Write-Host "System is in normal operations mode"
 }
Example 2: Check ConfigSync status on all connectors
. "C:\Program Files\Citrix\Broker\Service\LHCVisibilityToolScripts\LHCVisibilityTool.ps1"

 $results = Get-LHCEventLogs -ComputerName "All" `
     -EventID @(503, 504, 505) `
     -ProviderName "Citrix ConfigSync Service" `
     -StartTime (Get-Date).AddHours(-6) `
     -MaxEvents 10

 foreach ($computer in $results.Keys) {
     $lastEvent = $results[$computer].Events | Sort-Object TimeCreated -Descending | Select-Object -First 1
     $status = switch ($lastEvent.Id) {
         503 { "In Progress" }
         504 { "Success" }
         505 { "Failed" }
     }
     Write-Host "$computer - Last Sync: $($lastEvent.TimeCreated) - Status: $status"
 }
Example 3: Get session count during HA mode
. "C:\Program Files\Citrix\Broker\Service\LHCVisibilityToolScripts\LHCVisibilityTool.ps1"

 # Ensure we have an elected leader
 $leader = Get-ElectedLeader
 if ($leader) {
     # Get all sessions
     $sessions = Invoke-BrokerCommand -Command "Get-BrokerSession"
     Write-Host "Total Sessions: $($sessions.Count)"

     # Group by state
     $sessionsByState = $sessions | Group-Object SessionState
     foreach ($group in $sessionsByState) {
         Write-Host "  $($group.Name): $($group.Count)"
     }
 } else {
     Write-Host "Not in HA mode - cannot query sessions from LHC"
 }
Advanced scenarios
The following scenarios combine multiple tool functions into scripts for more complex operations, such as automating outage testing and exporting historical HA mode data.
Automate outage testing
# Enable outage mode
 Write-Host "Enabling forced outage mode..."
 $enableResults = Set-LHCOutageMode -Enable
 $allEnabled = $enableResults.Values | Where-Object { -not $_.Success }
 if ($allEnabled) {
     Write-Host "WARNING: Some connectors failed to enable outage mode - aborting test" -ForegroundColor Yellow
     return
 }
 Start-Sleep -Seconds 30

 # Verify elected leader
 $leader = Get-ElectedLeader
 Write-Host "Elected leader: $leader"

 # Test brokering
 $machines = Invoke-BrokerCommand -Command "Get-BrokerMachine" -Properties @("MachineName", "RegistrationState")
 Write-Host "Retrieved $($machines.Count) machines"

 # Disable outage mode
 Write-Host "Disabling forced outage mode..."
 $disableResults = Set-LHCOutageMode
Export HA mode history
$haEvents = Get-LHCEventLogs -ComputerName "All" `
     -EventID @(3502, 3503) `
     -ProviderName "Citrix High Availability Service" `
     -StartTime (Get-Date).AddDays(-30) `
     -MaxEvents 1000

 $report = foreach ($computer in $haEvents.Keys) {
     if (-not $haEvents[$computer].Success) { continue }
     foreach ($event in $haEvents[$computer].Events) {
         [PSCustomObject]@{
             Computer  = $computer
             EventID   = $event.Id
             EventType = if ($event.Id -eq 3502) { "Entered HA Mode" } else { "Exited HA Mode" }
             Time      = $event.TimeCreated
         }
     }
 }
 $report | Sort-Object Time | Export-Csv -Path "C:\Reports\HA-History.csv" -NoTypeInformation