Dashboard overview
The dashboard provides admins full visibility into their apps, users, and access policies in a single place for consumption. This data is fetched from Citrix Analytics. The data for the various entities can be viewed for the preset time or for a custom timeline. For some of the entities, you can drill down to view further details. The data in the dashboard is broadly classified into the following categories.
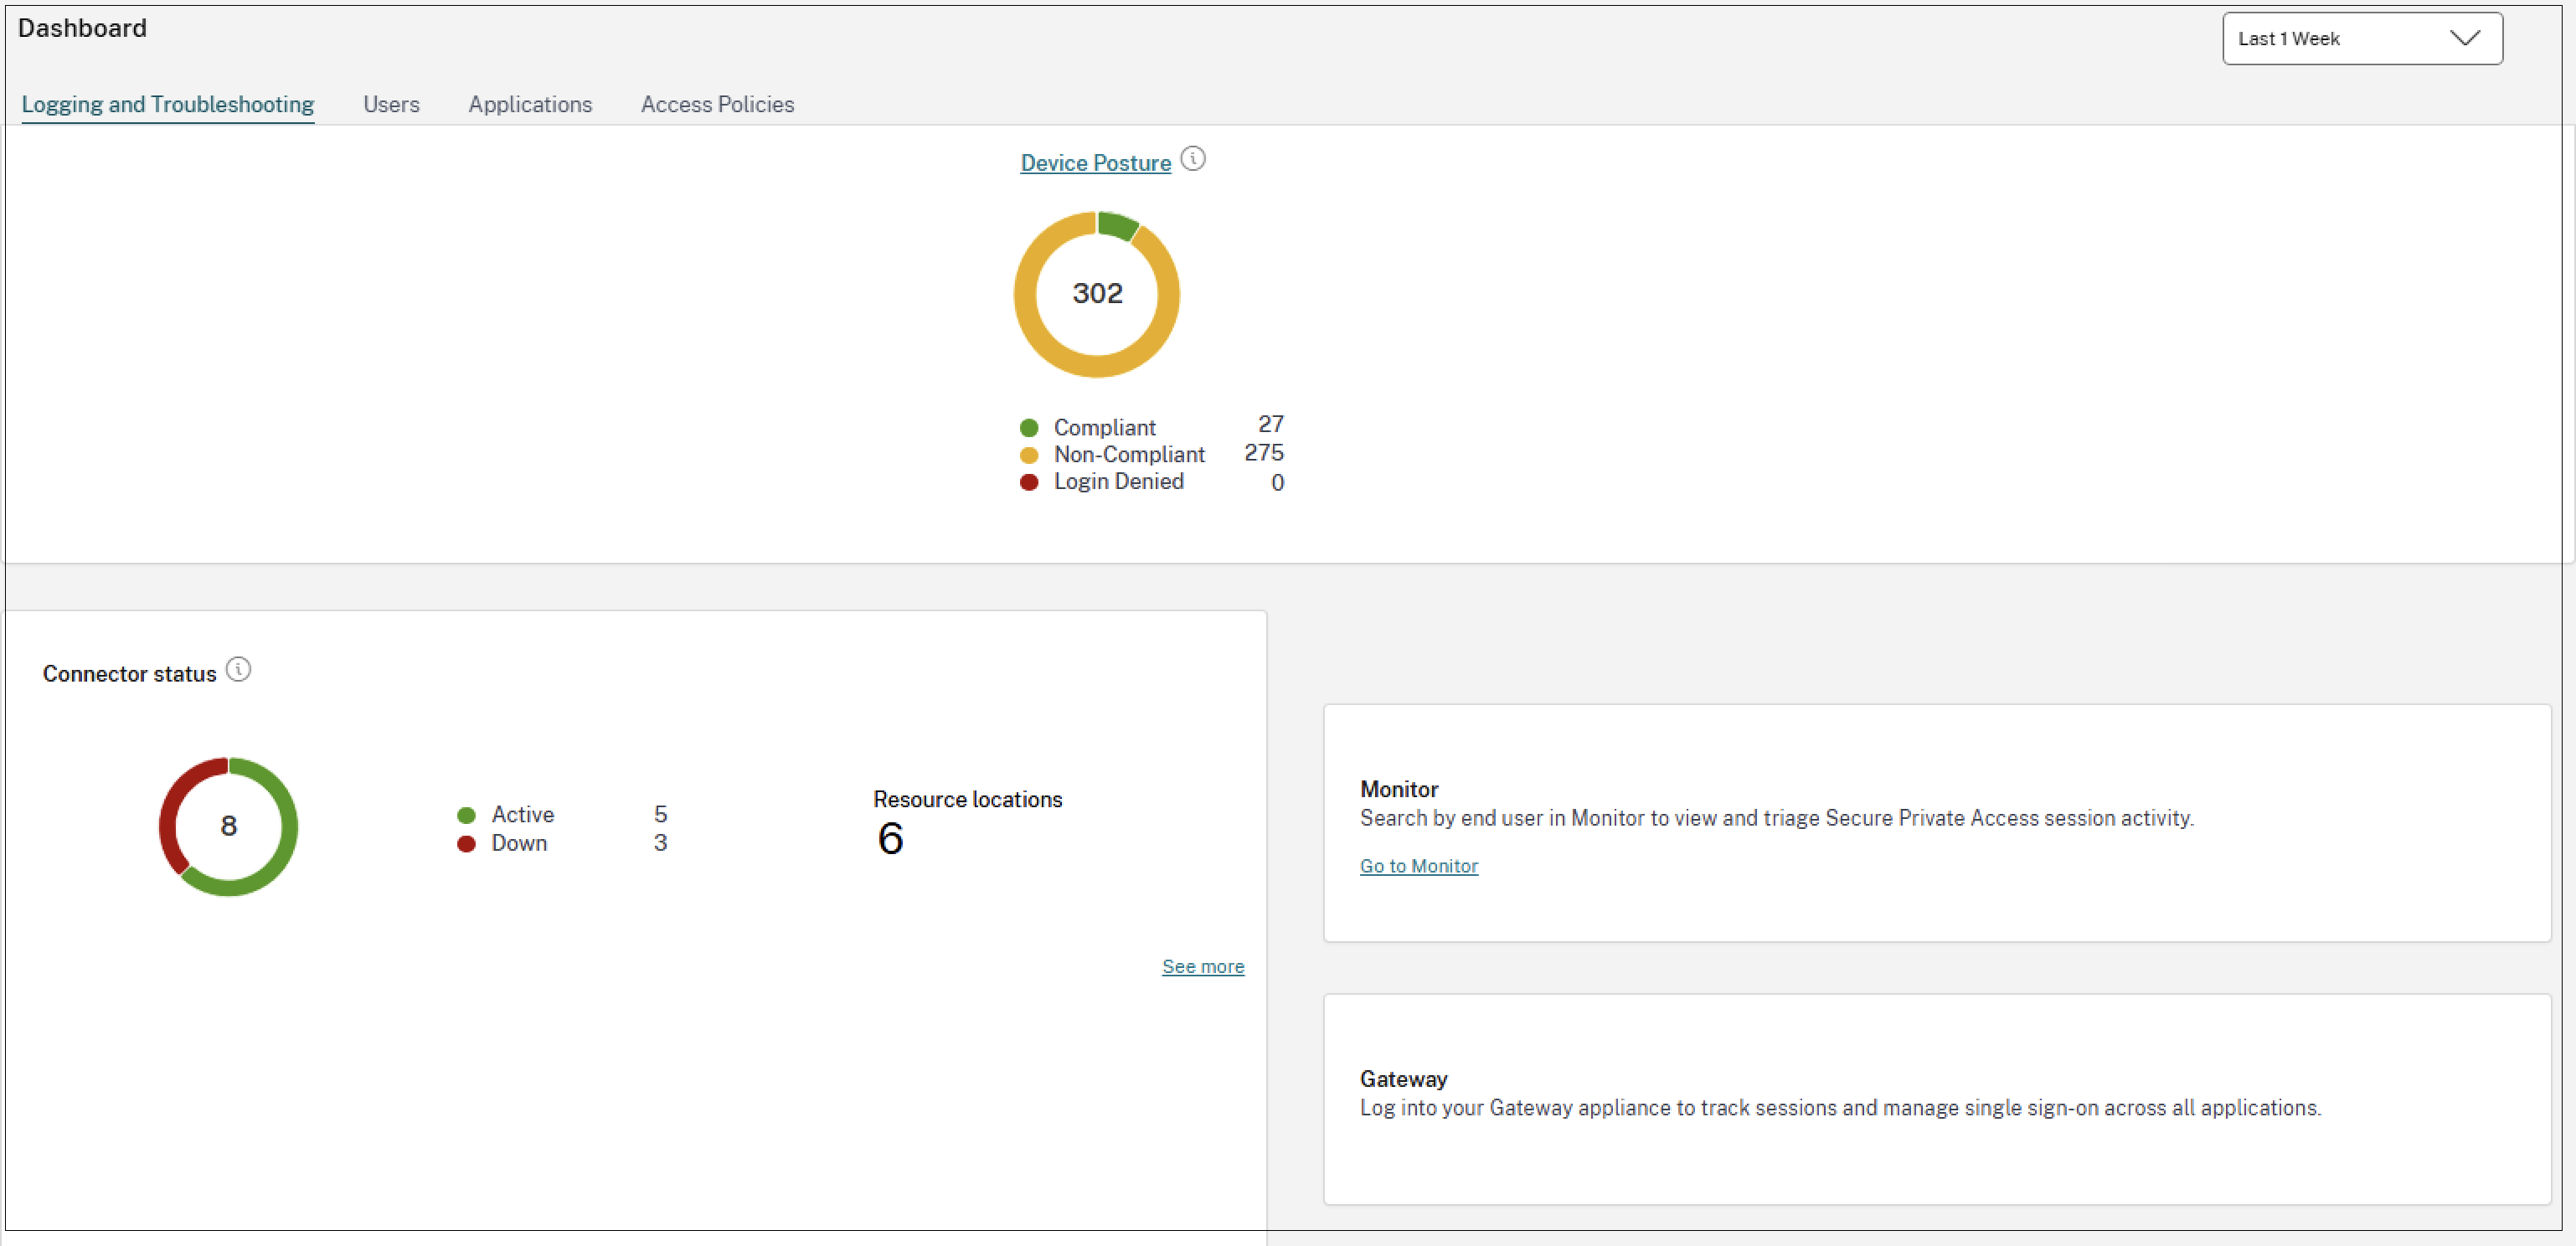
Logging and Troubleshooting
- Device Posture: Logs related to device posture that help administrators assess endpoint compliance. The device posture logs are categorized as Compliant, Non-Compliant, and Login Denied. For details on device posture logs, see Device posture logs and events.
Connector status: Status of the Connector and the resource locations where the connectors are deployed. Click the See more link to view the details. In the Connector insights page, you can use the filters Active or Inactive to filter the connectors based on their status.
Monitor: Secure Private Access is integrated with Monitor, which is the monitoring and troubleshooting console for Citrix DaaS. Administrators and help-desk personnel can monitor and troubleshoot Web/SaaS and TCP/UDP app sessions and events from the DaaS Monitor. For details about the integration and for viewing user sessions, see Integration with DaaS Monitor.
Gateway: Admins can also log in to the NetScaler® Gateway to track sessions and manage single sign-on across all applications from the dashboard.
Users
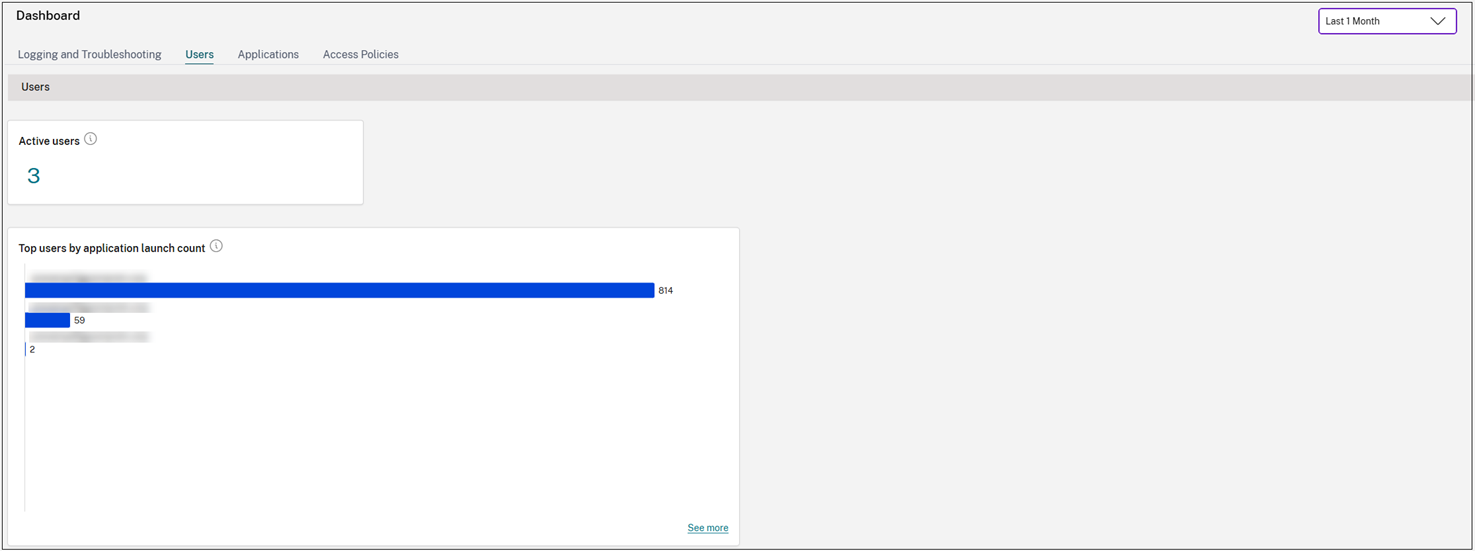
Active users: Total number of unique users accessing the applications (SaaS/Web and TCP/UDP) for the selected time interval. Click the number to view the detailed information about the users.
Top users by applications launch count: Data per user. For example, the number of times a user has launched the app. You can filter the data for a pre-set timeline or for a custom timeline.
Applications
-
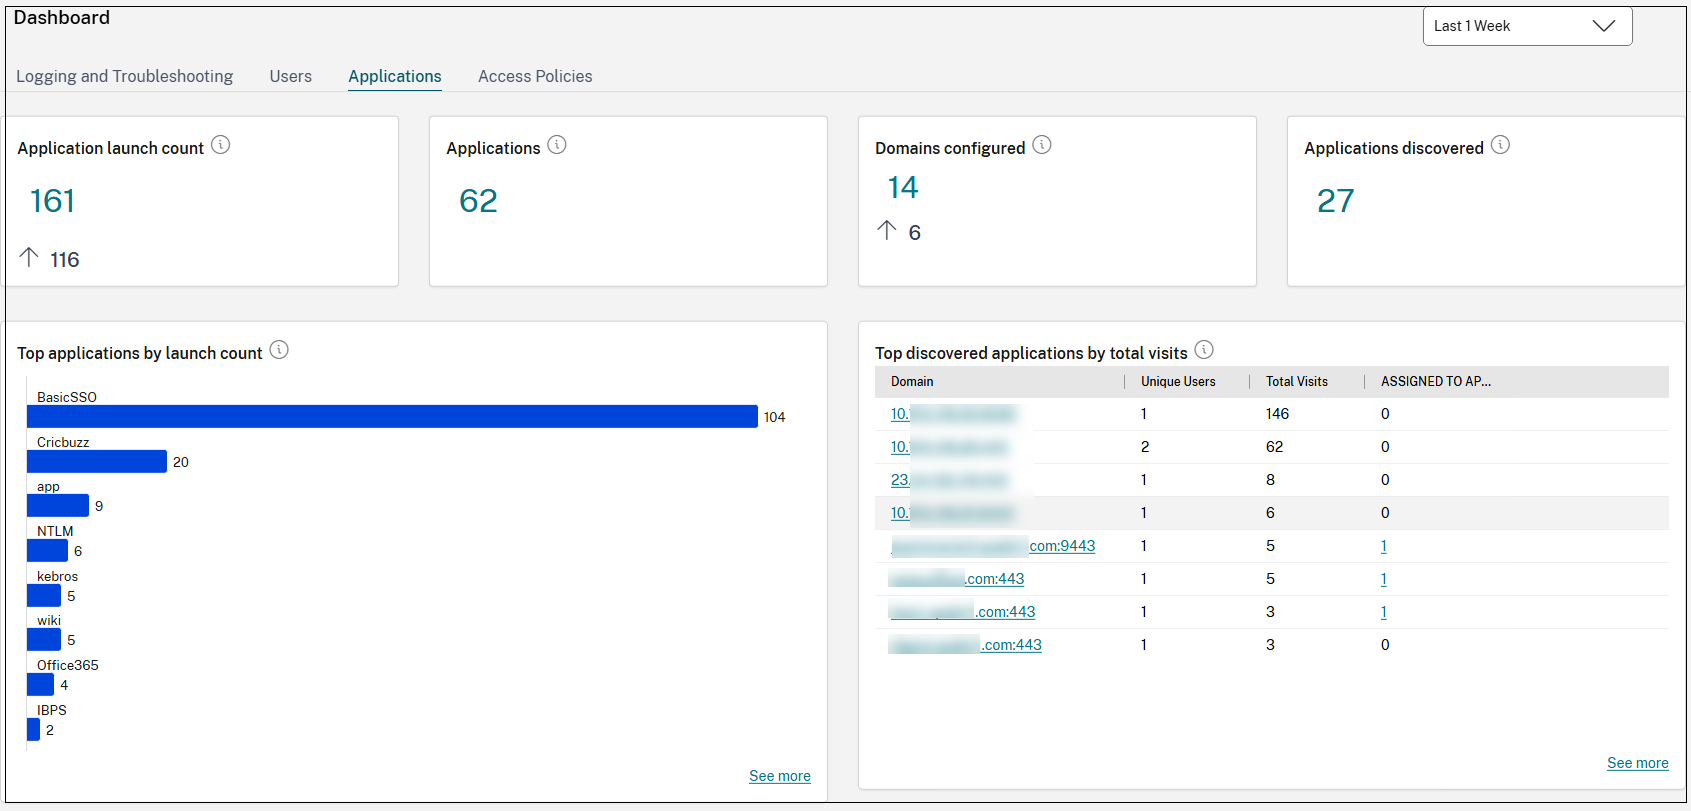
Application launch count: Total number of applications (app sessions) launched by each user for the selected time interval. Click the number to view the detailed information about the applications launch count.
-
Applications: Total number of applications (independent of the time interval) configured currently.
Domains configured: Total number of domains configured for the selected time interval.
-
Applications discovered: Total number of unique, individual domains that have been accessed but are not associated with any apps. Click the number to view the detailed information about the applications discovered. For information on applications discovery, see Discover domains or IP addresses accessed by end users.
-
Top applications by launch count: List of top applications based on the number of the times the app was launched. You can apply the filters SaaS Apps, Web Apps, or TCP/UDP Apps to narrow down your search to specific apps. You can filter the data for a pre-set timeline or for a custom timeline. Click the See more link to view the details.
-
Top discovered applications by total visits: List of individual domains that have been accessed at some point but are not associated with any apps. These domains are listed based on the number of total visits to those domains. Admins can use this chart to see if any domain of particular interest is accessed by many users. In such cases, admins can create an app with that domain for easy accessibility. Click the See more link to view the list of domains visited by end-users. For more information about application discovery, see Discover domains or IP addresses accessed by end users.
Access policies
-
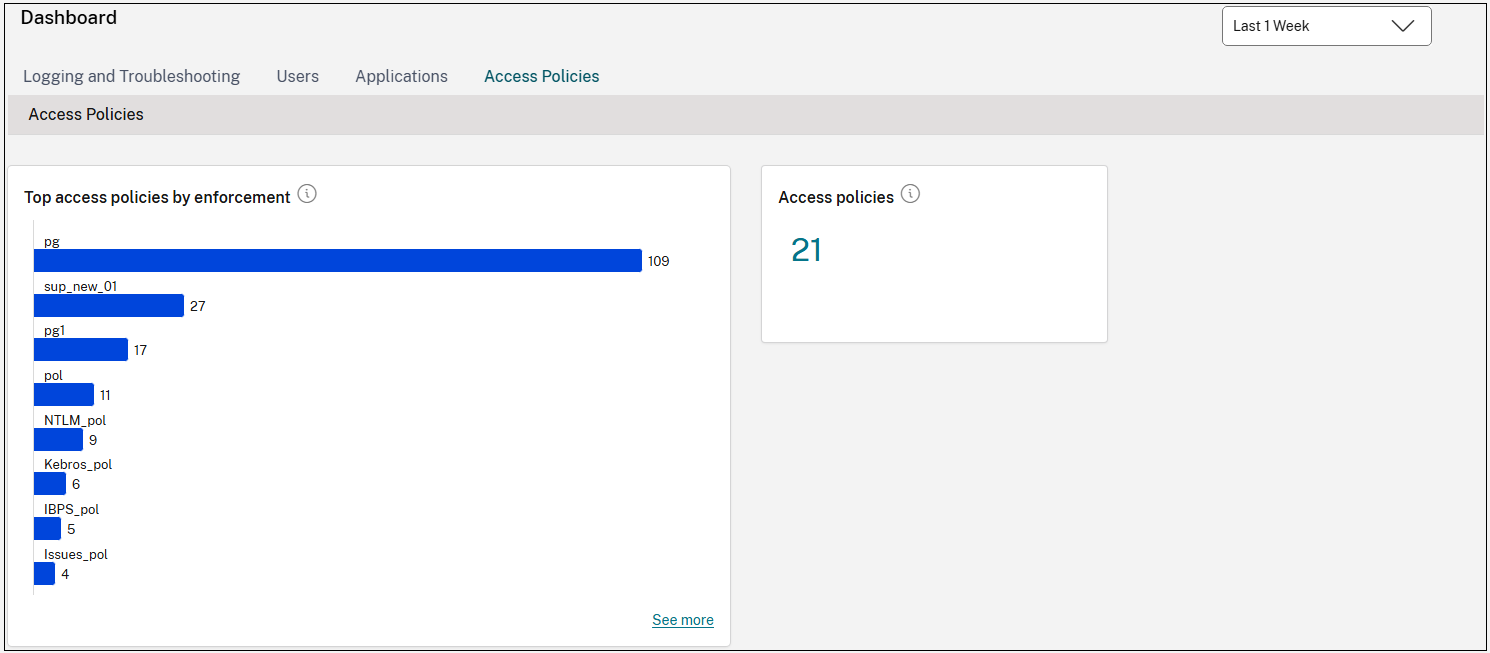
Access policies: Total number of access policies (independent of the time interval) configured currently.
-
Top access policies by enforcement: List of access policies that are enforced on the apps. Click the See more link to view the list of policies that are associated with the apps and the number of times the policies are enforced. You can also use the Search option in the Access policies page to filter the policies based on the policy name. You can also search for specific policies using the search operators to further refine your search. For details, see Search operators.
Search operators
The following are the search operators that you can use to refine your search:
- = (equals to some value): To search for the logs or policies that exactly match the search criteria.
- != (not equal some value): To search for the logs or policies that do not contain the specified criteria.
- ~ (contains some value): To search for the logs or policies that match the search criteria partially.
- !~ (does not contain some value): To search for the logs or policies that do not contain some of the specified criteria.