This content has been machine translated dynamically.
Dieser Inhalt ist eine maschinelle Übersetzung, die dynamisch erstellt wurde. (Haftungsausschluss)
Cet article a été traduit automatiquement de manière dynamique. (Clause de non responsabilité)
Este artículo lo ha traducido una máquina de forma dinámica. (Aviso legal)
此内容已经过机器动态翻译。 放弃
このコンテンツは動的に機械翻訳されています。免責事項
이 콘텐츠는 동적으로 기계 번역되었습니다. 책임 부인
Este texto foi traduzido automaticamente. (Aviso legal)
Questo contenuto è stato tradotto dinamicamente con traduzione automatica.(Esclusione di responsabilità))
This article has been machine translated.
Dieser Artikel wurde maschinell übersetzt. (Haftungsausschluss)
Ce article a été traduit automatiquement. (Clause de non responsabilité)
Este artículo ha sido traducido automáticamente. (Aviso legal)
この記事は機械翻訳されています.免責事項
이 기사는 기계 번역되었습니다.책임 부인
Este artigo foi traduzido automaticamente.(Aviso legal)
这篇文章已经过机器翻译.放弃
Questo articolo è stato tradotto automaticamente.(Esclusione di responsabilità))
Translation failed!
Monitor
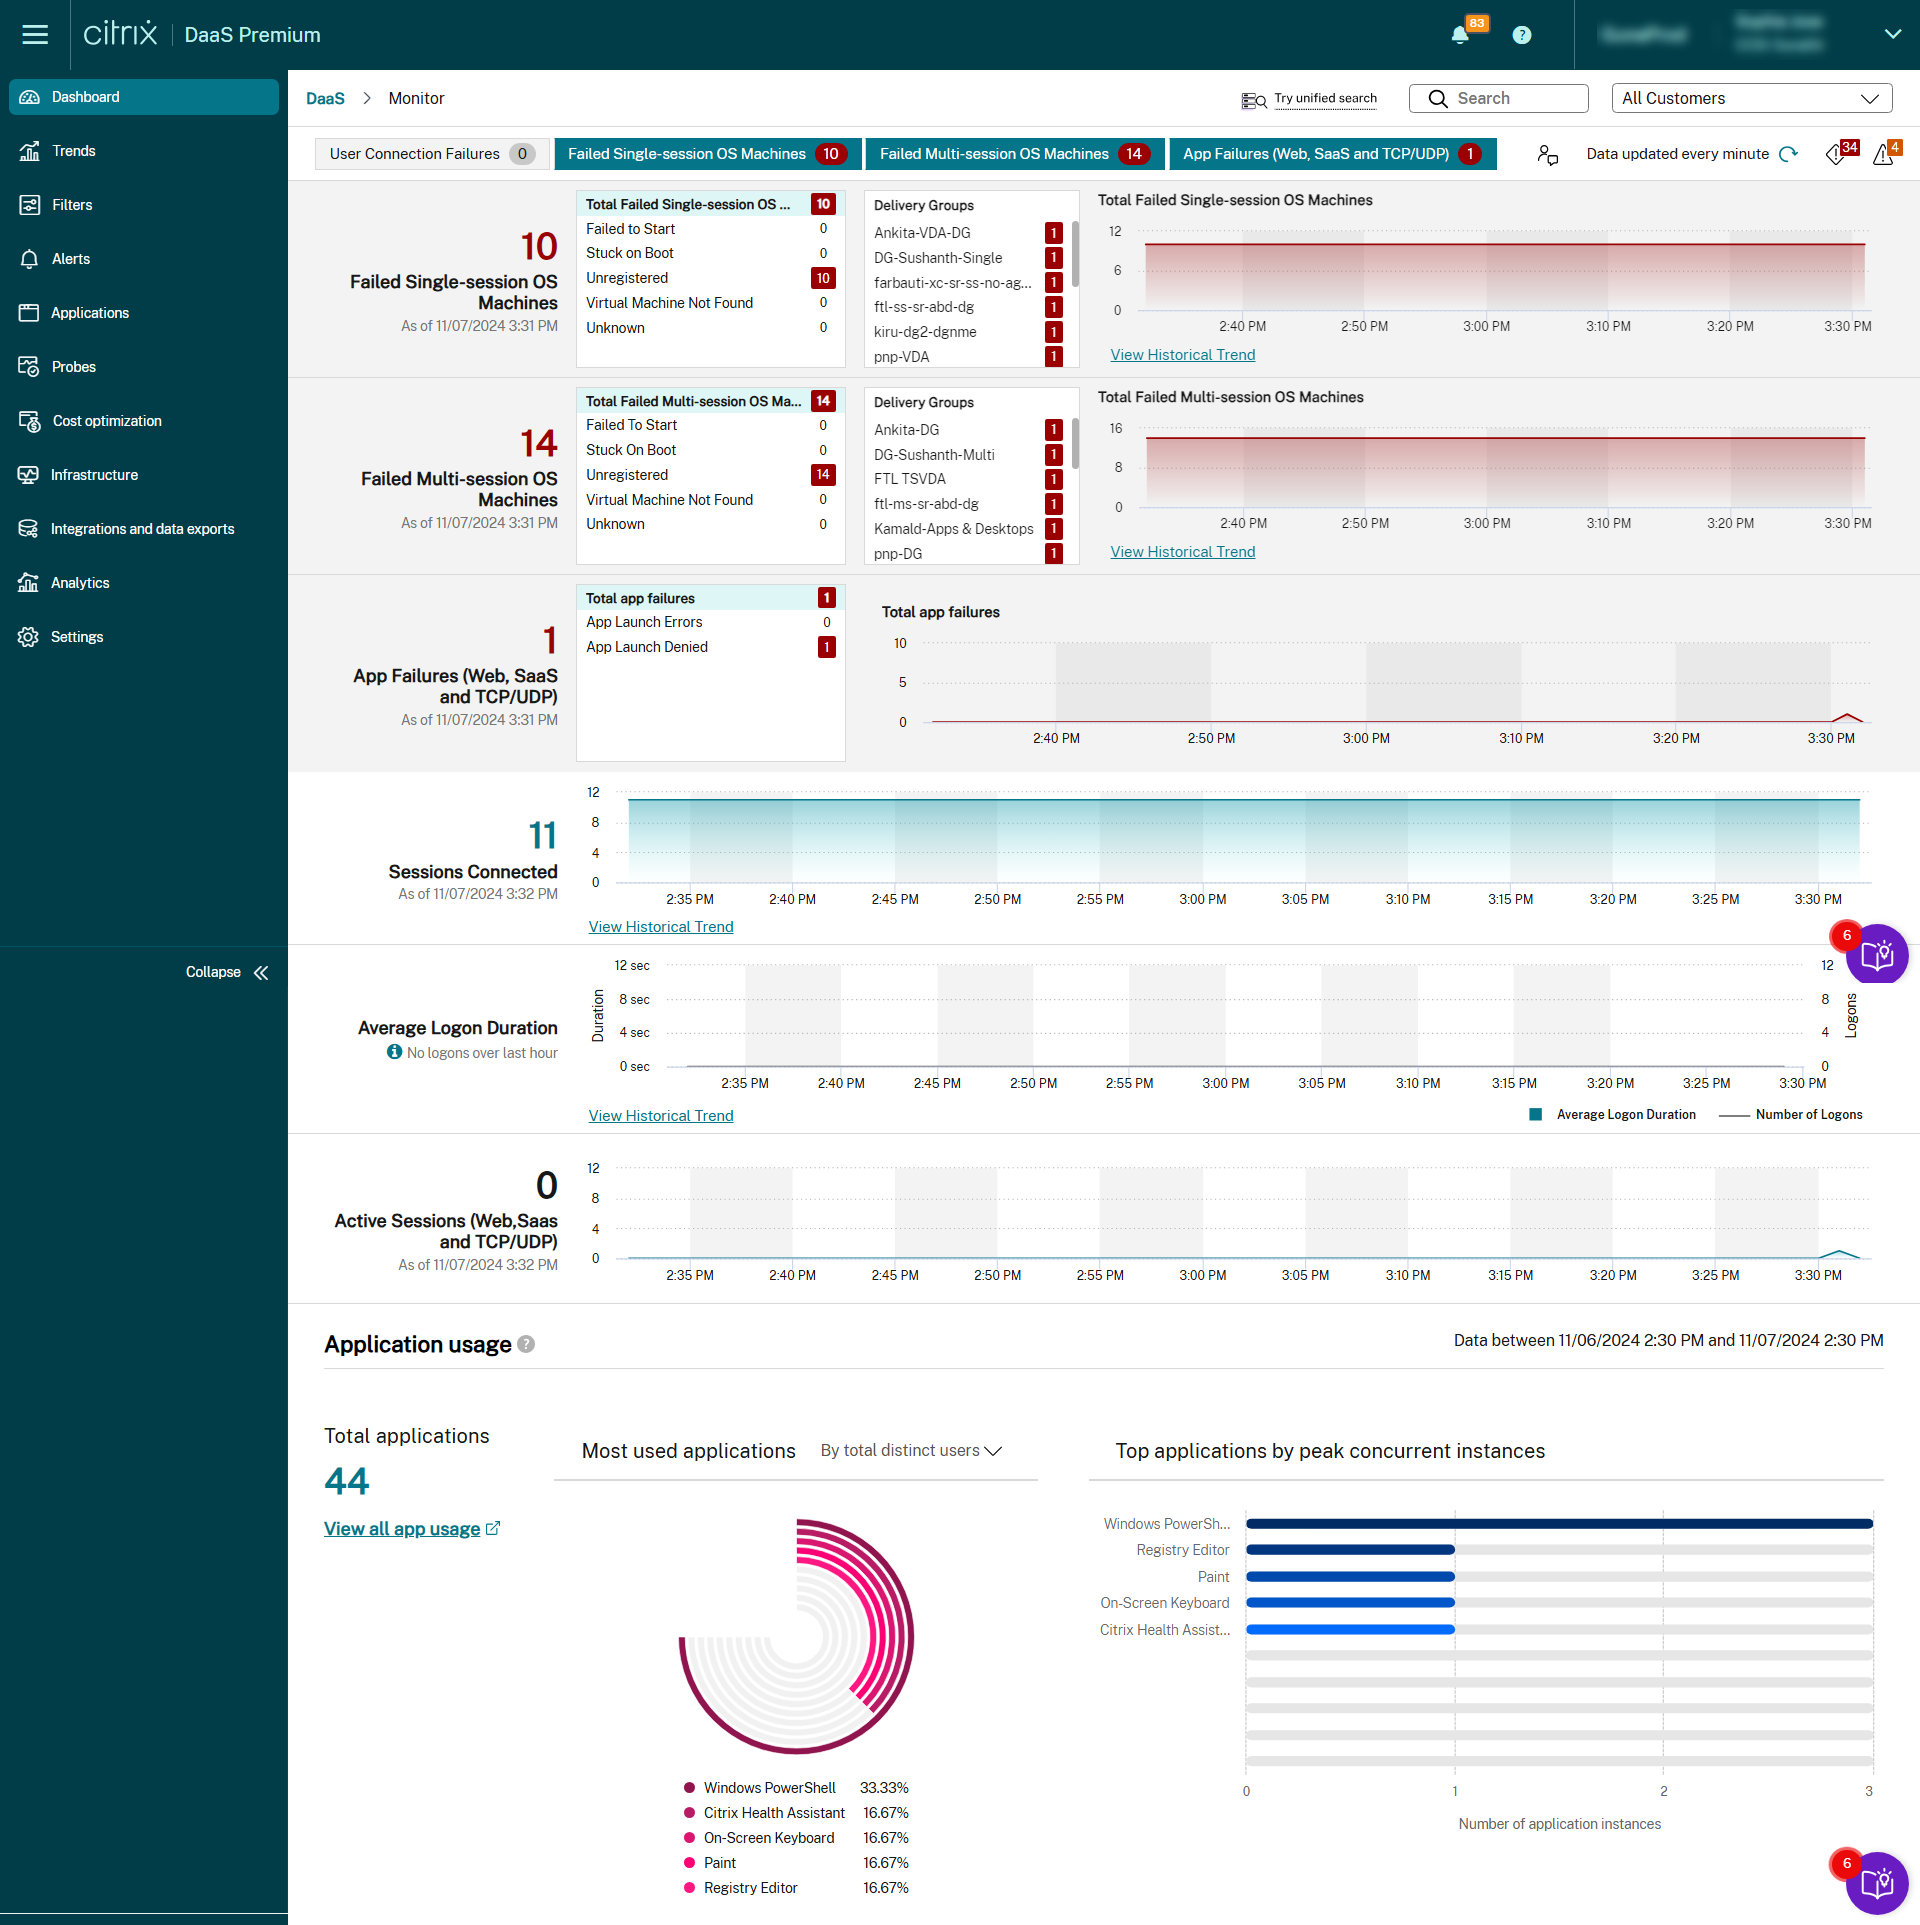
Administrators and help-desk personnel can monitor Citrix DaaS (formerly Citrix Virtual Apps and Desktops™ service) from Monitor, the monitoring and troubleshooting console. The Monitor node directs you to a dashboard to monitor, troubleshoot, and perform support tasks for subscribers.
Note:
Monitor is available as the Director console to monitor and troubleshoot Citrix Virtual Apps and Desktops Current Release and LTSR deployments.
To access Monitor, sign in to Citrix Cloud. In the upper left menu, select Solutions > DaaS. Click Monitor.
Note:
The recommended optimal screen resolution for viewing Citrix Monitor is 1440 x 1024.
Monitor provides:
- Real-time data from the Broker Agent using a unified console integrated with Analytics and Performance Manager.
- Analytics includes performance management for health and capacity assurance, and historical trending to identify bottlenecks in your Citrix DaaS™ environment.
- Historical data stored in the Monitor database to access the Configuration Logging database.
- Gain visibility into the end-user experience for virtual applications, desktops, and users for Citrix DaaS.
- Monitor uses a troubleshooting dashboard that provides real-time and historical health monitoring of Citrix DaaS. This feature allows you to see failures in real time, providing a better idea of what the end users are experiencing.
Share
Share
In this article
This Preview product documentation is Citrix Confidential.
You agree to hold this documentation confidential pursuant to the terms of your Citrix Beta/Tech Preview Agreement.
The development, release and timing of any features or functionality described in the Preview documentation remains at our sole discretion and are subject to change without notice or consultation.
The documentation is for informational purposes only and is not a commitment, promise or legal obligation to deliver any material, code or functionality and should not be relied upon in making Citrix product purchase decisions.
If you do not agree, select I DO NOT AGREE to exit.