Application and Desktop Probing
Application and desktop probing automates the process of checking the health of the apps and desktops that are published in a site by test launching them serially using StoreFront. The results of probing are available in the Monitor console of Citrix DaaS. Citrix Probe Agent supports all sites including those hosted on Citrix Cloud™ Japan and Citrix Cloud Government Control Planes.
Requirements
- Endpoint machines running probe agents are Windows machines with Citrix Workspace™ app for Windows version 1808 or later for application probing and version 1906 or later for desktop probing. Workspace app for Unified Windows Platform (UWP) is not supported.
- Citrix Probe Agent supports the default form-based authentication as supported by Citrix® StoreFront Cloud. In cases where the endpoint device is connected to a store using Citrix Gateway, you can authenticate using the Citrix Gateway domain credentials or Multi-factor authentication (MFA). Citrix Probe Agent doesn’t support other authentication methods like Single Sign-On (SSO). Similarly, Citrix Probe Agent works only when there is no proxy server or load balancer like Citrix Gateway or Citrix ADC deployed.
-
Application and Desktop probing is available in Citrix DaaS™ Premium and Citrix DaaS Premium Plus.
Note:
-
If user enabled the sign-in policy or conditional authentication on Citrix Cloud, probe agent fails to sign in to Storefront™ or Citrix Workspace app.
-
Probe Agent supports only the Active Directory authentication to authenticate to Citrix Workspace app.
-
- Ensure that Microsoft .NET Framework version 4.7.2 or later is installed on the endpoint machine where you want to install the Probe Agent.
- To use the probing agent in Citrix Cloud Japan Control Plane, set the registry value in the path, “\HKEY_LOCAL_MACHINE\SOFTWARE\WOW6432Node\Citrix\ProbeAgent\AGENT\region” to 2. To use the probing agent in Citrix Cloud Government Control Plane, set the registry value in the path, “\HKEY_LOCAL_MACHINE\SOFTWARE\WOW6432Node\Citrix\ProbeAgent\AGENT\region” to 3.
User accounts/permissions required to run Probing:
- A unique user to probe on each endpoint machine. The user is not required to be an administrator; the probes can run in a non-admin context.
- User accounts with Windows administrator permissions to install and configure the Citrix Probe Agent on the endpoint machines.
- User must be a member of the same domain as the VDAs used for application or desktop launch. Probe Agent currently doesn’t support multiple domains.
- Reusing existing user accounts for probing might log off from the users’ active sessions. A full administrator user account or a custom role with the following permissions:
- Delivery group permissions:
- Read-only
- Director permissions:
- Create\Edit\Remove Alert Email Server Configuration - if the email server is not already configured
- Create\Edit\Remove Probe Configurations
- View Configurations page
- View Trends page
- Delivery group permissions:
Configuration
You can schedule your probes to run during off-peak hours across multiple geographies. The comprehensive probe results can help to troubleshoot issues related to the applications, hosting machine or connection before the users experience them.
Citrix Probe Agent version 2103 supports site aggregation. Applications and desktops can be enumerated and launched from aggregated sites. When you configure the probe agent, select the Workspace (StoreFront) Site Aggregation Enabled option to enable enumeration of applications and desktops from aggregated sites. The following combinations of sites are supported:
- Multiple on-premises sites having one store URL.
- On-premises and cloud sites having either an on-premises store URL or a cloud store URL.
- Multiple cloud sites having one store URL.
Note:
You must create separate administrators or users to configure probes that have access to only one site.
Step 1: Install and configure the Citrix Probe Agent
The Citrix Probe Agent is a Windows executable that simulates the actual application or desktop launch by the user through StoreFront. It tests launches as configured in Monitor and reports back the results to Monitor.
-
Identify endpoint machines from where you want to run probing.
-
Users with administrative privileges can install and configure the Citrix Probe Agent on the endpoint machine. Download the Citrix Probe Agent executable available in the Citrix downloads page.
-
Start the agent and enter the credentials of an appropriate user. Configure a unique user on each endpoint machine. The credentials are encrypted and stored securely.
Notes:
- To access the site to be probed from outside the network, type the login URL for Citrix Gateway in the store URL field. Citrix Gateway automatically routes the request to the corresponding site store URL.
- Use NetBIOS as the domain name in the user name field. For example, NetBIOS/username.
- App probing supports Citrix Content Collaboration™ service using authentication (AD only).
-
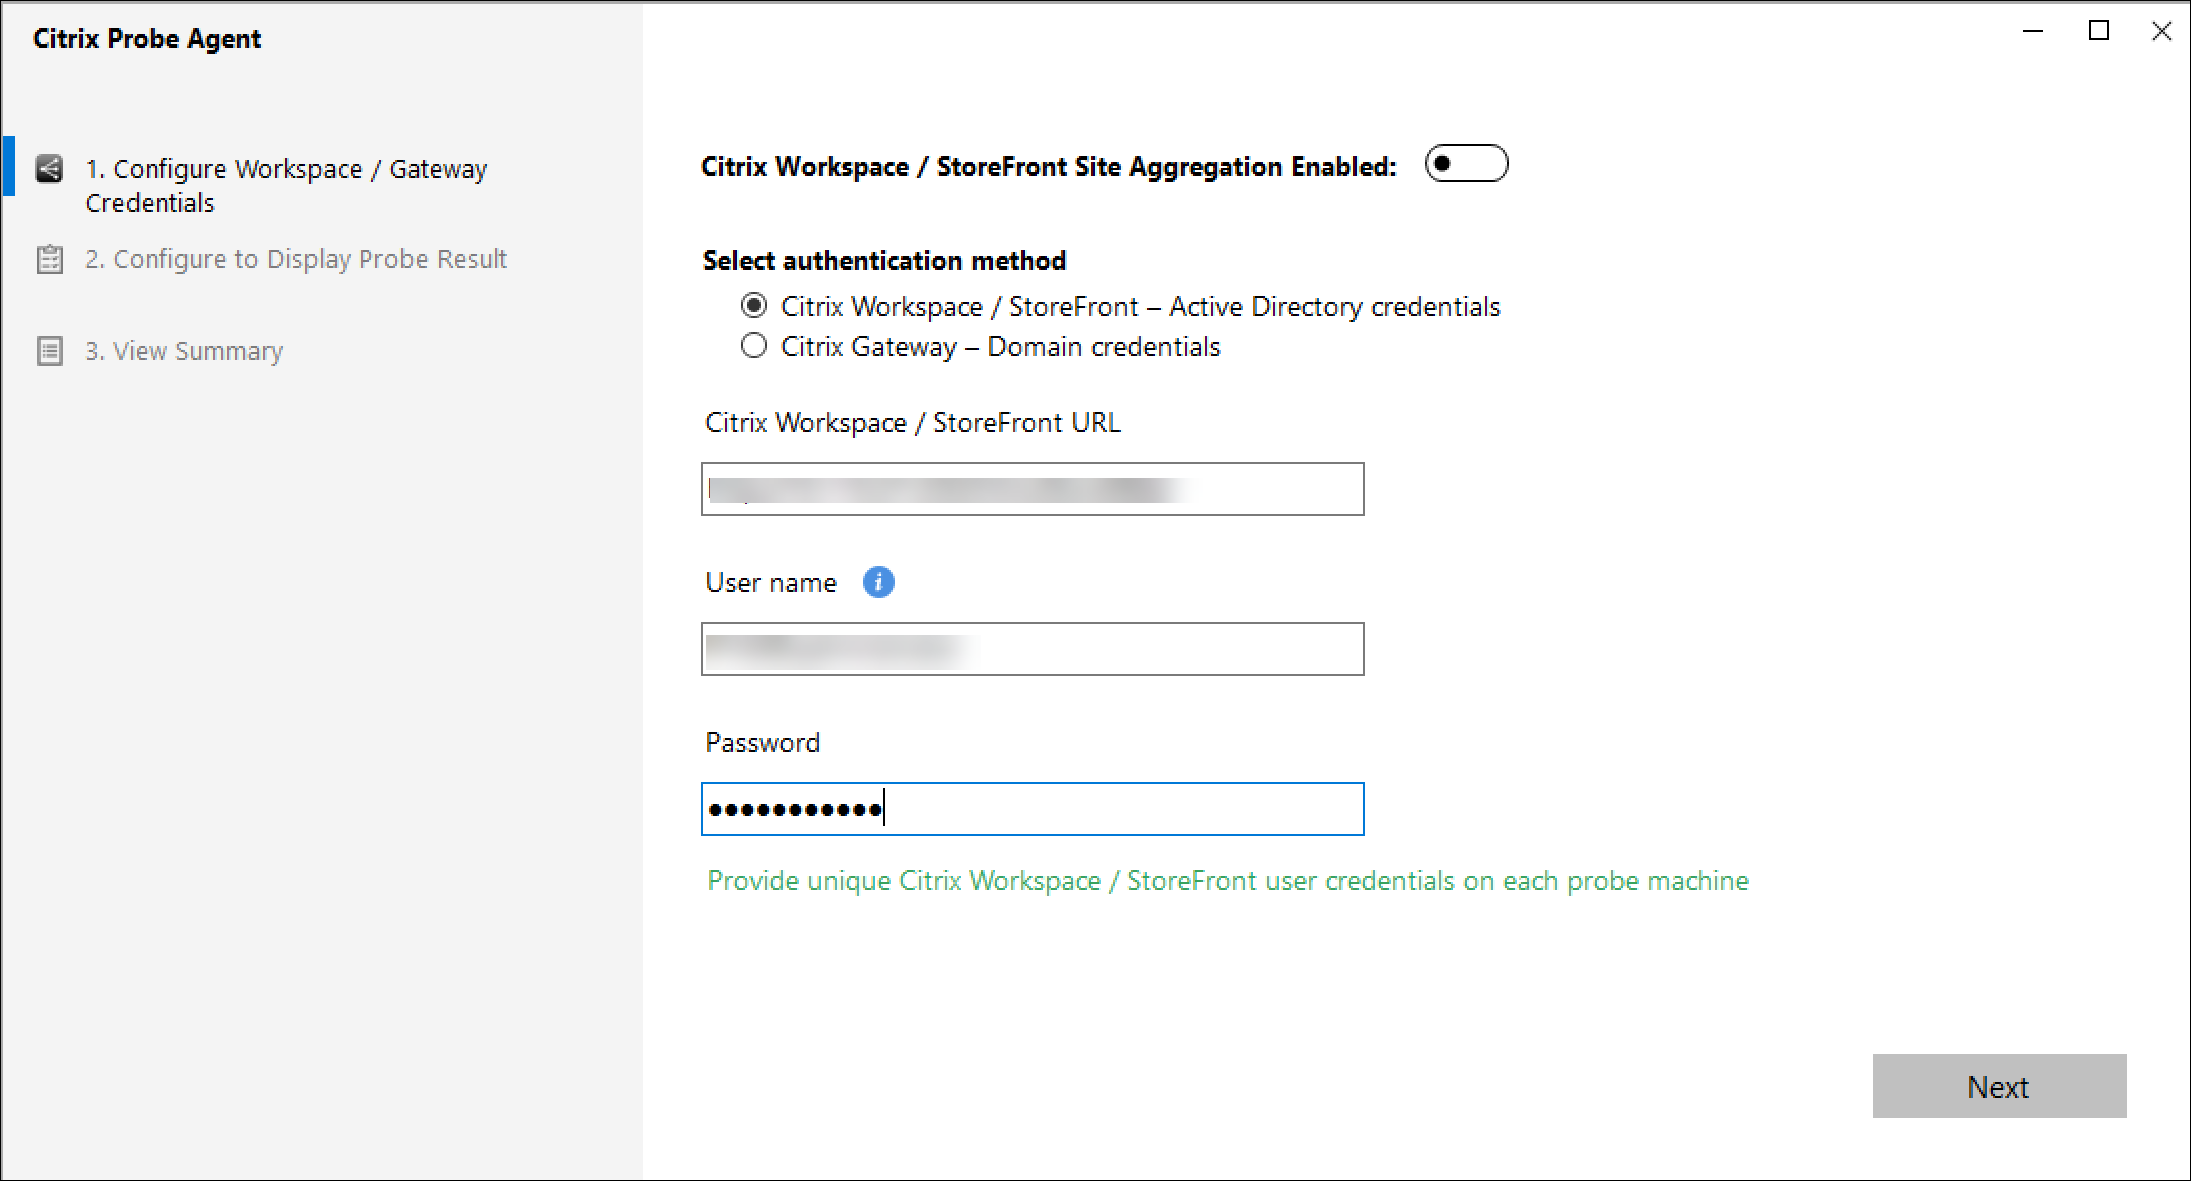
Select an authentication method and enter the relevant credentials. Credentials are encrypted and stored securely.
-
Configure with your StoreFront Active Directory credentials. Configure a unique user on each endpoint machine.
-
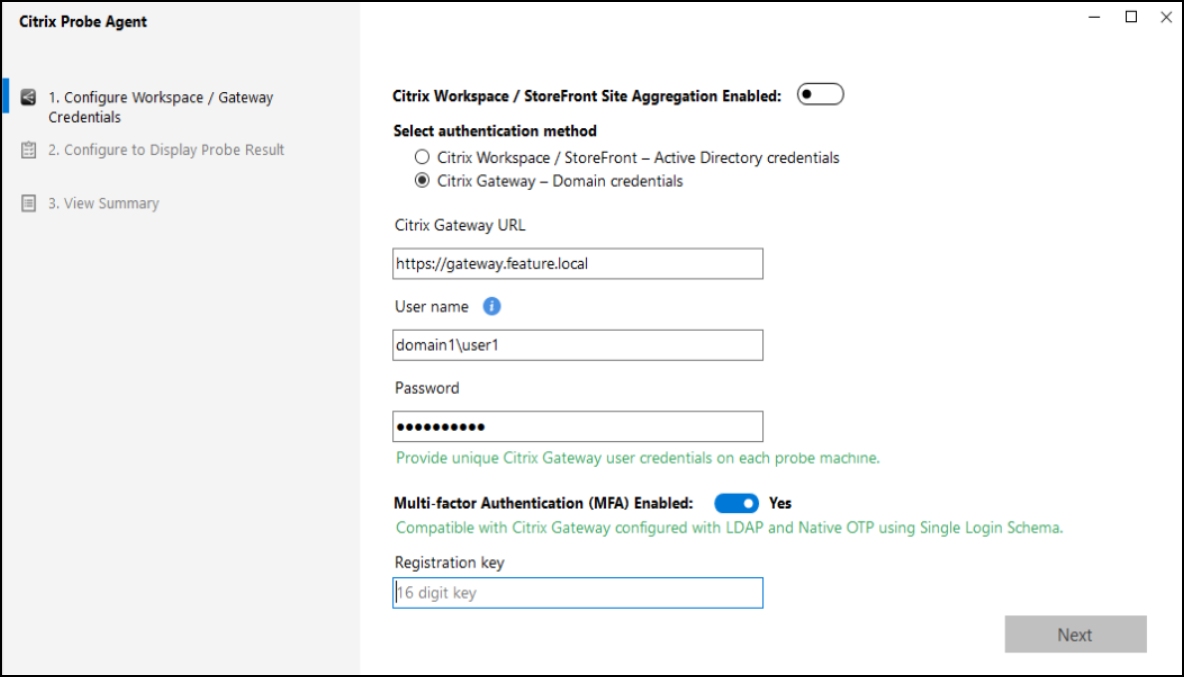
Choose the Citrix Gateway option if your endpoint is connected to StoreFront via Citrix Gateway and configure with your Citrix Gateway Domain credentials.
-
Choose Multi-factor Authentication option if your Gateway supports it and enter the 16-digit authentication key. This is available only for Citrix Gateway that is configured with LDAP and Native OTP using Single Login Schema.
-
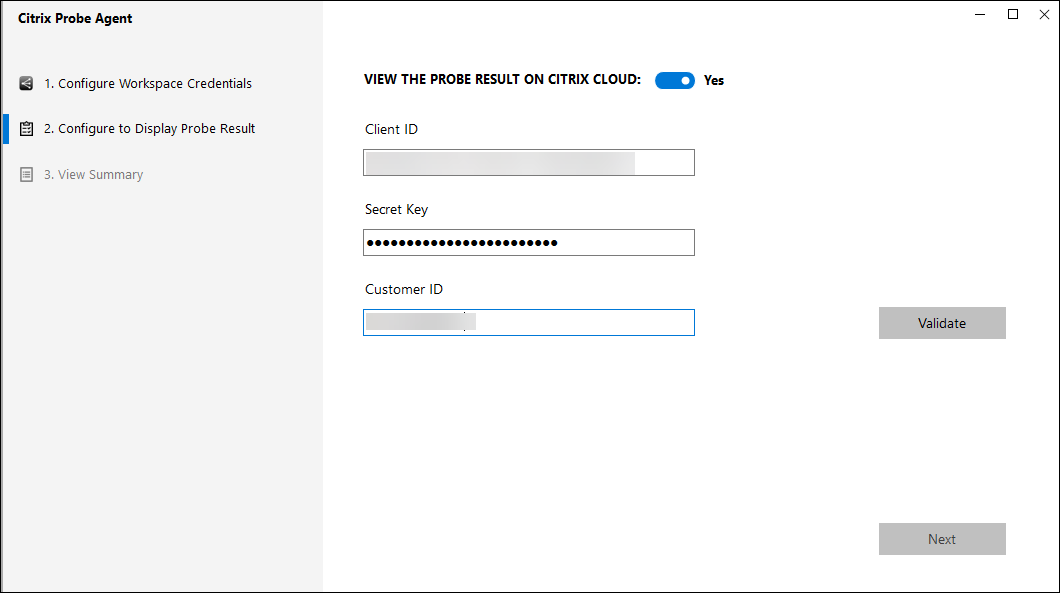
In the Configure To Display Probe Result tab, enter credentials to access Citrix DaaS. You can find the Customer Name or Customer ID, Client ID, and Secret Key from the API Access page in the Citrix Cloud console.
-
Select your site and click Next.
-
In the View Summary tab, ensure that the configured details are accurate. If you need to make changes, go to the respective tab and make the updates.
Step 2: Configure Probing in Monitor
Limitation:
Probing fails if applications or desktops are test launched from Windows VDAs that have the interactive logon message banner enabled. This is because a timeout occurs due to waiting to accept the interactive logon message. To disable the logon message on a Server VDA. Go to Computer Configuration > Windows Settings > Security Settings > Local Policies > Security options.
Remove the text in the following fields and update the Microsoft policy.
- Interactive Logon: Message Text for users attempting to logon
- Interactive Logon: Message Title for users attempting to logon
Assign the probe user to this specific Server VDA with the interactive logon message banner disabled to ensure that the probe can get past the Application or Desktop Launch State.
For more information, see https://learn.microsoft.com/en-us/windows/security/threat-protection/security-policy-settings/interactive-logon-message-text-for-users-attempting-to-log-on.
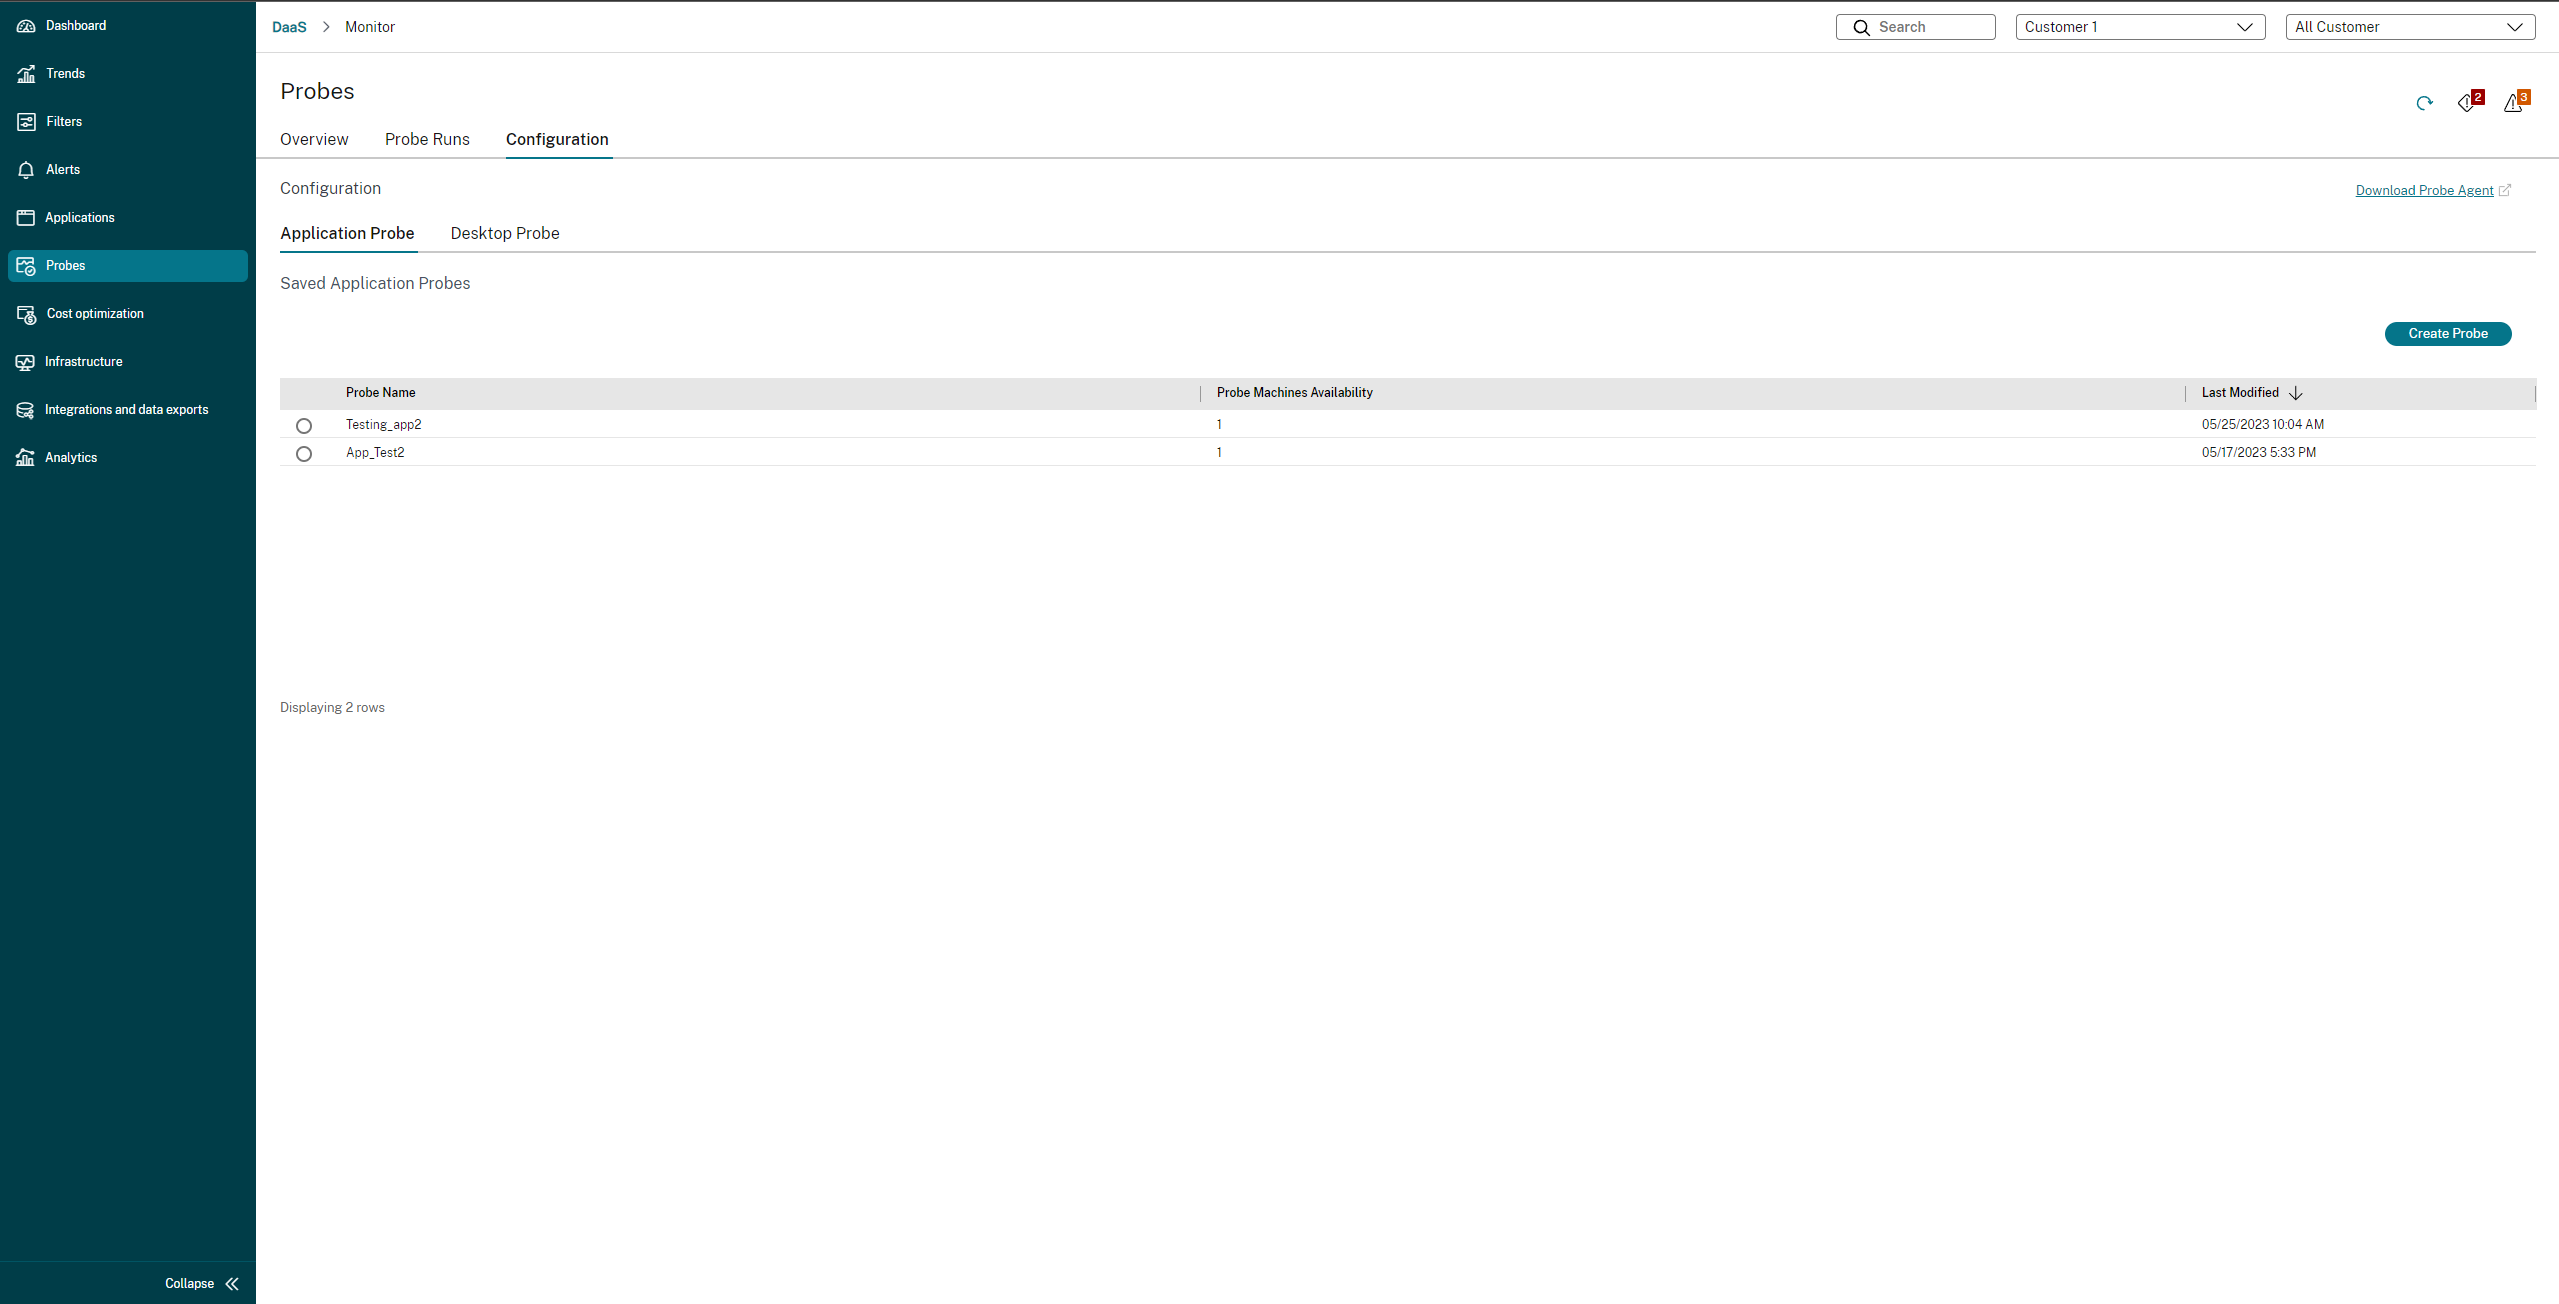
- Go to Configuration > Probe Configuration > Application Probe or Desktop Probe and click Create Probe.
- In the Create Probe page, enter the name of the probe.
-
Select the schedule:
- Choose the days of the week on which you want the probe to run.
- Enter the start time at which you want the probe to run.
- In addition, you can choose the Repeat in a day option. Enter the end time and the interval in which you want the probe to repeat within a day. For example, the configuration below helps run application probes from 12:08 hours until 16:34 hours repeating every 30 minutes every Monday, Wednesday, Thursday, and Sunday.
- Select the recommended number of applications or desktops to be probed depending on the interval.
- Select the endpoint machines on which the probe must run.
-
Enter the email addresses to which the failure probe results are sent. Configure your email server in Alerts > Email Server Configuration.
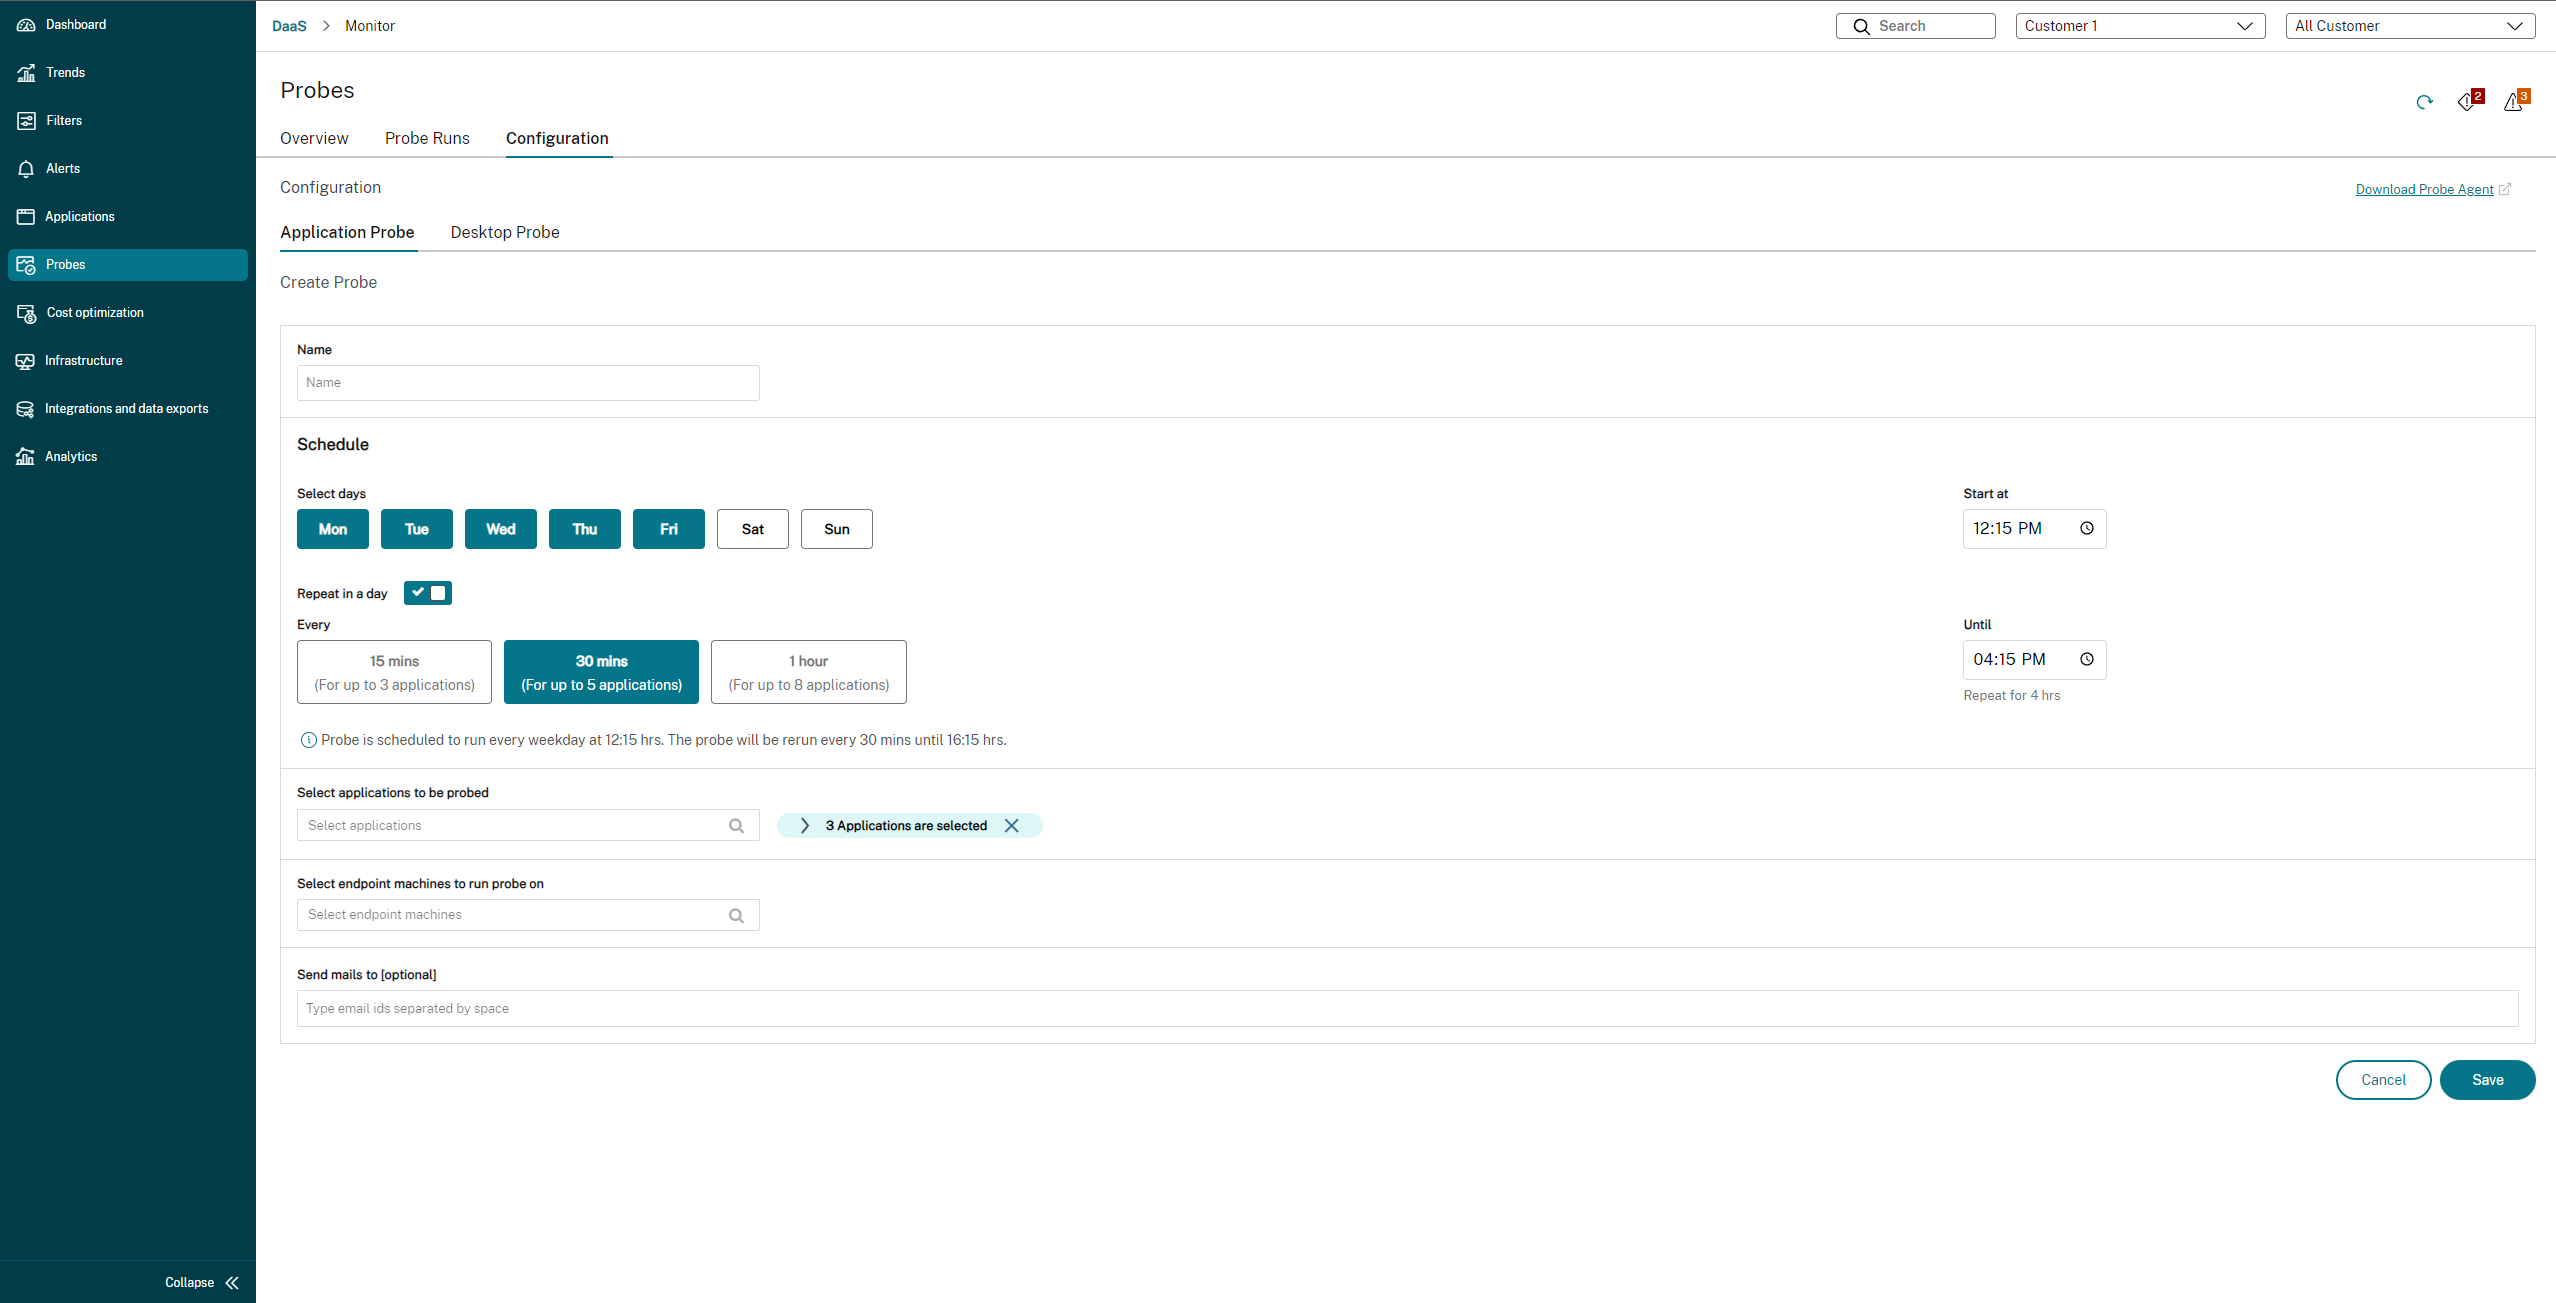
In this configuration, the application sessions launch at 12:08 hours, 12:38 hours, 13:08 hours, and so on until 16:08 hours every Monday, Wednesday, Thursday, and Sunday.
Note:
- After configuration, the agent runs the configured probes starting the next hour.
- The probes that were set up before the Repeat in a day option was introduced, continue to run at their scheduled time. They have the Repeat in a day option disabled by default.
- It is recommended that you configure probes such that each run has a period of 5 minutes to prevent overlaps.
Step 3: Probe execution
The agent runs probing as per the probe configuration that it fetches from Monitor periodically. It launches selected applications or desktops serially using Workspace. The agent reports the results back to Monitor via the Monitor database. Failures are reported in five specific stages:
- Workspace Reachability - configured store URL is not reachable.
- Workspace Authentication - configured StoreFront credentials are invalid.
- Workspace Enumeration - Workspace Enumerate applications list does not contain the application or desktop to be probed.
- ICA® download - the ICA file is not available.
- Application / Desktop launch – the application or desktop could not be launched.
Step 4: View probe results
You can see the probe results in Probes. The Probes view gives a comprehensive glimpse of the probe results. These results help analyze and troubleshoot issues proactively, enabling a smoother session launch experience for users.
The Overview tab provides a summary of all the configured probes in a single view.
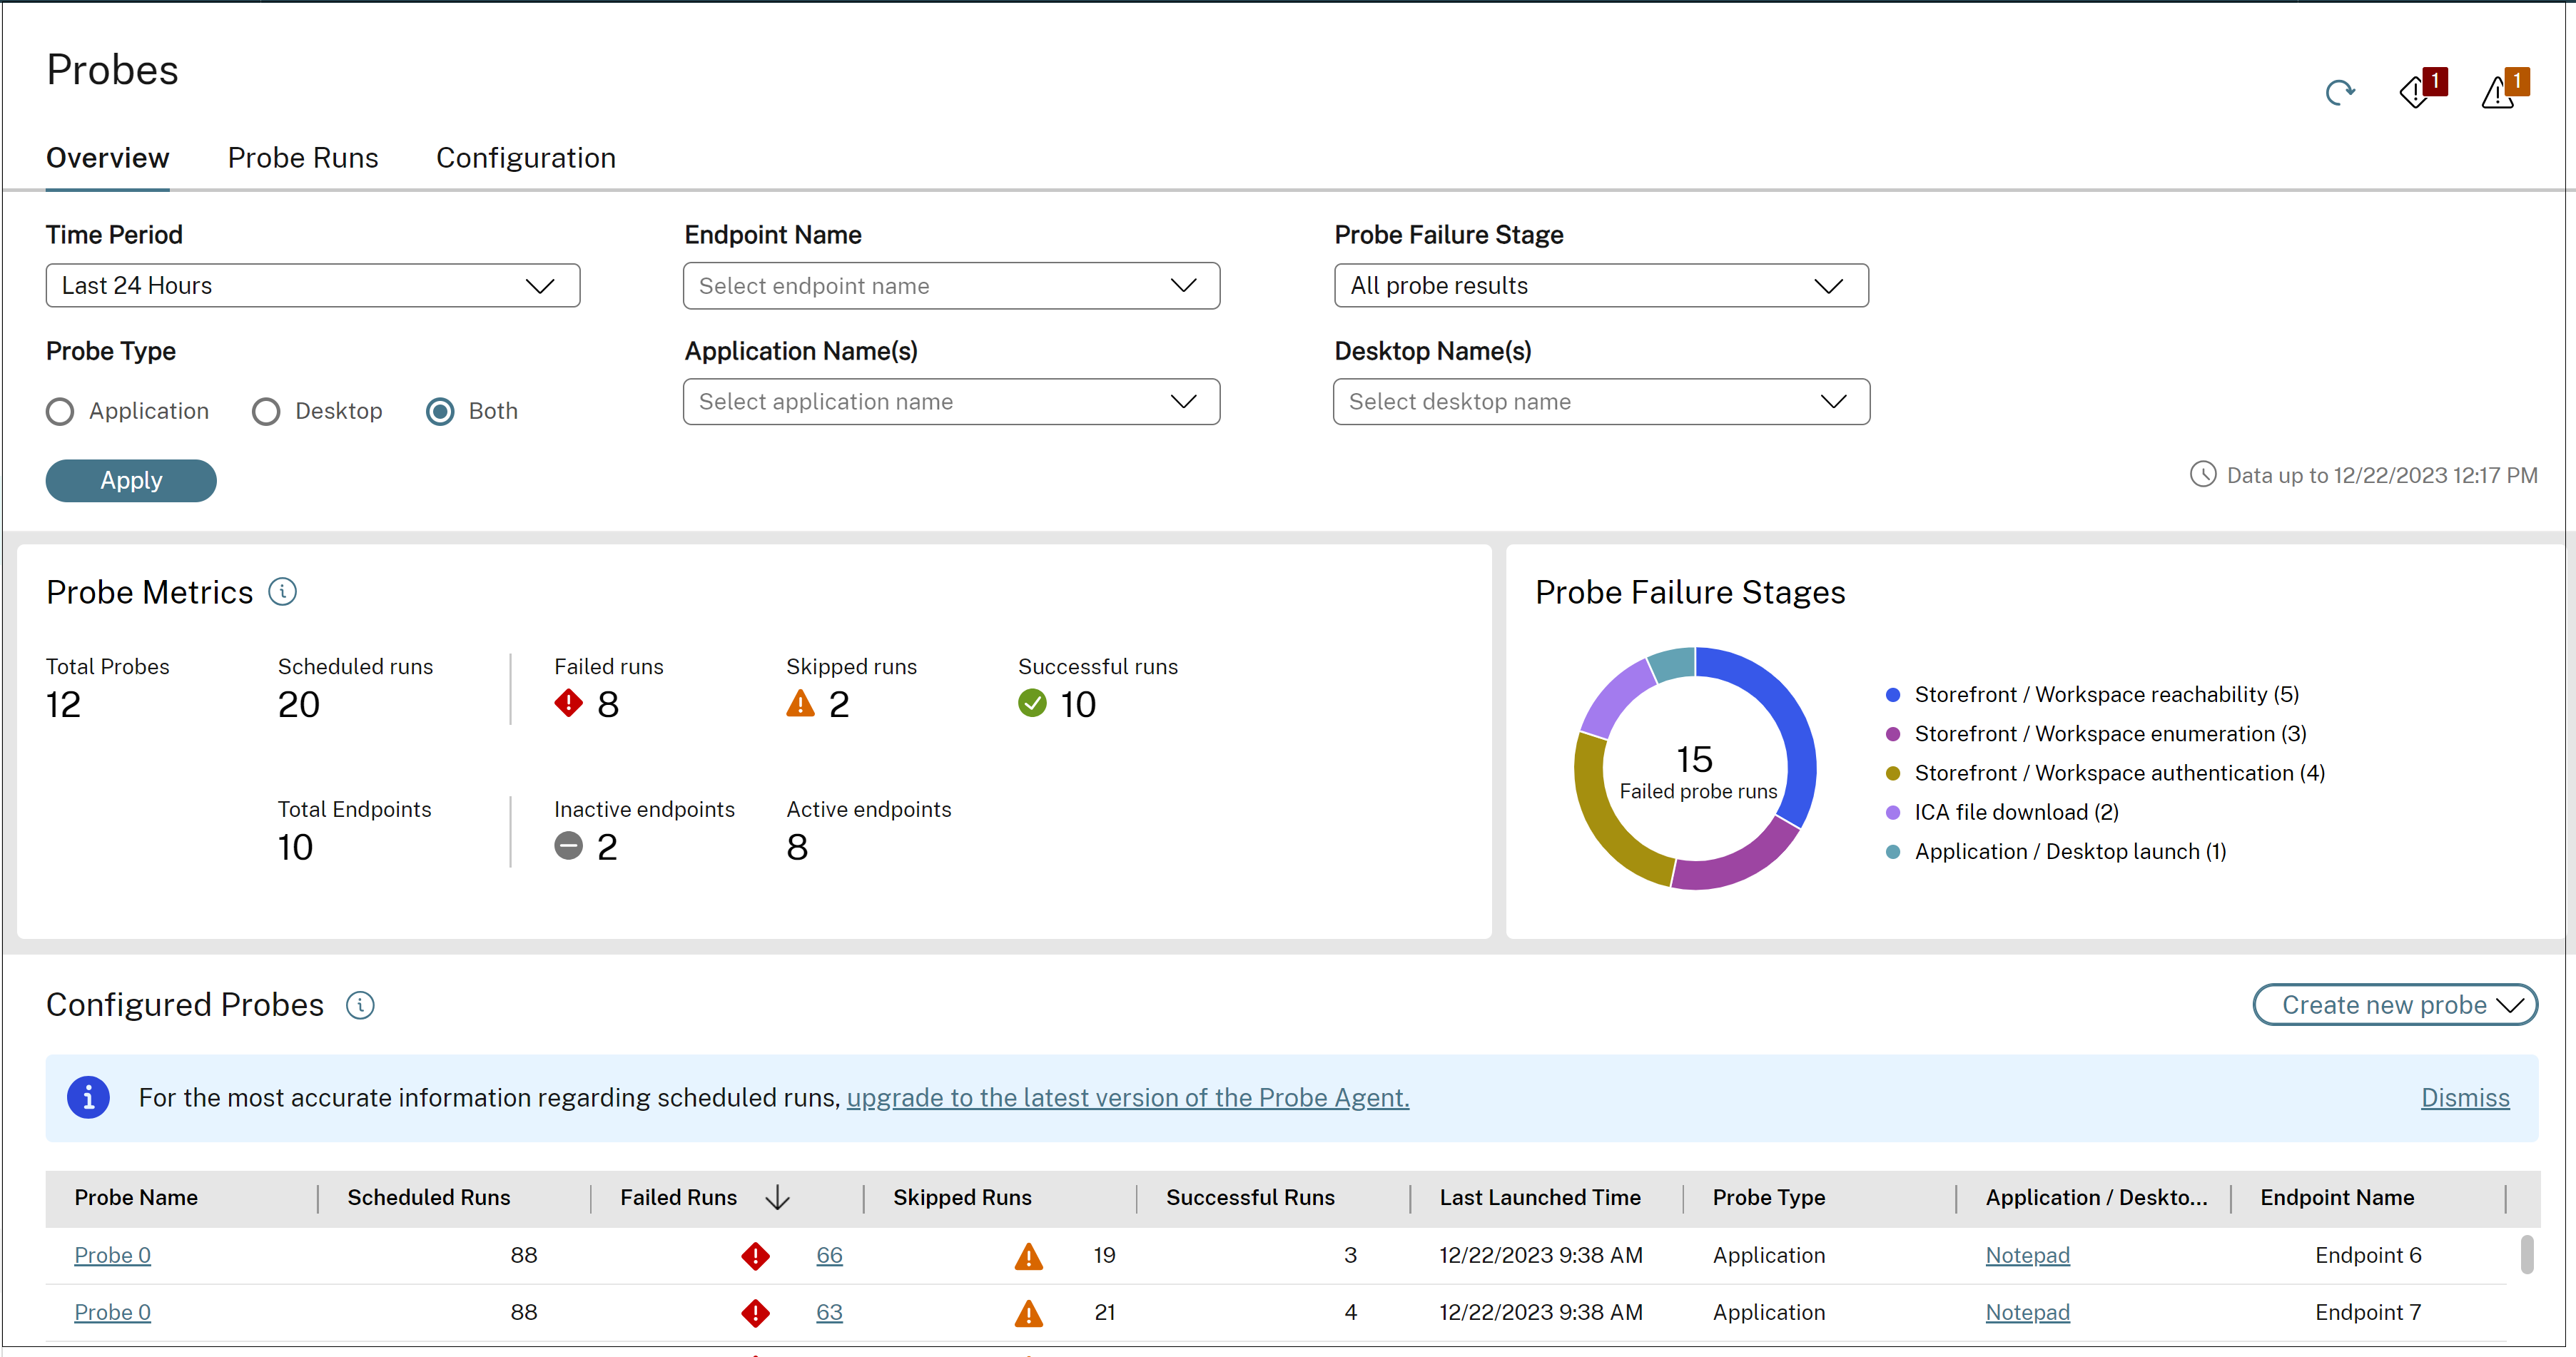
You can filter probes based on Time Period, Probe Type, Endpoint name, Application Name, Desktop Name and Probe Result Type. Probes that match the filter criteria are shown with the following details per probe, application/desktop and endpoint.
Probe Metrics shows the count of Scheduled, Planned, Skipped, Successful, and Failed runs.
- Completed Runs – the number of probe runs that ran to completion.
- Failed Runs – the number of probe runs that failed.
- Skipped Runs – The number of skipped runs is equal to the number of scheduled runs minus the sum of failed runs and successful runs.
- Successful Runs – the number of probes that completed successfully with no failures in any stage during the app/desktop launch.
The total number of endpoint machines is also displayed, with the count of active and inactive machines.
Probe Failure Stages presents a visual breakdown of the failure distribution for each failure group. By analyzing the stages in which most failures have occurred, it becomes easier to interpret the probe results and troubleshoot issues. The graphical representation shows the number of failed probe runs for application/desktop launch, ICA file downloads, Storefront/Workspace enumeration, Storefront/Workspace reachability, and Storefront/Workspace authentication.
It helps analyze the stages in which most failures have occurred. This information helps quickly understand the probe results and troubleshoot.
Some probe runs might not run to completion due to either the endpoint being inactive, or services being unavailable.
The Probe Runs tab provides the results of the completed probe runs in detail. You can drilldown to see the details of each individual run of a selected probe. You can filter and analyze further based on important pivot points.
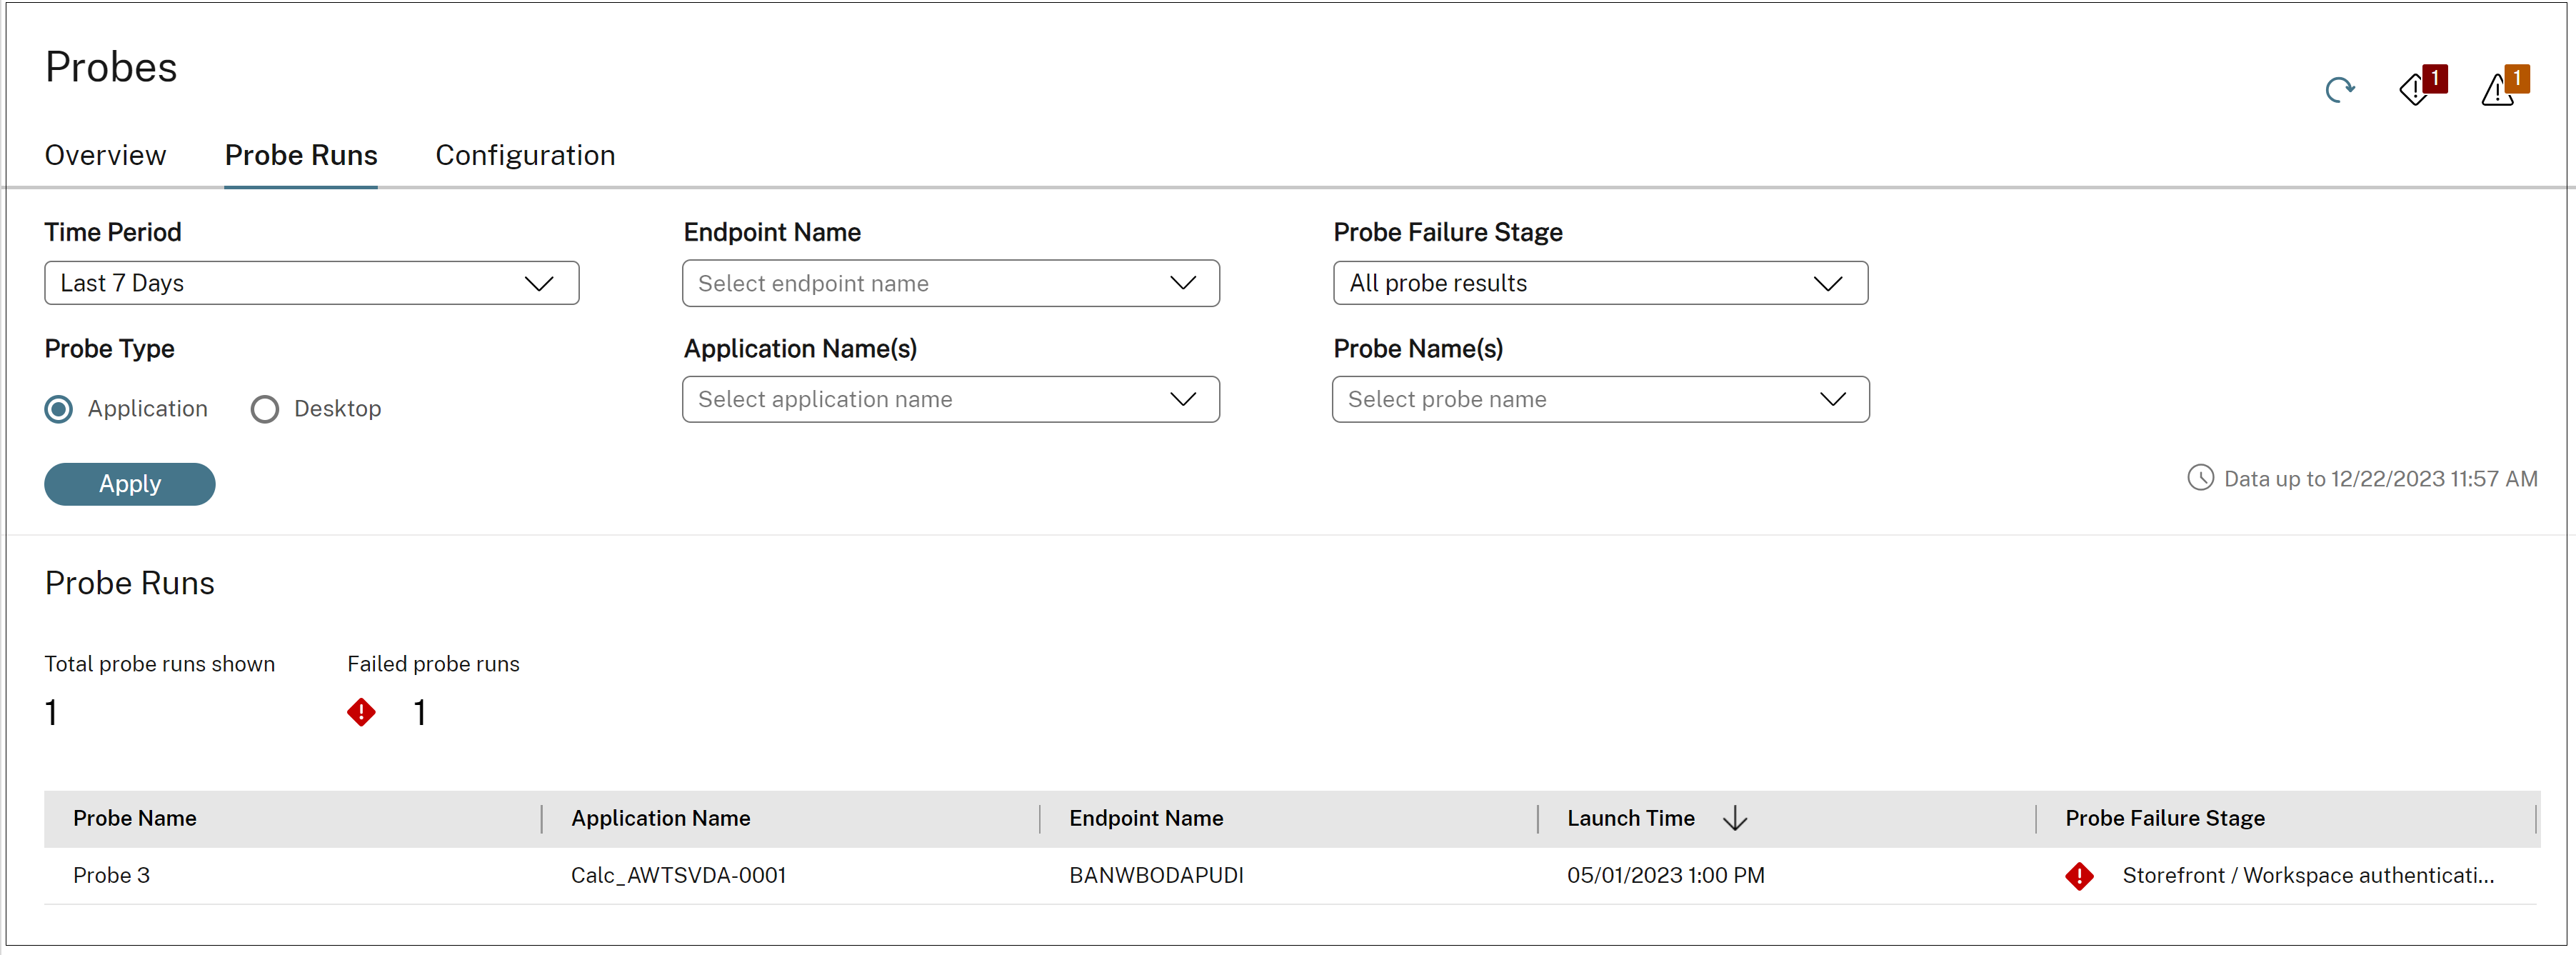
You can filter the probes runs based on Time Period, Probe Type, Endpoint name, Application Name, Desktop Name and Probe Failure Stage. Probe Failure Stage displays the stage in which the probe failed. Clicking on the Probe Name, Scheduled Runs, Failed Runs, Application/ Desktop name links also takes you to the Probe Runs page with the list of Probe runs matching the filter criteria.