Splunk Integration with Citrix Analytics for Performance™
You can integrate Citrix Analytics for Performance with Splunk to export performance data from your virtual apps and desktops sites to Splunk and get deeper insights into the performance of your virtual apps and desktops environment.
For more information about the benefits of the integration and the type of processed data that is sent to your Observability platform, see Data Export.
Supported versions
Citrix Analytics for Performance supports Splunk integration on the following operating systems. Citrix recommends using the latest version of these operating systems or versions that are still under support from the respective vendors.
- CentOS Linux 7 and later
- Debian GNU/Linux 10.0 and later
- Red Hat Enterprise Linux Server 7.0 and later
- Ubuntu 18.04 LTS and later
Note
For the Linux Kernel (64-bit) operating systems, use a kernel version that Splunk supports. For more information, see Splunk documentation.
You can configure Splunk integration on the following Splunk versions:
- Splunk Cloud Inputs Data Manager (IDM)
- Splunk 8.1 (64-bit) and later
Prerequisites
Citrix Analytics add-on for Splunk connects to the following endpoints on Citrix Analytics for Performance. Ensure that the endpoints are in the allow list in your network. Use the endpoint names and not IP addresses, as the public IP addresses of the endpoints might change.
| Endpoint | United States region | European Union region | Asia Pacific South region |
|---|---|---|---|
| Kafka brokers | casnb-0.citrix.com:9094 |
casnb-eu-0.citrix.com:9094 |
casnb-aps-0.citrix.com:9094 |
casnb-1.citrix.com:9094 |
casnb-eu-1.citrix.com:9094 |
casnb-aps-1.citrix.com:9094 |
|
casnb-2.citrix.com:9094 |
casnb-eu-2.citrix.com:9094 |
casnb-aps-2.citrix.com:9094 |
|
casnb-3.citrix.com:9094 |
Turn on data processing for at least one data source. It helps Citrix Analytics for Performance to begin the Splunk integration process.
Data Export Configuration
Account Setup
-
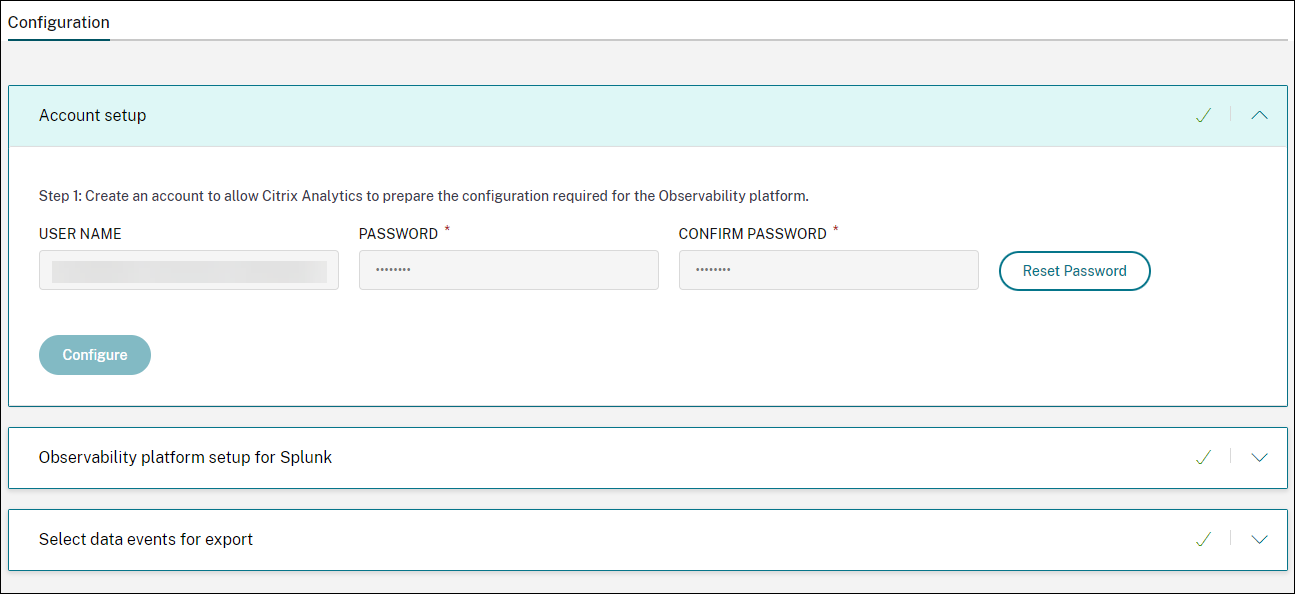
Go to Settings > Data Exports > Performance.
-
In the Account setup section, create an account by specifying a password. This account is used to prepare a configuration file required for Splunk integration.
-
Click Configure. Citrix Analytics for Performance prepares the configuration details - user name, hosts, Kafka topic name, and group name. Copy the details to help configure Citrix Analytics Add-on for Splunk in the subsequent steps.
Note
These details are sensitive and you must store them in a secure location.
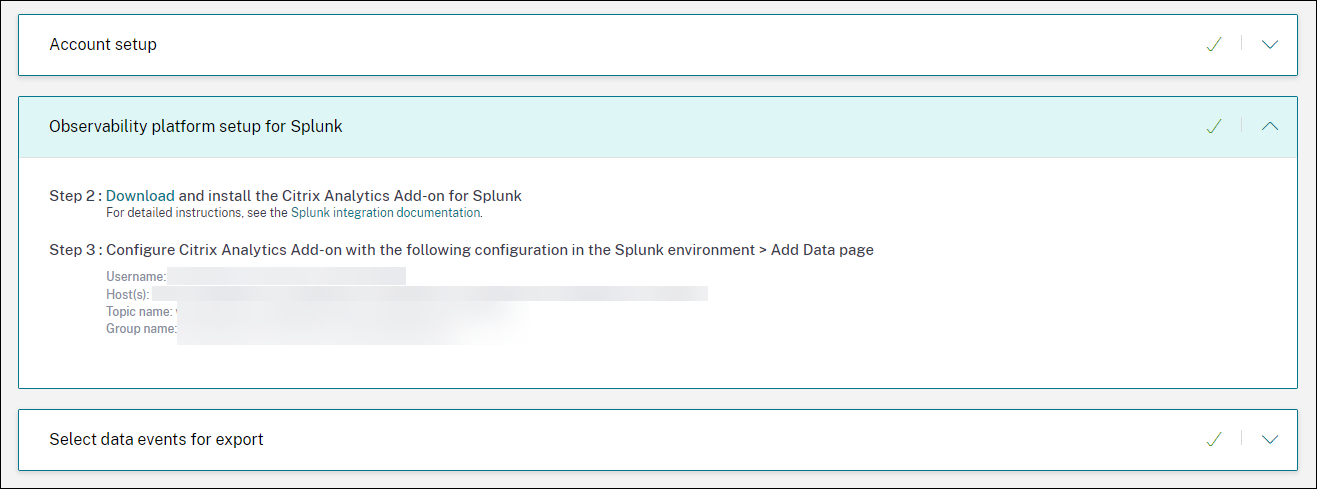
Observability Platform setup for Splunk
Download and install Citrix Analytics Add-on for Splunk
Note
This app is in preview.
Citrix Analytics add-on for Splunk enables Splunk Enterprise administrators to view performance data collected from Citrix Analytics for Performance. You can also correlate the data collected from Citrix Analytics for Performance with data from other data sources configured on your Splunk. This correlation provides you visibility into performance from multiple sources and take actions to improve the usage and performance of your virtual apps and desktops environment.
-
Log on to your Splunk Forwarder or Splunk Standalone environment.
-
Install the Citrix Analytics Add-on for Splunk by either downloading it from Splunkbase or by installing it from within Splunk.
Install app from Splunkbase
-
Download the Citrix Analytics Add-on for Splunk file.
-
On the Splunk Web home page, click the gear icon next to Apps.
-
Click Install app from file.
-
Locate the downloaded file and click Upload.
Notes
-
If you have an older version of the add-on, select Upgrade app to overwrite it.
-
If you are upgrading Citrix Analytics Add-on for Splunk from a version earlier than 2.0.0, you must delete the following files and folders located inside the /bin folder of the add-on installation folder and restart your Splunk Forwarder or Splunk Standalone environment:
cd $SPLUNK_HOME$/etc/apps/TA_CTXS_AS/binrm -rf splunklibrm -rf macrm -rf linux_x64rm CARoot.pemrm certificate.pem
-
-
Verify that the app appears in the Apps list.
Install app from within Splunk
-
From the Splunk Web home page, click +Find More Apps.
-
On the Browse More Apps page, search Citrix Analytics Add-on for Splunk.
-
Click Install next to the app.
-
Verify that the app appears in the Apps list.
Configure index and source type to correlate data
-
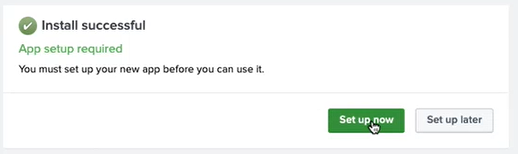
After you install the app, click Set up now.
-
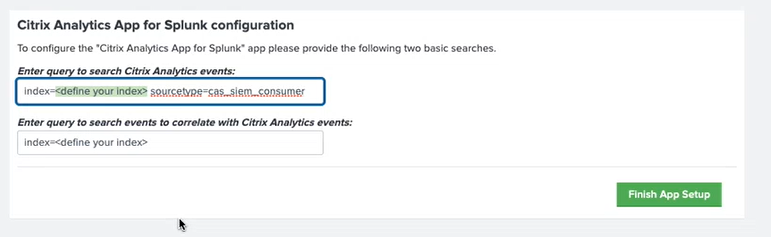
Enter the following queries:
-
Index and source type where the data from Citrix Analytics for Performance are stored.
Note
These query values must be the same as specified in the Citrix Analytics Add-on for Splunk. For more information, see Configure Citrix Analytics Add-on for Splunk.
-
Index from which you want to correlate your data with Citrix Analytics for Performance.
-
-
Click Finish App Setup to complete the configuration.
Configure Citrix Analytics Add-on for Splunk
Configure the Citrix Analytics Add-on for Splunk using the configuration details provided by Citrix Analytics for Performance. After the add-on is successfully configured, Splunk starts consuming events from Citrix Analytics for Performance.
-
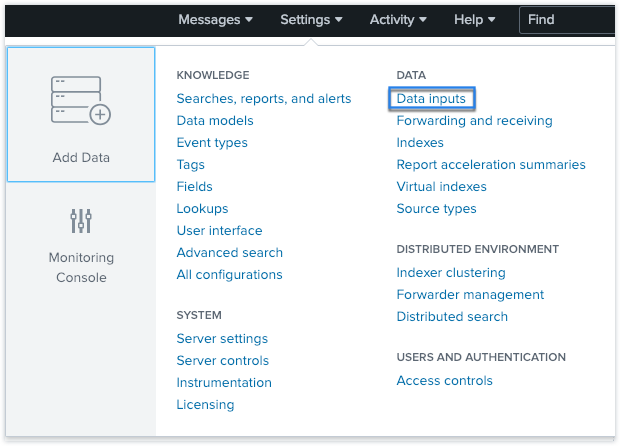
On the Splunk home page, go to Settings > Data inputs.
-
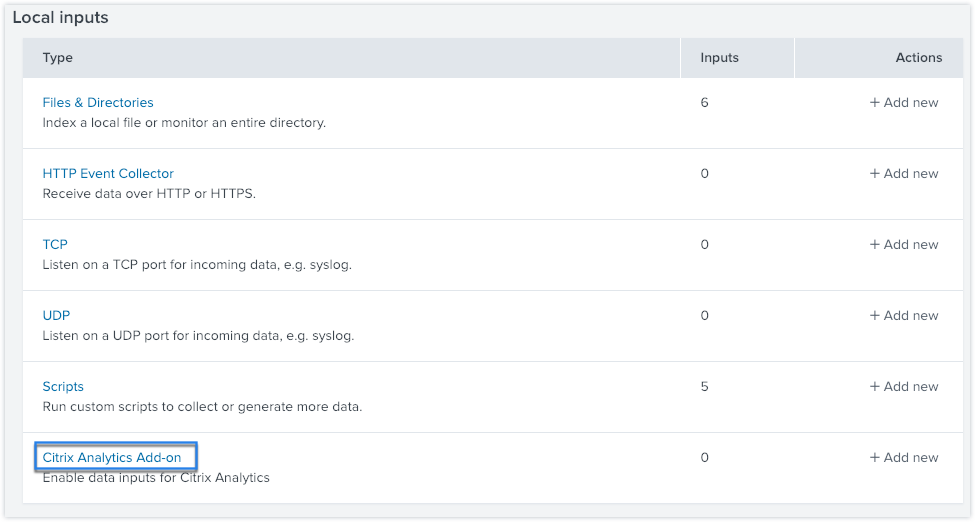
In the Local inputs section, click Citrix Analytics Add-on.
-
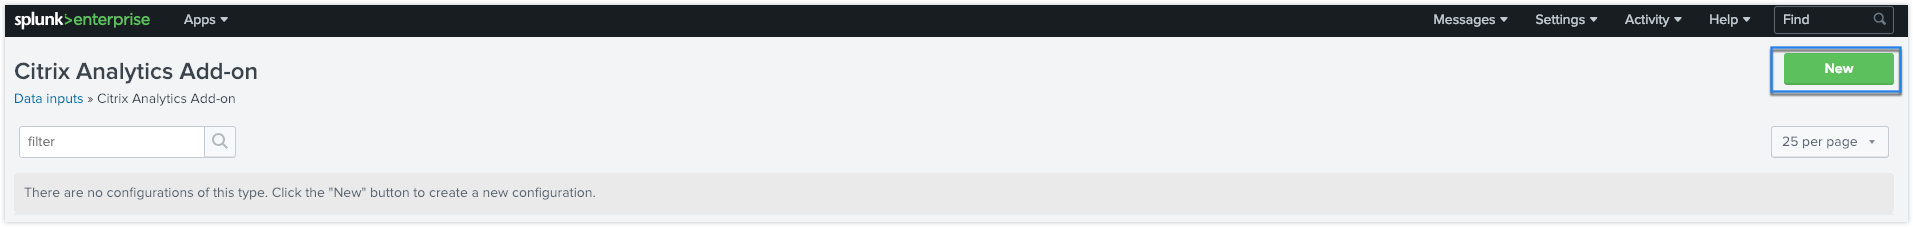
Click New.
-
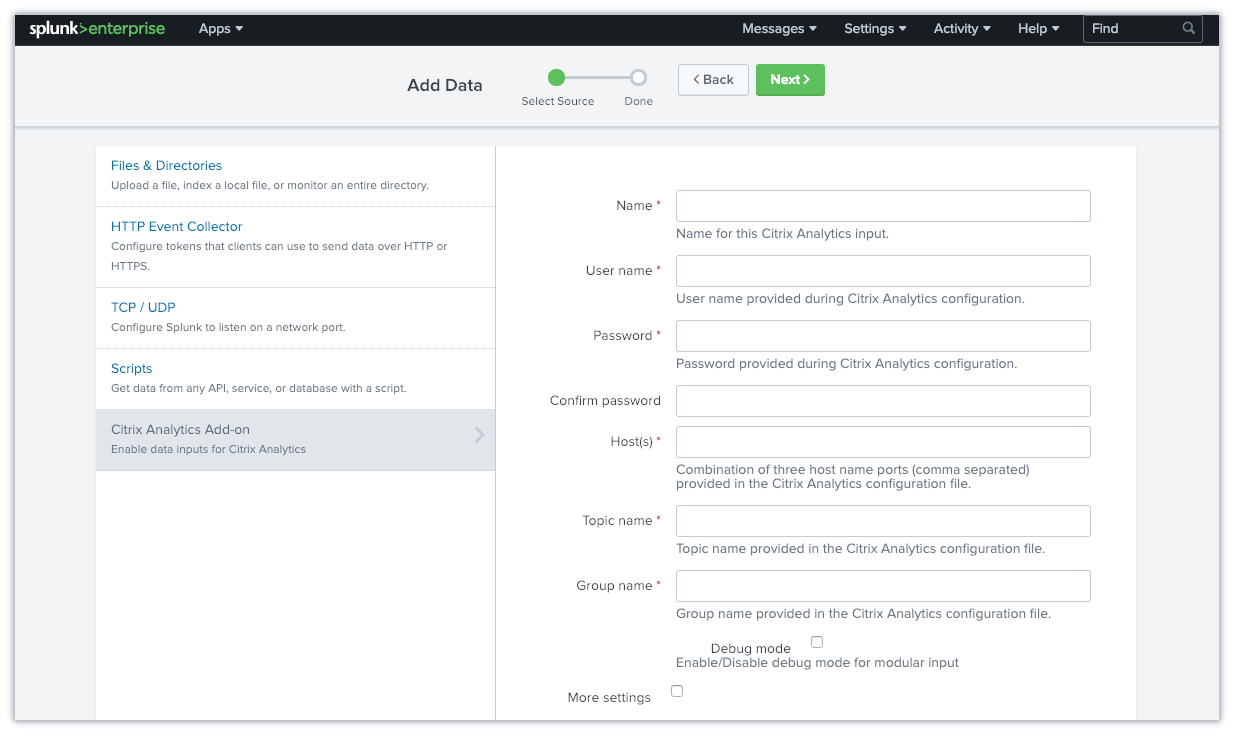
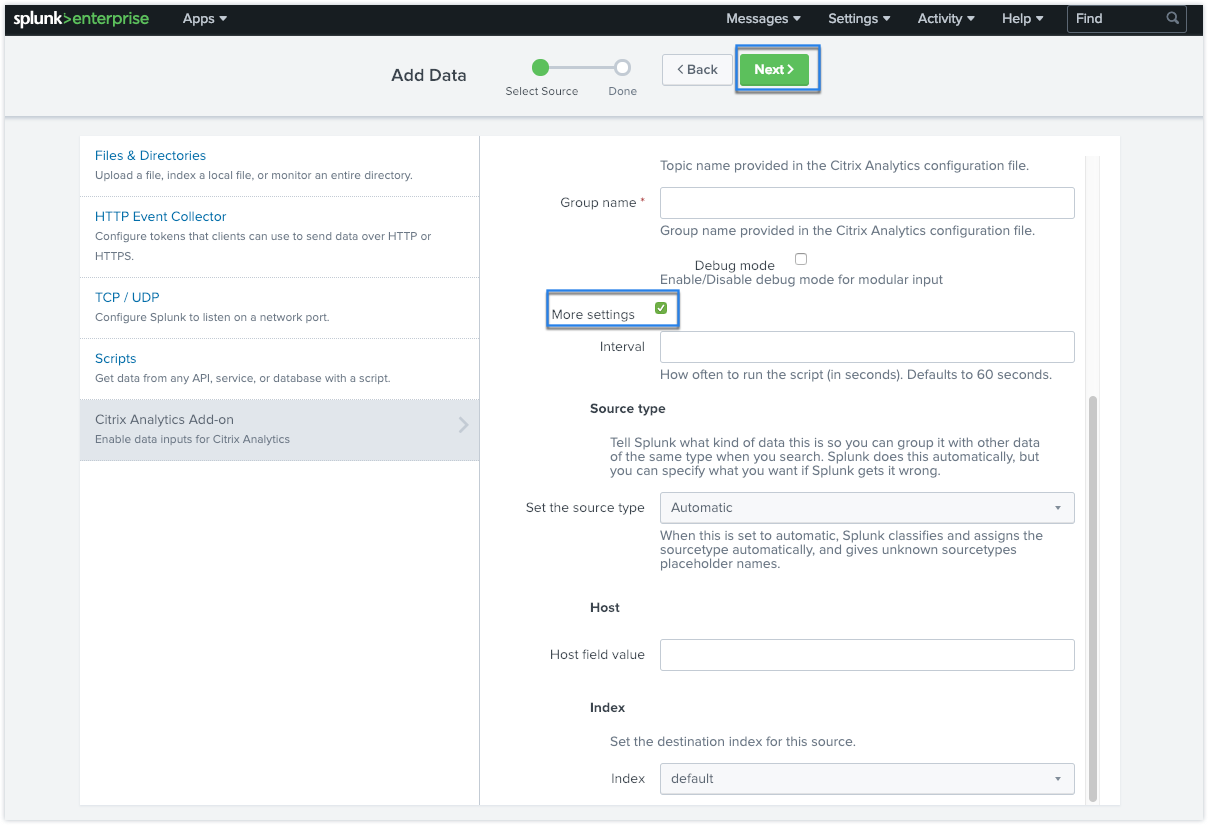
On the Add Data page, enter the details provided in the Citrix Analytics configuration file.
-
To customize your default settings, click More settings and set up the data input. You can define your own Splunk index, host name, and source type.
-
Click Next. Your Citrix Analytics data input is created and Citrix Analytics Add-on for Splunk is configured successfully.
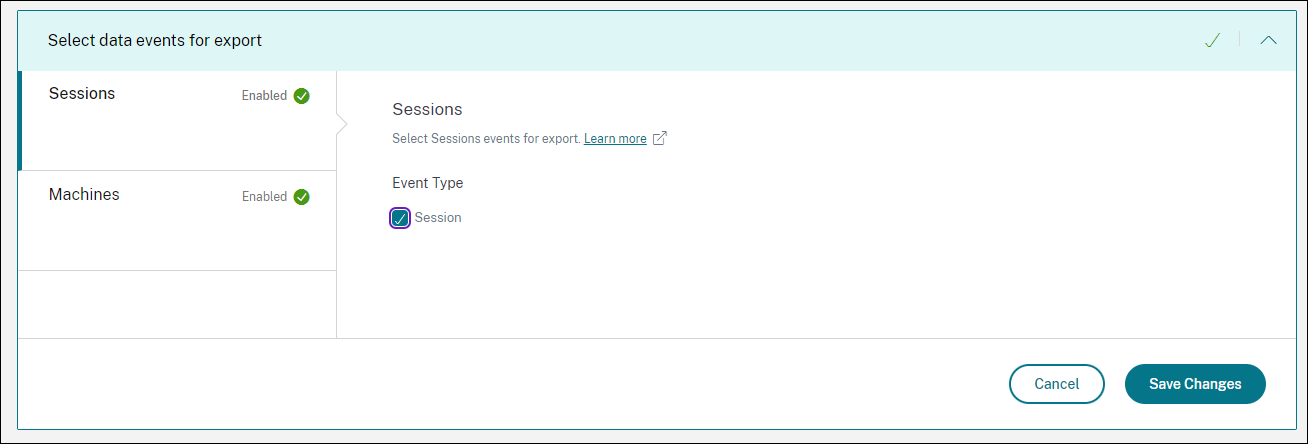
Select data events for Export
This section lists data that is exported to the Observability platform. You can select the events you want to export from the Sessions and Machines data sources. The changes made to this selection takes up to two hours to be available in the exported data.
How to consume events in Splunk
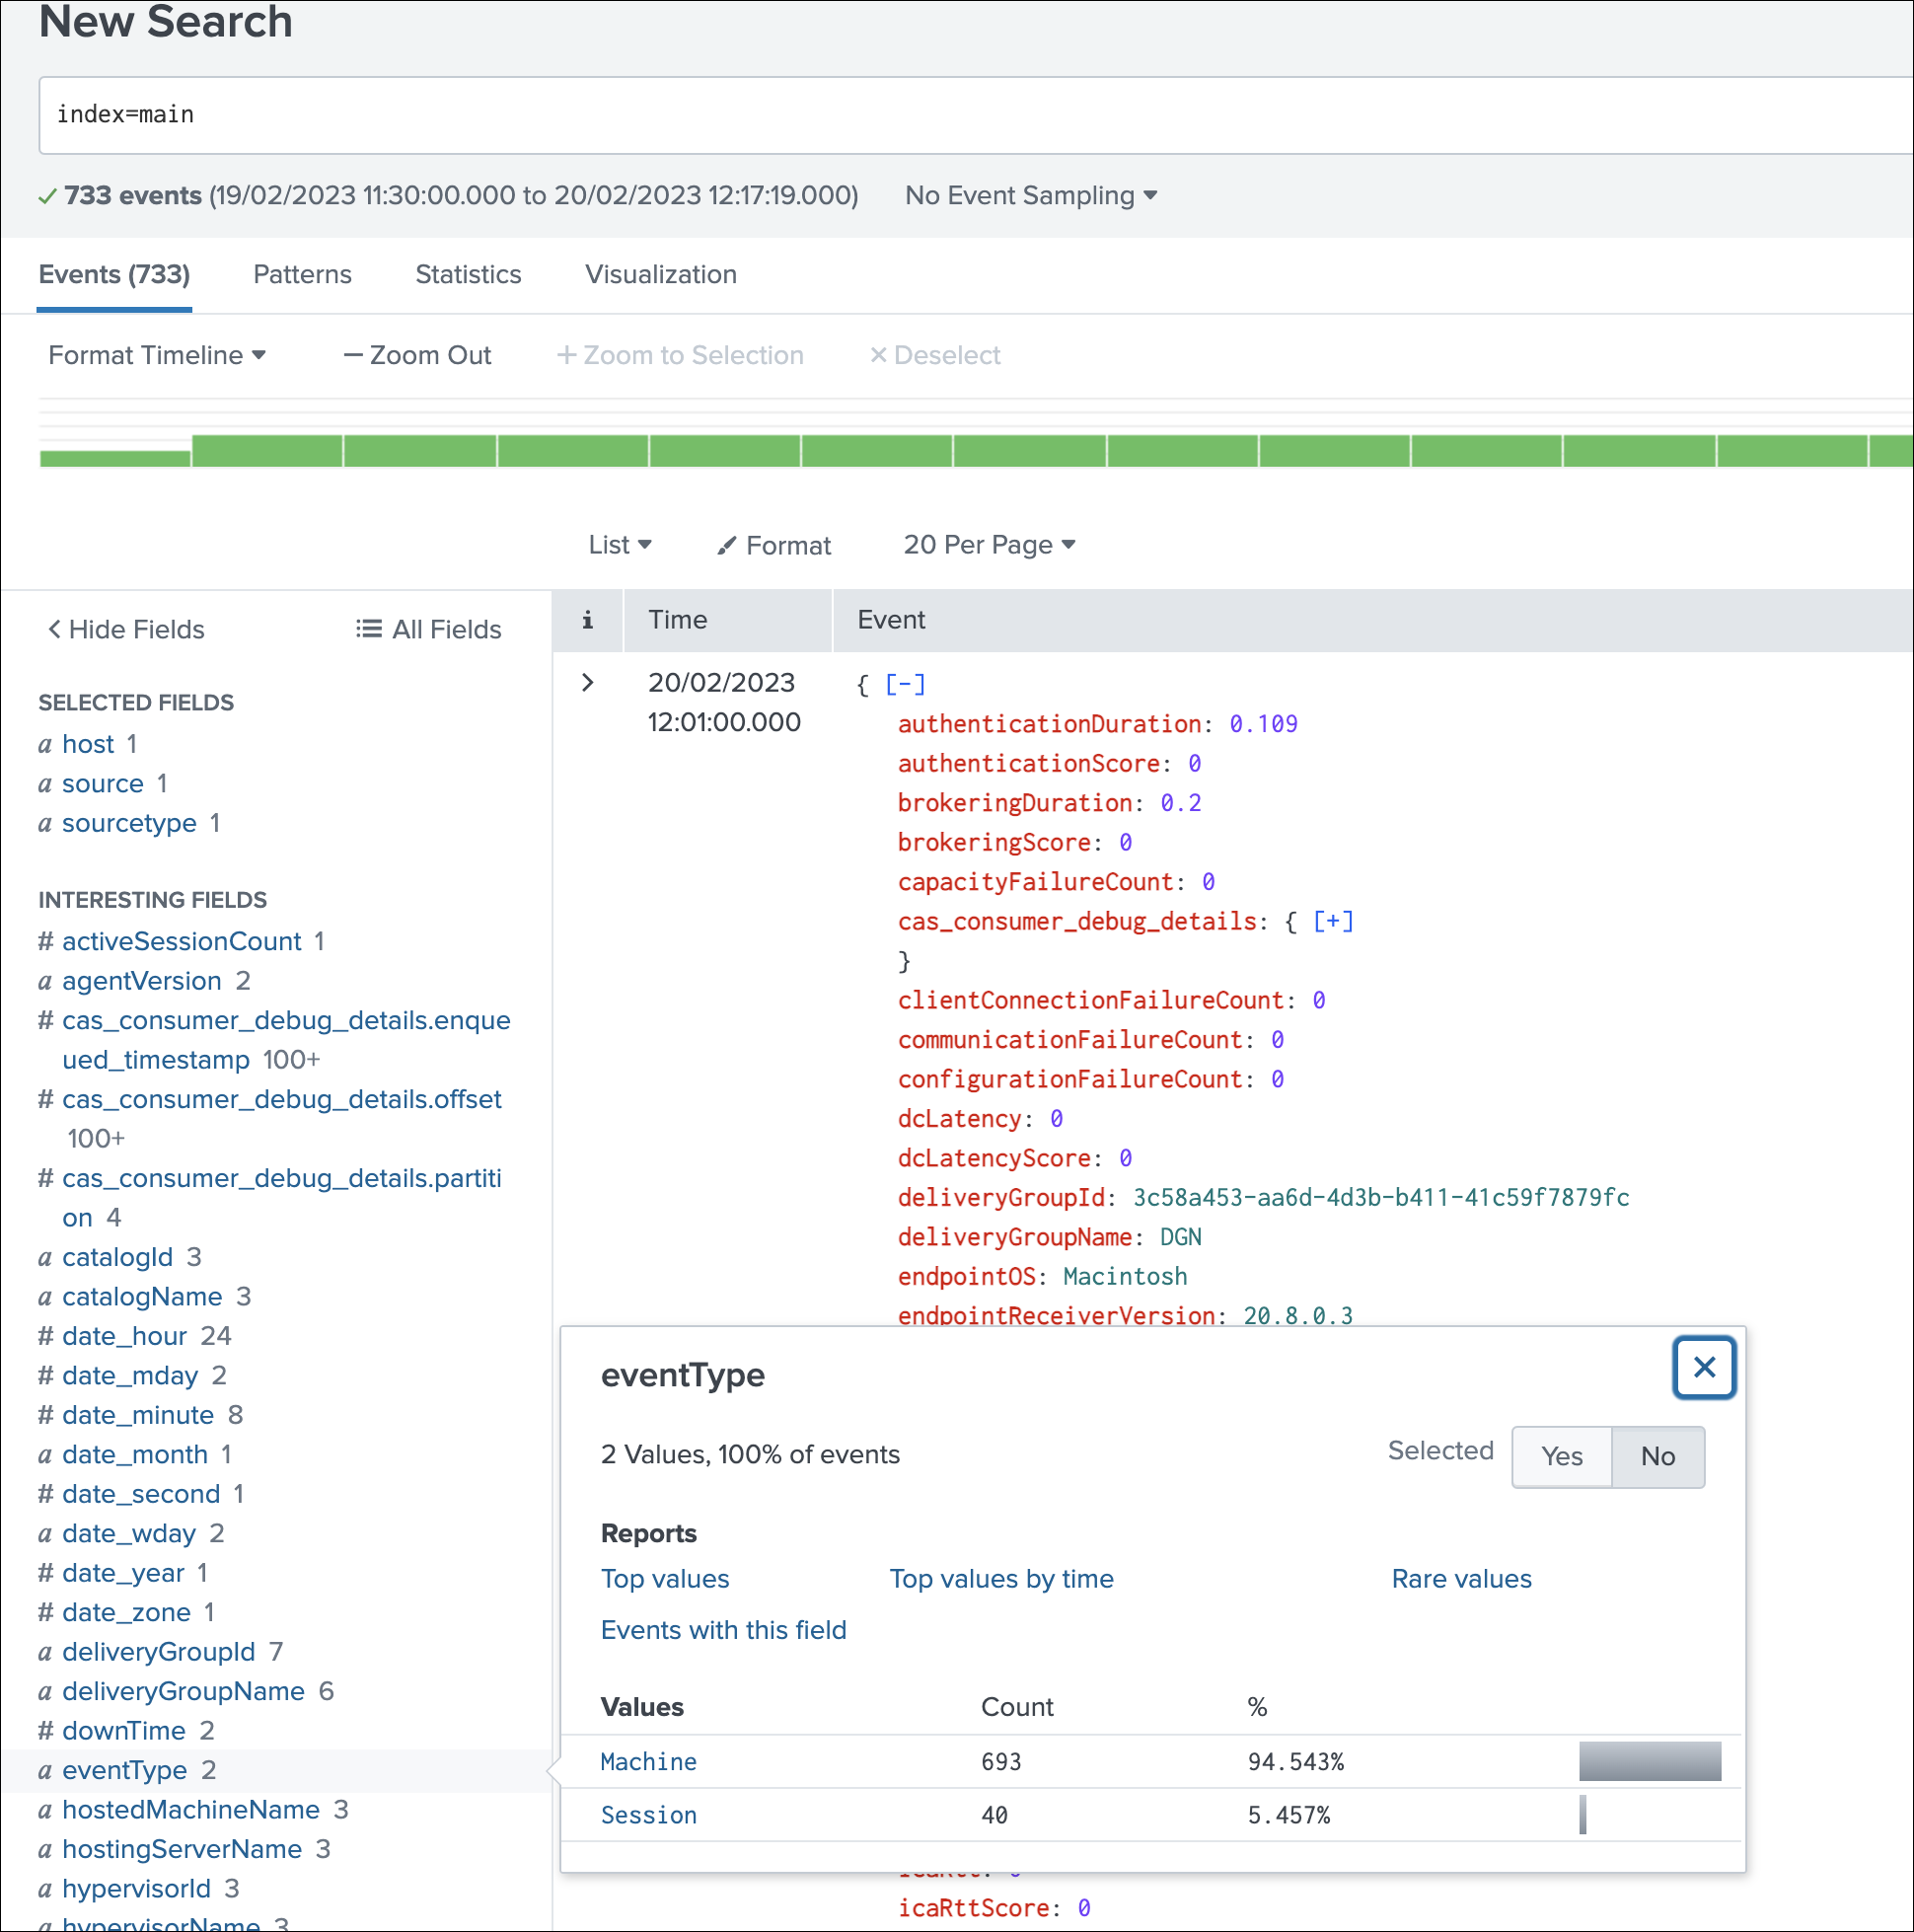
After you configure the add-on, Splunk starts retrieving performance data and events from Citrix Analytics for Performance. You can start searching your organization’s events on the Splunk search head based on the configured data input.
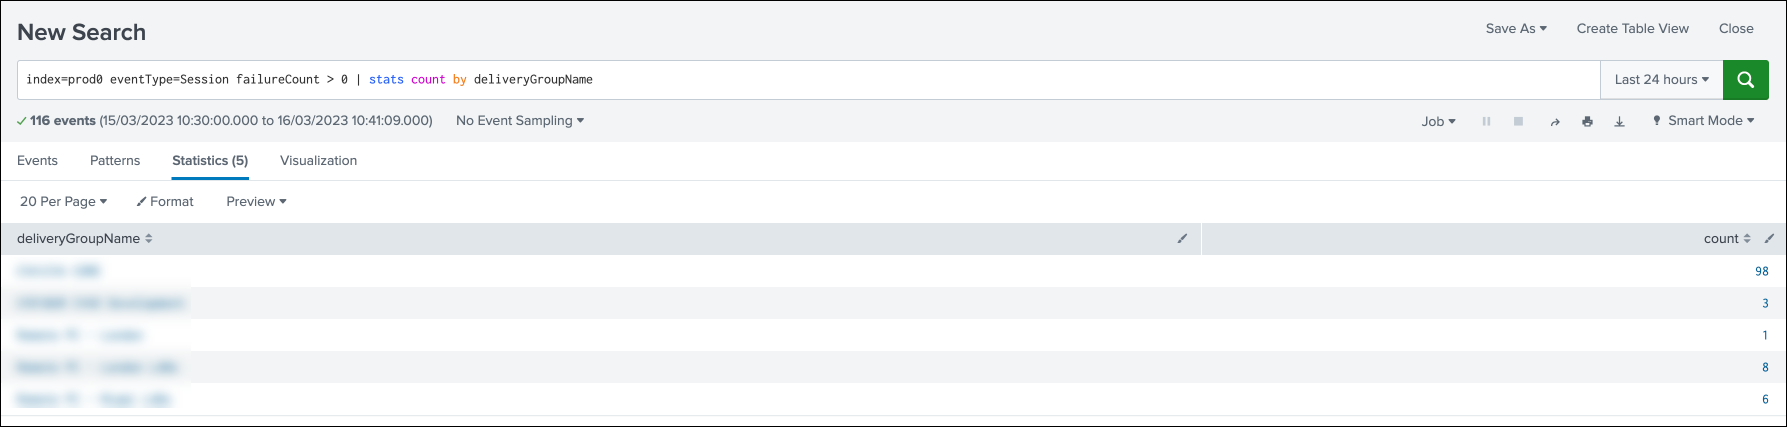
The search results are displayed in the following format:
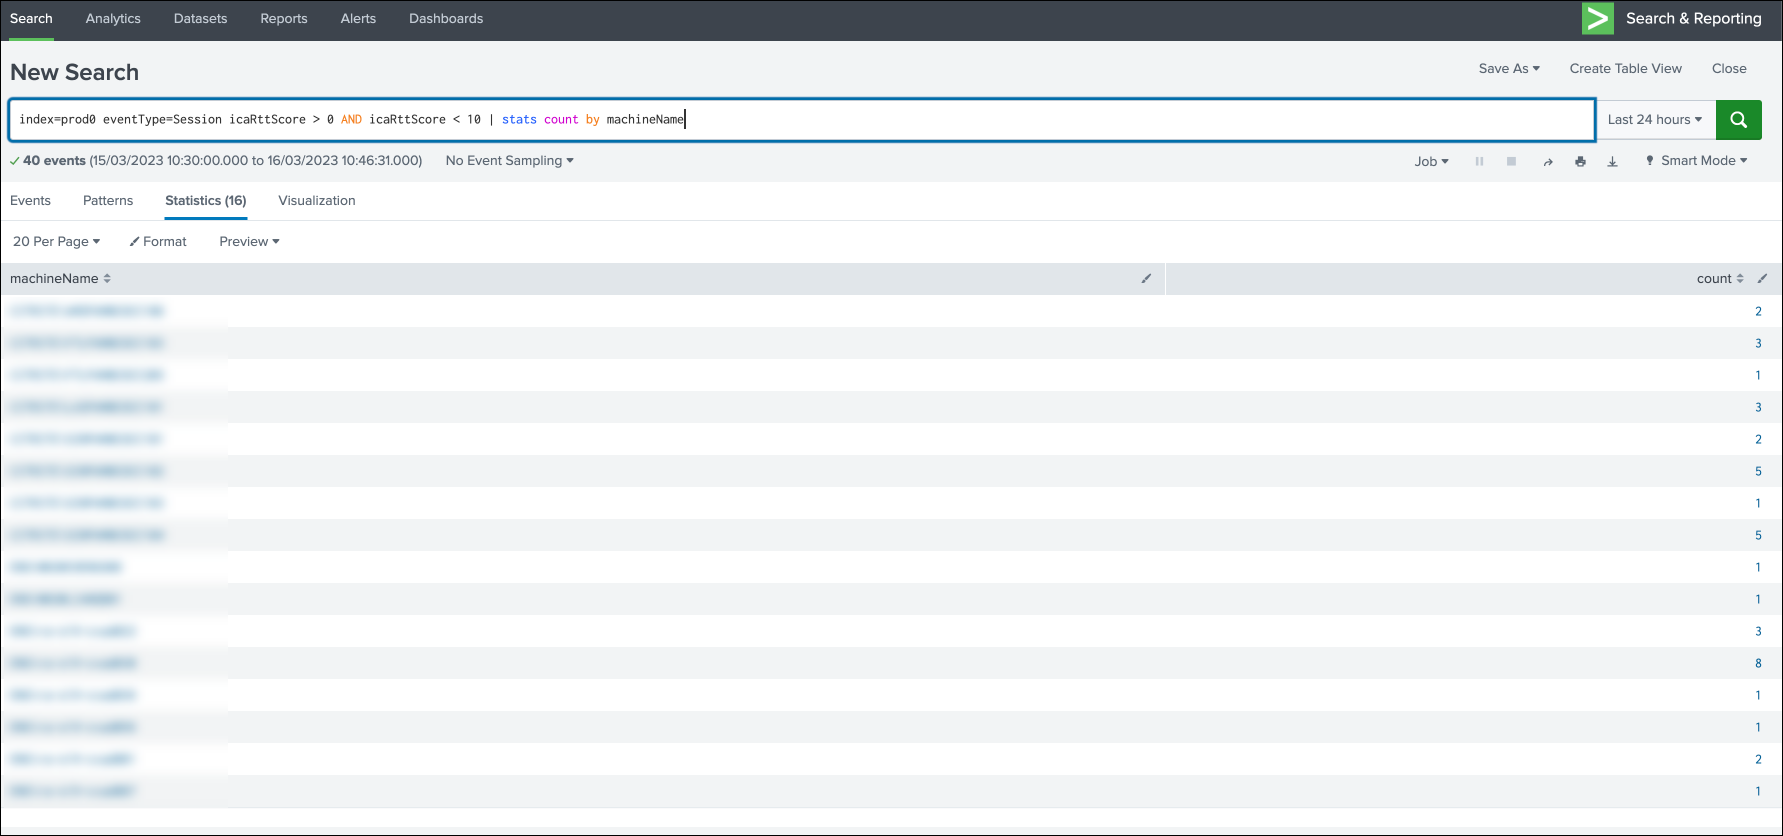
A sample displaying the list of machines running sessions with poor session responsiveness:
A sample displaying the failed sessions:
For more information about the data format, see Data Structure of the Machines Events and Data Structure of the Sessions Events.
For more information about Splunk integration, refer to the following links:
Troubleshoot Citrix Analytics Add-on for Splunk
If you don’t see any data in your Splunk dashboards or encountered issues while configuring Citrix Analytics Add-on for Splunk, perform the debugging steps to fix the issue. For more information, see Configuration issues with Citrix Analytics add-on for Splunk.
Note
Contact CAS-PM-Ext@cloud.com to request assistance for the Splunk integration, exporting data to Splunk, or to provide feedback.