User Experience (UX) Factors
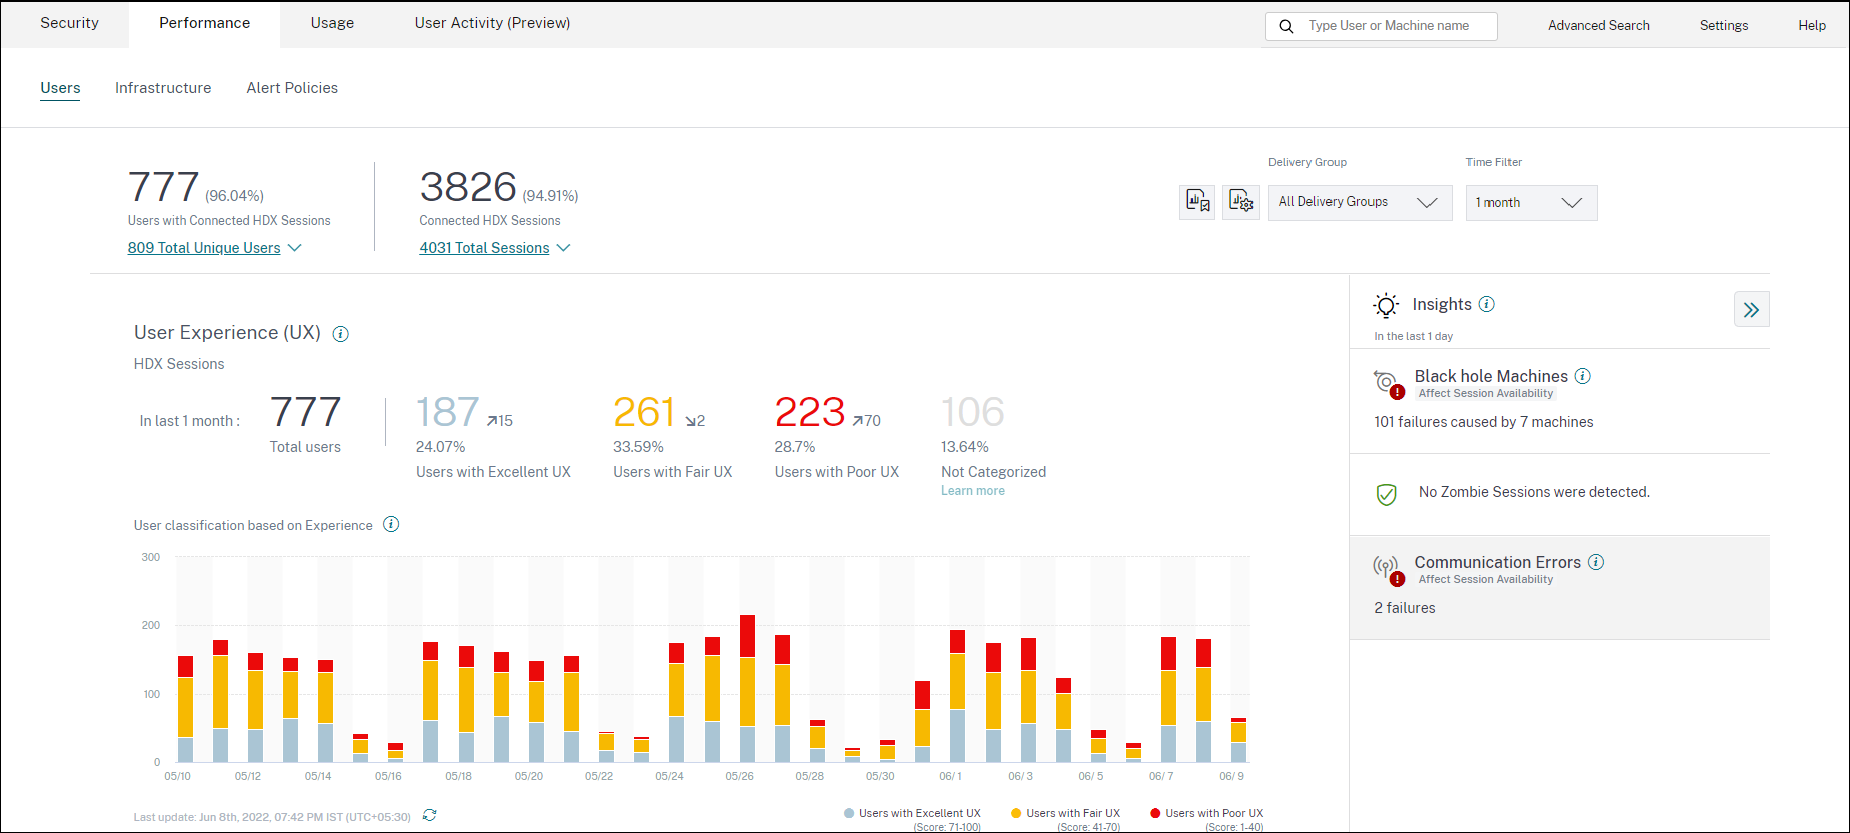
The UX Factors page provides an insight into the factor and subfactor level experience of the set of users you select on the UX dashboard.
Click any of the Excellent, Fair, or Poor UX category on the UX dashboard to open the UX Factors page. It quantifies the effect of factor and subfactor metrics on the user experience. This page classifies the selected set of users based on their experience concerning the factors - Session Availability, Session Responsiveness, Session Resiliency, and Session Logon Duration. Further, the selected users are also classified based on their experience concerning the subfactors within these factors. This drilldown enables you to identify the actual subfactor responsible for the poor experience of users in your environment.
How to use the User Experience (UX) Factors page?
To drill deeper into the factor metrics affecting the user experience, click the number in any of the Excellent, Fair, or Poor category on the UX dashboard.
-
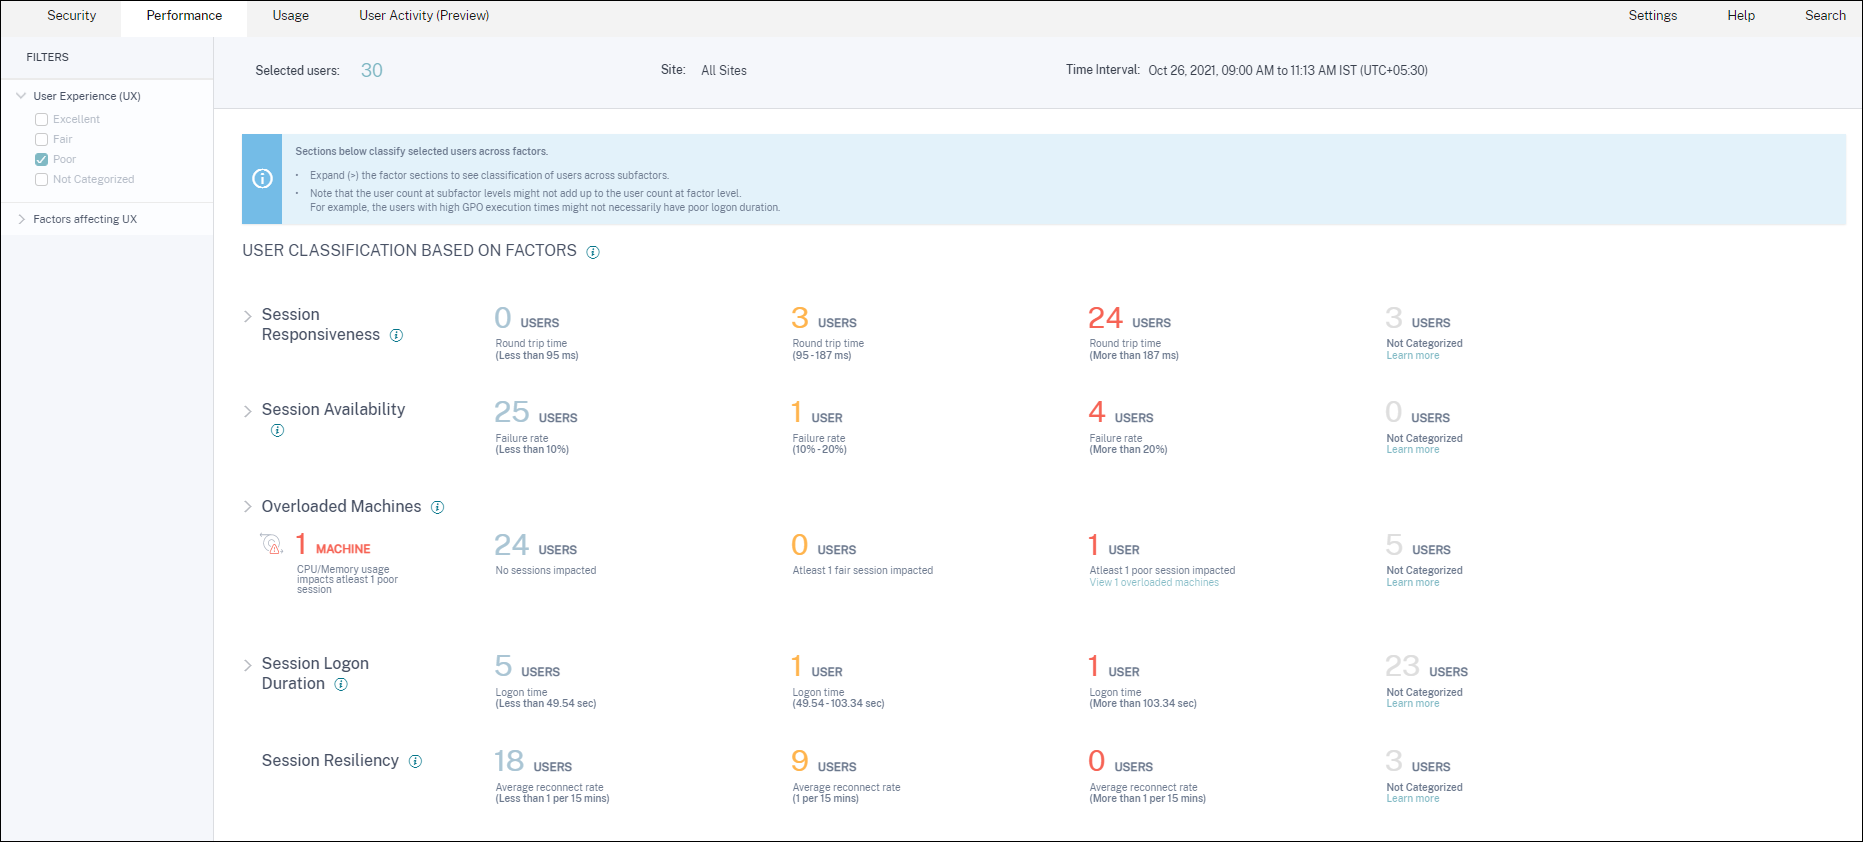
Consider the scenario, where the environment has 21 users having an excellent experience, 39 having a fair experience and 30 users having a poor experience during the last two hours. To understand the reason for the 30 users facing a poor user experience, click the number 30 from the User Experience dashboard.
-
The User Experience (UX) factors screen shows a drilldown of the factors affecting the poor experience of users in all the Sites during the last two hours.
-
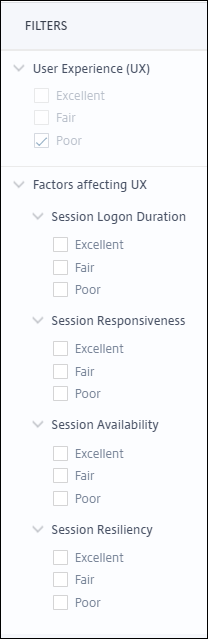
The left panel displays the selection filters for the User Experience and the factors.
Click the Selected users number to access the self-Service Search page for the specific set of users.
-
The sections on the UX factors page classify the selected set of users further based on the factors Session Availability, Session Responsiveness, Session Resiliency, Session Logon Duration, and Overloaded Machines. Expand (click >) each factor section to see the user classification based on experience across the respective subfactors. The factors are sorted based on the number of users with poor factor experience.
-
The overall user experience classification might not match with the user count at the factor level. And, a poor experience across one or more factors might not necessarily mean an overall poor user experience.
-
Similarly, the user count at individual subfactor levels might not add up to the user count at the factor level. For example a user with high GPOs might not necessarily have a poor logon experience as the user’s experience with other subfactors might have been excellent.
-
The classification of users at factor and subfactor levels helps identify and troubleshoot the precise cause of poor overall user experience.
-
For information about users that are Not Categorized, see the Not Categorized Metrics article.
Session Logon Duration
Session Logon Duration is the time taken to launch a session. It is measured as the period from the time the user connects from the Citrix Workspace app to the time when the app or desktop is ready to use. This section classifies users based on the session logon duration readings. The logon duration thresholds for classification of the experience as Excellent, Fair, or Poor are calculated dynamically. For more information on the Dynamic thresholds for Session Logon Duration, see the Dynamic Thresholds section.
 Clicking the classified user count numbers lead to the Self-Service screen displaying the actual performance factor measurements for the selected set of users.
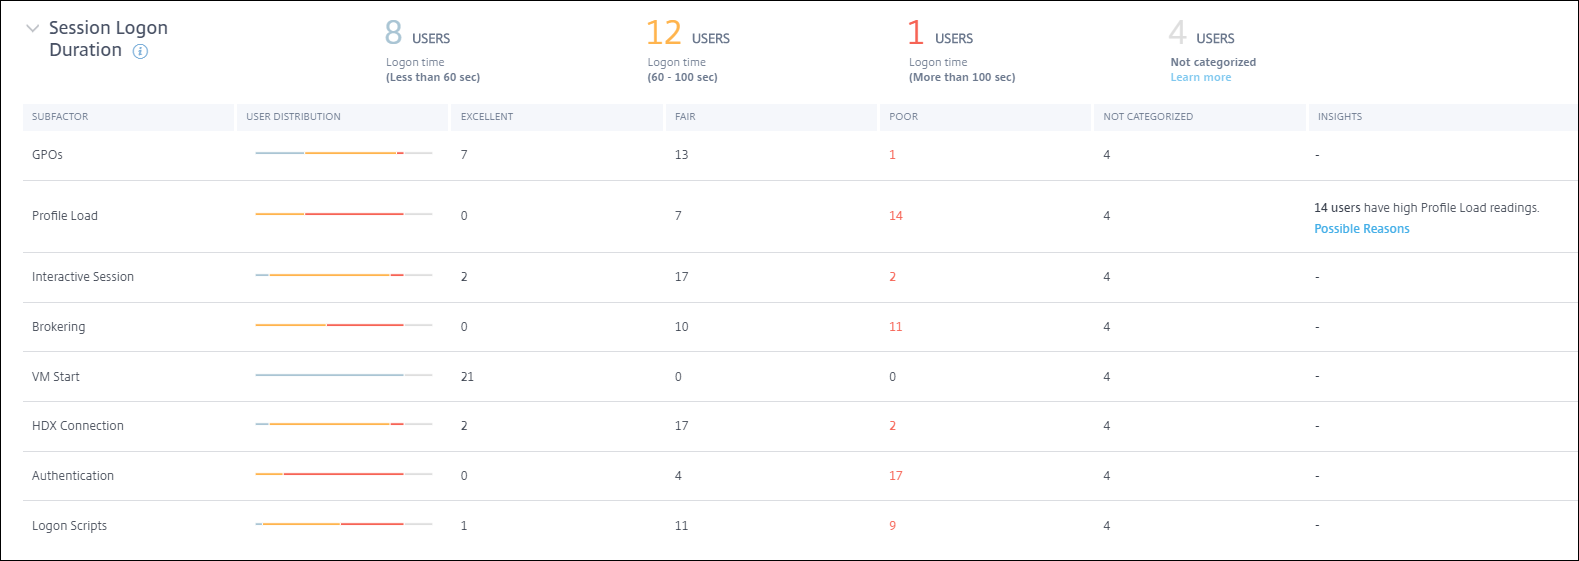
Session Logon Duration is broken down into subfactors that represent individual phases in the complex launch sequence. Each row in the Session Logon Duration drilldown table represents the user categorization for the individual phases occurring during session launch. This helps troubleshoot and identify specific user logon issues.
The user counts for Excellent, Fair, and Poor category related to each subfactor experience are displayed. Use this information to analyze specific subfactor phases that might be contributing to longer logon duration.
For example, if GPOs show the highest number of users facing poor experiences, review the GPO policies applicable for these users to help improve logon duration experience.
The last Not Categorized column displays the number of users for whom specific subfactor measurements are not available for the selected time period. Specific reasons are elaborated with individual subfactor descriptions.
GPOs
GPOs is the time taken to apply group policy objects during logon. GPOs’ measurement is available only if the Group Policy settings are configured and enabled on the virtual machines.
GPOs Insights displays client-side extensions in the environment taking the longest processing time during the selected time period. To see the insights, click the View the contributors link in the Insights column of GPOs in the Session Logon Duration subfactor table. GPO Insights are based on the analysis of user sessions having poor experience in GPO execution.
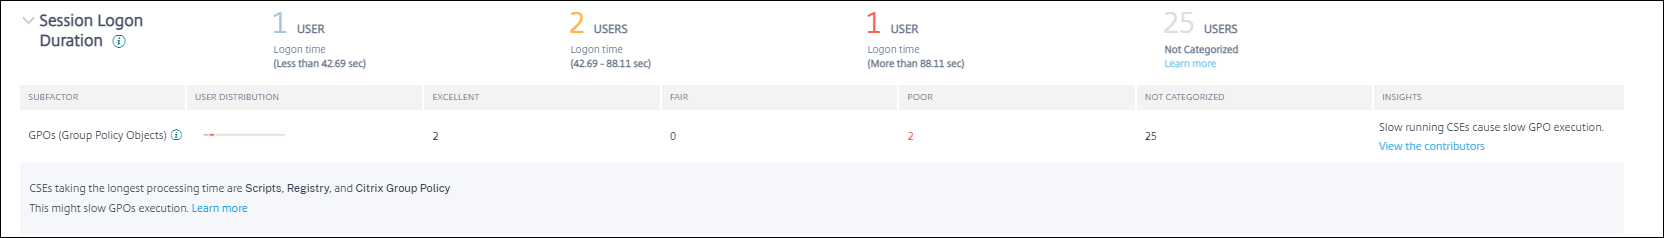
A client-side extension (CSE) is a dynamic-link library (DLL) that implements the Group Policy on the client machine. CSEs with long processing time increase GPO execution times and optimizing CSE processing improve the overall session logon experience of the user.
Average CSE execution time depends on the number and type of policies applied with it. Use the following pointers to improve the processing time of CSEs.
-
Folder Redirection: CSE execution time depends on the number of folders redirected and the contents of each folder. The system can have a wait configured that gets applied after every folder redirection. Optimize the number of folders, to achieve lower CSE execution time.
-
Drive Mapping: Logon scripts can try to map drives to non-existent target servers resulting in a higher execution time. Make sure the server addresses are correct and available.
Review and tune policies associated with CSEs taking the longest processing time as indicated in the GPO insights. Further, consider deleting the ones that are not required.
Profile Load
Profile load is one of the most critical phases of logon duration. It is the time it takes to load a user’s profile, which includes the registry hive (NTUser.dat) and the user files. Optimizing the profile load time can help improve the overall logon duration experience.
Profile load measurement is available only if profile settings are configured for the user on the virtual machine.
The Insights column in the Profile Load displays insights into profile size being the contributing factor to long profile load times. It identifies users who are likely to be affected by a large profile size.
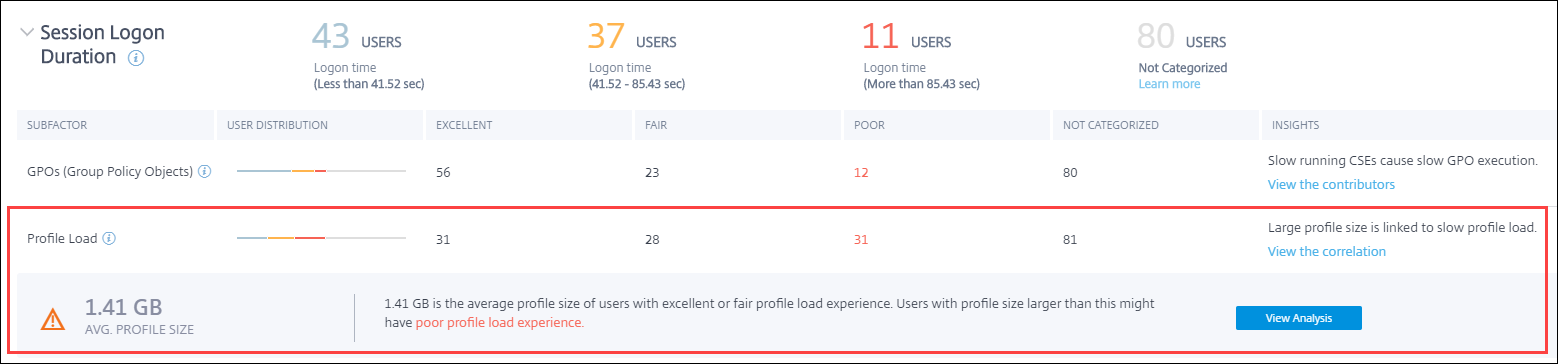
Click the View the correlation link to see the average profile size of users. The average profile size is calculated using the profile sizes of users who have had excellent and fair profile load experience during the last 30 days. This profile size is identified as optimum. Users having a profile size larger than the average are likely to have poor profile load times.
Click View analysis to see the list of users whose profile size is larger than the average. This view shows the last known and average profile size for each user. Use facets to further filter this data to view users with both large profile size and poor logon duration experience.
Expand the user details to view specific performance metrics to further troubleshoot the reason for poor experience.
Use these insights to recommend users to reduce large files in their profile.
Insights are not displayed if the profile size measurements or the average profile size are not available.
-
Profile size measurement requires Citrix Profile Management to be installed on the machines.
-
Profile size measurement is supported on machine versions 1912 and later.
-
Profile size measurements of users with fair and excellent profile load experience over the past 30 days are used to calculate the average profile size. The insights are not derived if no data points are available for this duration.
-
Profile load insights are derived in cases where profile size is the cause for slow profile load. The presence of several profile files in the profile might also result in slow profile load.
Interactive Session
The time taken to “hand off” keyboard and mouse control to the user after the user profile has been loaded. It is normally the longest duration of all the phases of the logon process.
Brokering
The time taken to decide which desktop to assign to the user.
VM Start
If the session required a machine start, it is the time taken to start the virtual machine. This measurement is not available for non-power managed machines.
HDX™ connection
The time taken to complete the steps required in setting up the HDX connection from the endpoint to the virtual machine.
Authentication
The time taken to complete authentication to the remote session.
Logon scripts
It is the time taken for the logon scripts to run. This measurement is available only if logon scripts are configured for the session.
Session Responsiveness
Once a session is established, the Session Responsiveness factor measures the screen lag that a user experiences while interacting with an app or desktop. Session Responsiveness is measured using the ICA® Round Trip Time (ICA RTT) that represents the time elapsed from when the user pushes down a key until the graphical response is displayed back.
ICA RTT is measured as the sum of traffic delays in the server and endpoint machine networks, and the time taken to launch an application. ICA RTT is an important metric that gives an overview of the actual user experience.
The Session Responsiveness thresholds for classification of the experience as Excellent, Fair, or Poor are calculated dynamically. For more information on the Dynamic thresholds for Session Responsiveness, see the Dynamic Thresholds section.
The Session Responsiveness Drilldown represents the classification of users based on the ICA RTT readings of the sessions. Clicking these numbers drills down to the metrics for that category. The users with excellent Session Responsiveness had highly reactive sessions while the users with poor Session Responsiveness faced lag in their sessions.
Note:
While the ICA RTT readings are obtained from the Apps and Desktops, the subfactor measurements are obtained from the on-premises Citrix Gateway. Hence, the subfactor values are available only when the user is connecting to an app or a desktop via a configured on-premises Citrix Gateway. For steps to configure Citrix Gateway with Citrix Analytics for Performance, see Gateway data source. In addition, you must configure L7 latency thresholding. For more information, see L7 Latency Thresholding.
Further, these measurements are available for sessions,
- launched from machines enabled for NSAP
- new CGP (Common Gateway Protocol) sessions, and not reconnected sessions.
These measurements are not available when the user is connected via Citrix Gateway Service.
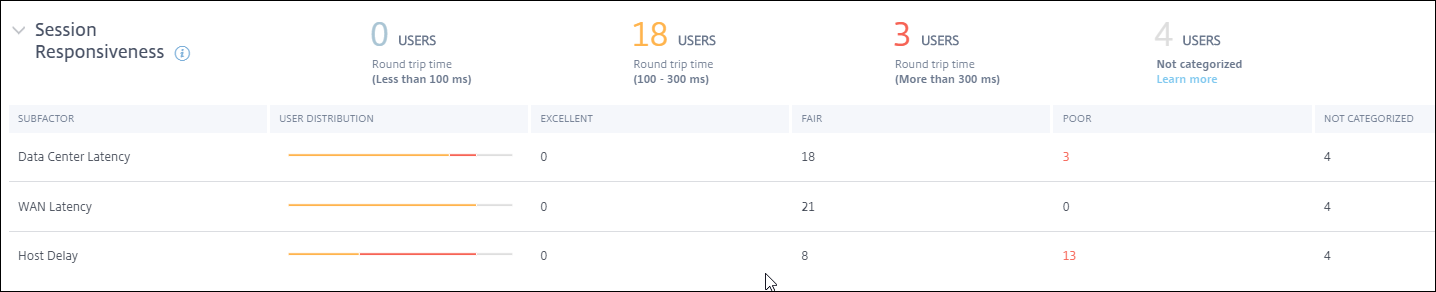
The rows in the Session Responsiveness drilldown table represent the user categorization in the subfactor measurements. For each subfactor, the number of users in each category is displayed in the Excellent, Fair, and Poor columns. This information helps analyze the specific subfactor that is contributing to poor user experience.
For example, the highest number of Poor Users recorded for Data Center Latency indicates an issue with the server-side network.
The last Not Categorized column displays the number of users for whom the specific subfactor measurement was not available during the selected time period.
The following subfactors contribute to the Session Responsiveness. However, the total ICA RTT is not a sum of the subfactor metrics, as the subfactors of ICA RTT that occur until Layer 4 only are measurable.
-
Data Center Latency: This subfactor is the latency measured from the Citrix Gateway to the server. A high Data Center Latency indicates delays due to a slow server network.
-
WAN Latency: This subfactor is the latency measured from the virtual machine to the Gateway. A high WAN Latency indicates sluggishness in the endpoint machine network. WAN latency increases when the user is geographically farther from the Gateway.
-
Host Latency: This subfactor measures the Server OS induced delay. A high ICA RTT with low Data Center and WAN latencies, and a high Host Latency indicates an application error on the host server.
A high number of users facing poor experience in any of the subfactors helps understand where the issue lies. You can further troubleshoot the issue using Layer 4 delay measurements. None of these latency metrics account for packet loss, out of order packets, duplicate acknowledgments, or retransmissions. Latency might increase in these cases.
For more information on the calculation of ICA RTT, see How ICA RTT is calculated on NetScaler Insight. For more information about onboarding Citrix Gateway, see Gateway data source.
Session Availability
Session Availability is calculated based on the failure rate. It is the rate of failed session connections with respect to the total number of attempted session connections.
The Session Availability experience is categorized based on the session failure rate as follows:
Excellent: Failure rate is less than 10%. An excellent Session Availability factor indicates the users being able to successfully connect to and use the app or desktop.
Fair: Failure rate is 10–20%.
Poor: Failure rate is more than 20%. Many users with poor Session Availability experience indicate inability to connect and use sessions.
Since failure to launch sessions disrupts user productivity, it is an important factor in quantifying the overall user experience.
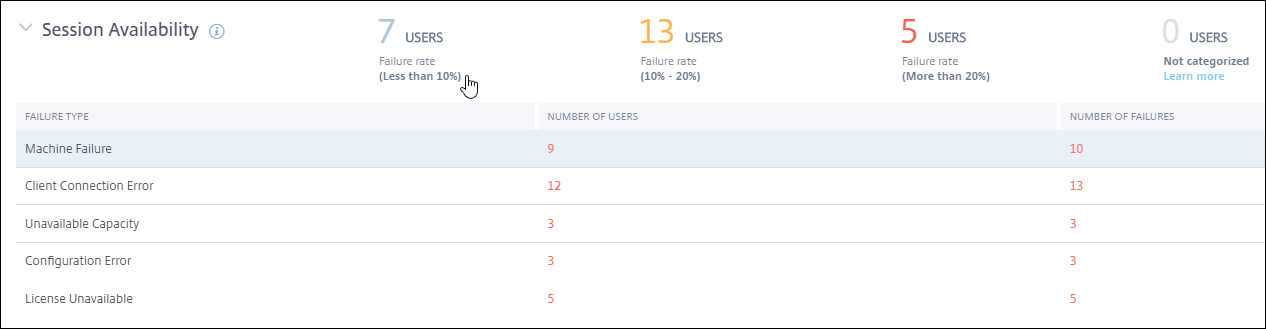
The rows in the Session Reliability drilldown table display the failure types categorized with the number of users and the number of failures in each category. Use the listed Failure types to further troubleshoot the failures.
For more information about the possible reasons within an identified failure type, see the Citrix Director failure reasons and troubleshooting. document.
Session Resiliency
Session Resiliency indicates the number of times the Citrix Workspace™ app auto reconnected to recover from network disruptions. Auto reconnect keeps sessions active when network connectivity is interrupted. Users continue to see the application they are using until network connectivity resumes. An excellent Session Resiliency factor indicates a smooth user experience and lesser number of reconnects due to network disruptions.
Auto reconnect is enabled when the Session Reliability or the Auto Client Reconnect policies are in effect. When there is a network interruption on the endpoint, the following Auto reconnect policies come into effect:
- Session Reliability policy comes into effect (by default in 3 minutes) where the Citrix Workspace app tries to connect to the machine.
- Auto Client Reconnect policy comes into effect between 3 and 5 minutes where the endpoint tries to connect to the machine.
For each user, the number of auto reconnects are measured during every 15 min interval across the selected time period. Based on the number of auto reconnects in most of the 15 min intervals, the experience is classified as Excellent, Fair, or Poor.
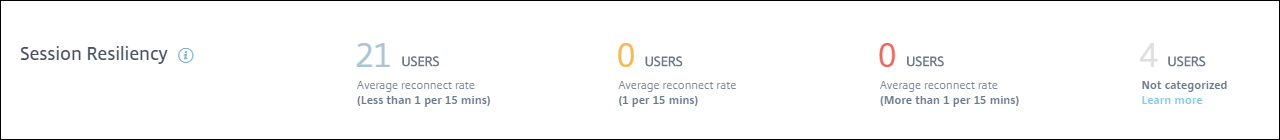
The Session Resiliency experience is categorized based on the reconnect rate as follows:
Excellent: In most of the 15 min intervals in the chosen time period, there were no reconnects.
Fair: In most of the 15 min intervals in the chosen time period, there was one reconnect.
Poor: In most of the 15 min intervals in the chosen time period, there were more than 1 reconnects.
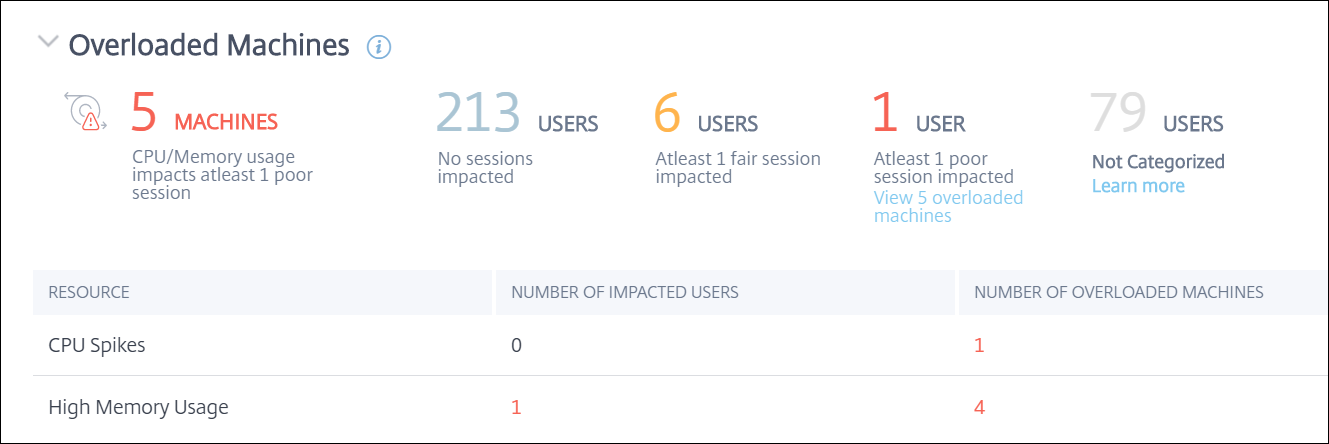
Overloaded Machines
Overloaded resources can cause high latency, high logon duration, and failures resulting in poor user experience. The Overloaded Machines factor gives visibility on overloaded resources causing poor experience.
Machines that have experienced sustained CPU spikes, or high memory usage, or both, that have lasted for 5 minutes or more, resulting in a poor user experience in the selected duration are considered to be overloaded.
Note:
The Overloaded Machines factor section is available only for the 2 hours, 12 hours and 1 day ranges. The feature is disabled for 1 week and 1 month time periods for optimization.
The Overloaded Machines section has the following data:
- The number of machines in which CPU or memory usage has impacted at least one poor session independent of the user experience.
- The number of users affected due to the impact of overloaded CPU or memory on the session experience.
- Excellent – users with no sessions impacted by overloaded machines.
- Fair – users with at least one fair session impacted by overloaded machines.
- Poor – users with at least one poor session impacted by overloaded machines.
- Not categorized – users whose session experience cannot be correlated with resource overload.
- Breakup of:
- the number of machines affecting users with poor experience due to overloaded resource.
- the number of users with poor experience impacted by CPU Spikes and High memory usage.
- Clicking the number of overloaded users leads to the Users self-service view filtered to show users whose sessions are affected by the overloaded resources.
- Clicking the number of overloaded machines leads to the Machines self-service view filtered to show the chosen set of overloaded machines - based on classification, or based on the overloaded resource, CPU, or machine.
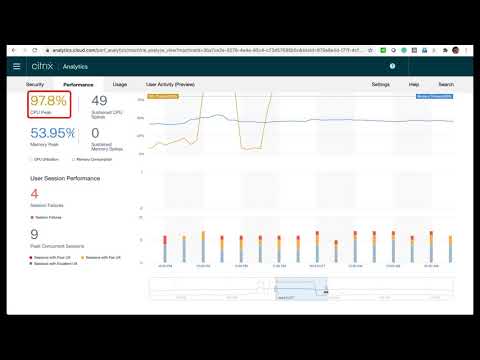
The following video shows a typical troubleshooting scenario using the Overloaded Machines factor.
The Machines, Users, and Sessions self-service views are enhanced with the Overloaded Machines facet. The Machines self-service view additionally has the Overloaded CPU/Memory facet to help troubleshoot overload issues in machines. For more information, see Overloaded Machines in the Self-service article.
Further drilldown from the Machines self-service view to see specific machine statistics to troubleshoot the resource overload issues.