Elasticsearch integration
Note
Contact CAS-PM-Ext@cloud.com to request assistance for the Elasticsearch integration, exporting data to Elasticsearch, or provide feedback.
Integrate Citrix Analytics for Security with Elasticsearch by using the Logstash engine. This integration enables you to export and correlate the users’ data from your Citrix IT environment to Elasticsearch and get deeper insights into your organization’s security posture. You can also use Elasticsearch with the visualization services and SIEMs like Kibana and LogRhythm respectively.
For more information about the benefits of the integration and the type of processed data that is sent to your SIEM, see Security Information and Event Management integration.
Prerequisites
-
Turn on data processing for at least one data source. It helps Citrix Analytics for Security™ to begin the Elasticsearch integration process.
-
Ensure that the following endpoint is in the allow list in your network.
Endpoint United States region European Union region Asia Pacific South region Kafka brokers casnb-0.citrix.com:9094casnb-eu-0.citrix.com:9094casnb-aps-0.citrix.com:9094casnb-1.citrix.com:9094casnb-eu-1.citrix.com:9094casnb-aps-1.citrix.com:9094casnb-2.citrix.com:9094casnb-eu-2.citrix.com:9094casnb-aps-2.citrix.com:9094casnb-3.citrix.com:9094
Integrate with Elasticsearch
-
Go to Settings > Data Exports.
-
On the Account set up section, create an account by specifying the user name and a password. This account is used to prepare a configuration file, which is required for integration.
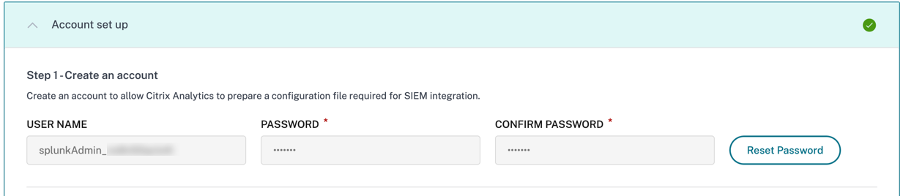
-
Ensure that the password meets the following conditions:
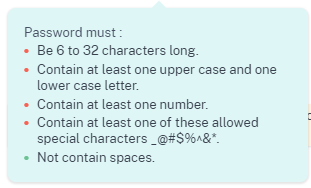
-
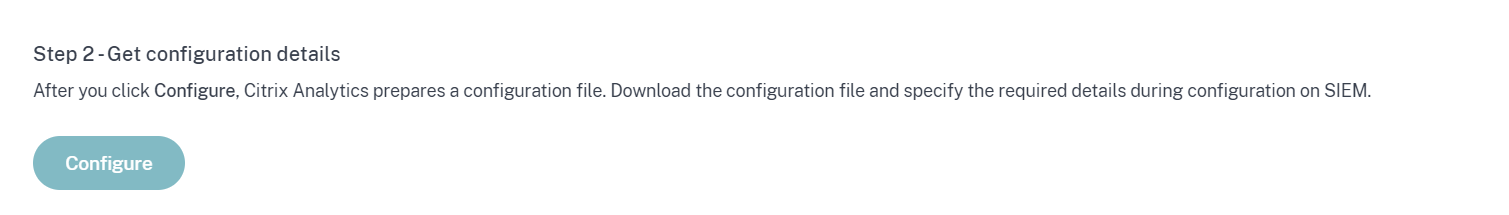
Click Configure to generate the Logstash configuration file.
-
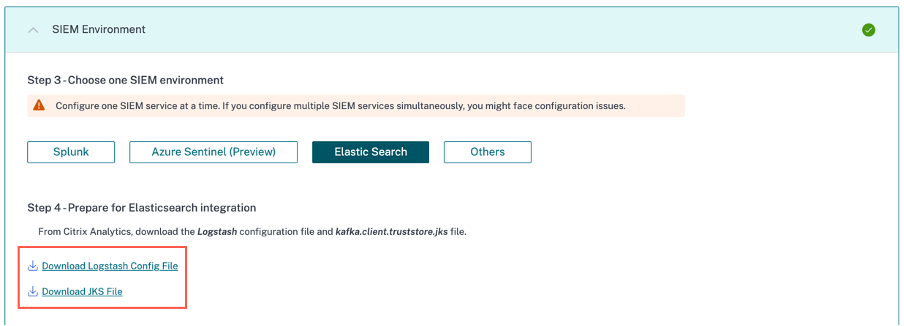
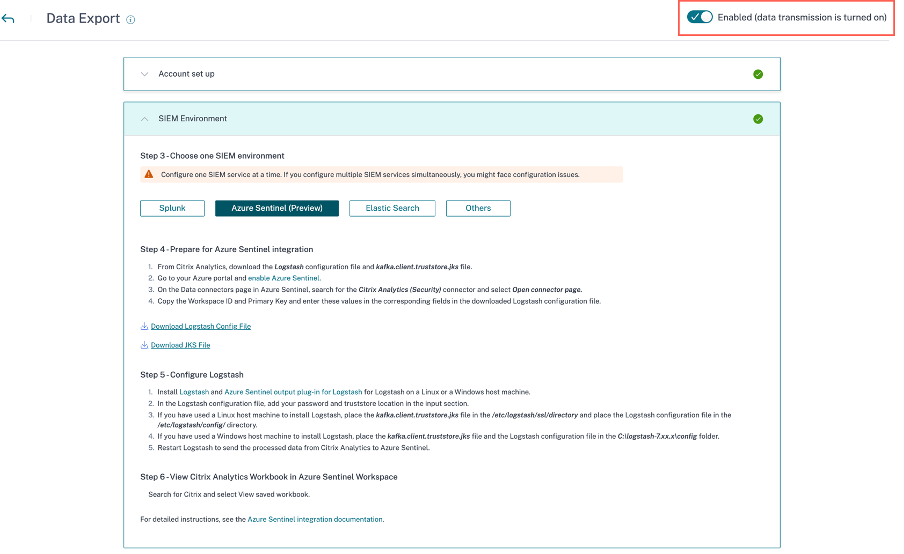
Select the Elastic Search tab from the SIEM Environment section to download the configuration files:
-
Logstash config file: Contains the configuration data (input, filter, and output sections) for sending events from Citrix Analytics for Security to Elasticsearch using the Logstash data collection engine. For information on Logstash config file structure, see the Logstash documentation.
-
JKS file: Contains the certificates required for SSL connection.
Note
These files contain sensitive information. Keep them in a safe and secure location.
-
-
Configure Logstash:
-
On your Linux or Windows host machine, install Logstash. You can also use your existing Logstash instance.
-
On the host machine where you have installed Logstash, place the following files in the specified directory:
Host machine type File name Directory path Linux CAS_Elasticsearch_LogStash_Config.config For Debian and RPM packages: /etc/logstash/conf.d/For .zip and .tar.gz archives: {extract.path}/configkafka.client.truststore.jks For Debian and RPM packages: /etc/logstash/ssl/For .zip and .tar.gz archives: {extract.path}/sslWindows CAS_Elasticsearch_LogStash_Config.config C:\logstash-7.xx.x\configkafka.client.truststore.jks For information on the default directory structure of Logstash installation packages, see Logstash documentation.
-
Open the Logstash config file and do the following:
-
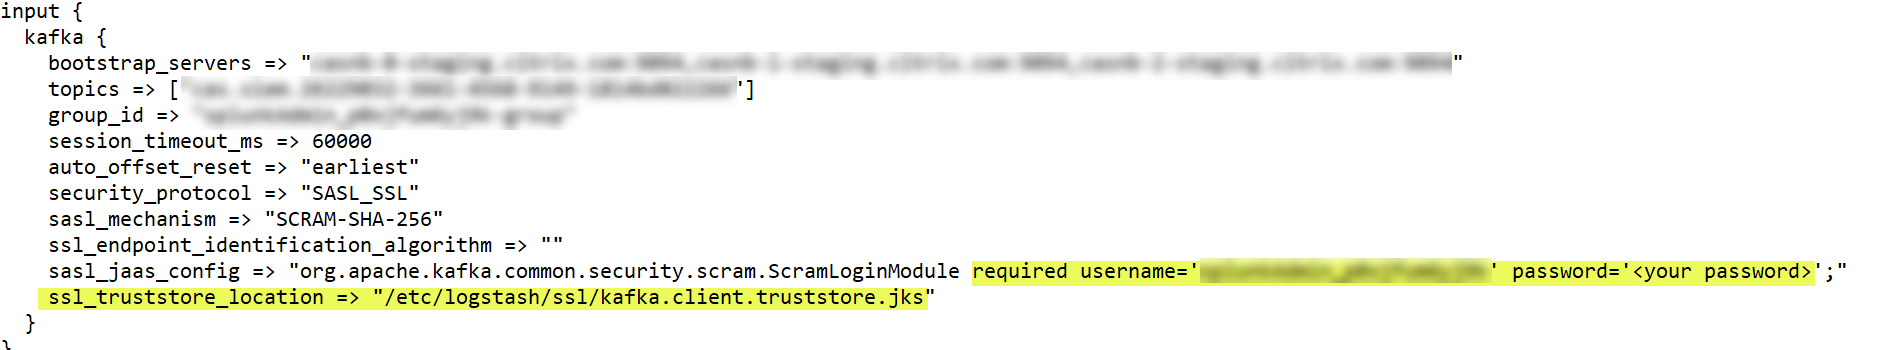
In the input section of the file, enter the following information:
-
Password: The password of the account that you have created in Citrix Analytics for Security to prepare the configuration file.
-
SSL truststore location: The location of your SSL client certificate. This is the location of the kafka.client.truststore.jks file in your host machine.
-
-
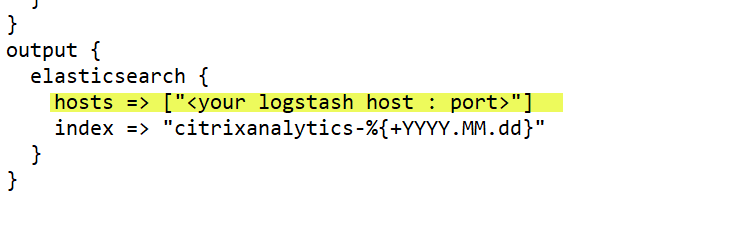
In the output section of the file, enter the address of your host machine or the cluster where Elasticsearch is running.
-
-
Restart your host machine to send processed data from Citrix Analytics for Security to Elasticsearch.
-
After configuration is complete, verify that you can view the Citrix Analytics data in your Elasticsearch.
Turn on or off data transmission
After Citrix Analytics for Security prepares the configuration file, data transmission is turned on for Elasticsearch.
To stop transmitting data from Citrix Analytics for Security:
-
Go to Settings > Data Exports.
-
Turn off the toggle button to disable the data transmission. By default the data transmission always enabled..
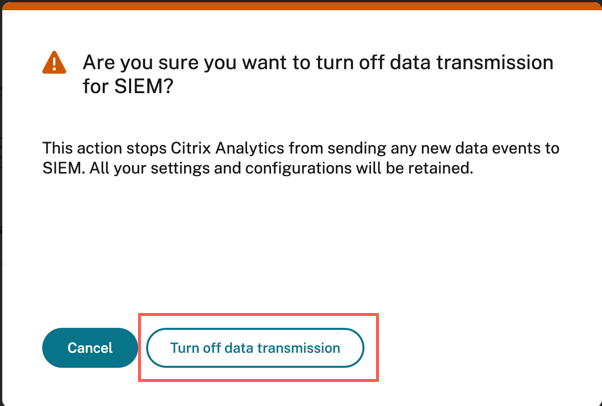
A warning window appears for your confirmation. Click Turn off data transmission button to stop the transmission activity.
To enable data transmission again, turn on the toggle button.