What’s new
This article lists new and enhanced features for Citrix Virtual Apps and Desktops™ 7 2603 LTSR. Updates are organized by component.
Delivery Controller
Support for SQL Server 2025
Citrix Virtual Apps and Desktops now supports SQL Server 2025. For information on other supported SQL Server versions, see Databases.
HDX
HDX Connectivity
Microsoft Entra single sign-on (Preview)
You can now leverage single sign-on (SSO) when using Microsoft Entra ID credentials to access virtual applications and desktops on Microsoft Entra hybrid joined session hosts. For more information, see Microsoft Entra single sign-on.
HDX Direct
You can now increase the HDX Direct timeout for multi-session session hosts to accomodate logons longer than 60 seconds. See the HDX Direct considerations for details.
Virtual channel allow list
The Microsoft Teams and Zoom Meetings for VDI virtual channels no longer need to be added explicitly to the virtual channel allow list. See Considerations for third-party virtual channels for details.
Devices
Enhanced touch keyboard behavior and gesture handling
This enhancement greatly improves reliability in touch-enabled CVAD sessions by preventing application hangs, fixing unresponsive touch input, and ensuring the touch keyboard appears only on intentional single-tap interactions. Compatibility and touch‑drag responsiveness are improved across common apps, including Microsoft Teams, Slack, File Explorer, and Visual Studio Code, even in higher‑latency environments.
Multimedia
Explicit service dependency for HDX Teams Redirection Service
The Citrix HDX Teams Redirection Service (used by HDX Optimized Microsoft Teams & UCSDK Optimized applications) now explicitly declares a dependency on the Citrix HDX HTML5 Video Redirection Service (WebSocketService).
This update ensures that the HTML5 service is automatically verified and started when the Teams service launches, preventing optimization failures for Microsoft Teams and UCSDK-integrated applications in environments where services are strictly managed. For more details, see Explicit service dependency for Microsoft Teams Optimization
Decoupled UCSDK and HDX Microsoft Teams Optimization
Optimization for applications using the Citrix Unified Communications SDK (UCSDK) is no longer dependent on the Microsoft Teams redirection policy. Administrators can now disable optimization for Microsoft Teams without interrupting or disabling optimization for other UCSDK-integrated applications. For more details, see Unified Communications SDK documentation
Support for Microsoft virtual camera with webcam redirection
Starting from 2603, Windows VDA (Windows 11 and Windows Server 2025) upgrades webcam redirection and the camera experience using Microsoft’s built-in virtual camera capabilities. Benefits include extended compatibility with more applications, improved security and privacy, and providing closer to local and native camera experience. This feature is enabled by default.
Note:
This feature requires Camera access enabled in the system setting; the setting is disabled by default on Windows Server 2025.
Graphics
CTX Snipping tool
VDAs will now include the new CTXSnipping tool which will allow users to take screenshots of overlayed content like BCR and Optimized Teams.
Visual quality improvements
Visual quality is improved with default visual quality settings, and the visual quality now adjusts more effectively to network changes.
Intelligent Surface Encoding
Intelligent Surface Encoding improves performance for mixed and heavy workloads when using multiple monitors.
HDX Graphics super resolution GA
General availability of HDX graphics super resolution. HDX graphics super resolution is automatically engaged by default when suboptimal bandwidth conditions are detected, and a compatible client is available.
Expanded visually lossless support
Visually lossless compression with YUV 4:4:4 is now available for all video encoding modes, including selective encoding, Build to Lossless and Intelligent Build to Lossless.
Clipboard
Predefined format groups for Clipboard
Citrix Clipboard policies now include predefined format groups for the most common types of clipboard data.
Seamless Applications
Icon badge support for Seamless applications
Added support for Icon badges to Seamless applications to indicate application status or application updates.
Web Studio
Citrix Aidrien integration with Web Studio
In Web Studio, you can now open Citrix Aidrien from the top-right corner to get AI-powered answers from the Citrix knowledge base. When you click it, a new browser tab opens where you can sign in to Citrix Cloud with your credentials and start chatting.
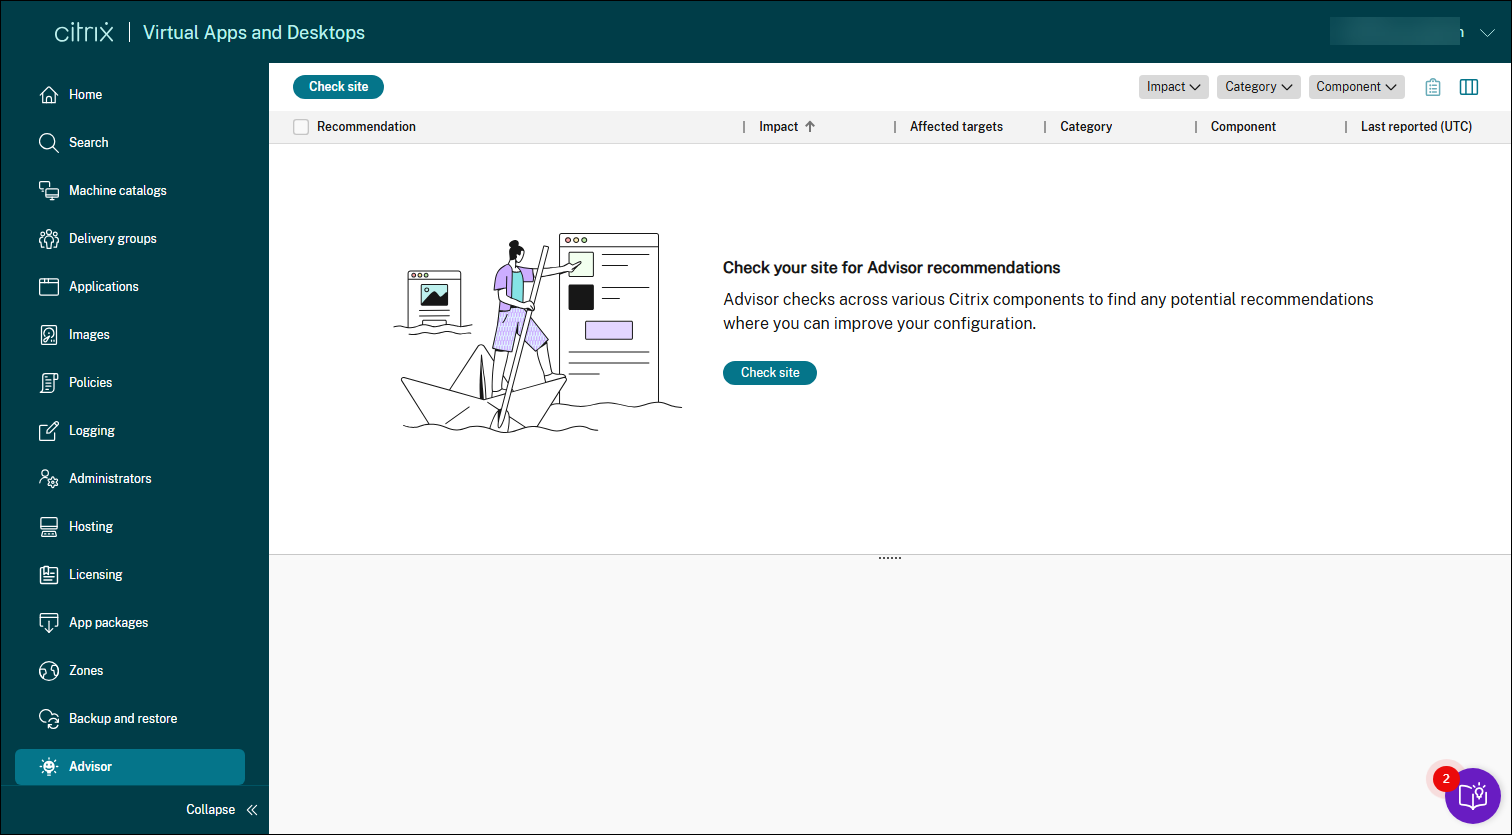
Citrix Advisor: Proactive insights and optimization for your deployment
Citrix Advisor is a component that helps you optimize your deployment and enhance its overall health and readiness. It automates environment checks and delivers actionable recommendations, empowering you to proactively identify configuration issues, inefficiencies, resource wastes, deviations from best practices, and more.
With Advisor, you can:
-
Proactively identify and resolve issues: Detect potential problems, configuration drift, and deviations from best practices before they impact users, disrupt business operations, or compromise security.
-
Optimize environment performance and stability: Fine-tune configurations, optimize resource allocation, and implement best practices to enhance the stability, security, and performance of your Citrix deployments.
-
Streamline operations and reduce overhead: Automate routine checks, simplify complex remediation tasks, and receive guided assistance, thus reducing operational overhead and freeing up administrative resources.
-
Optimize costs and resource utilization: Identify areas of overspending, uncover opportunities for resource optimization, and ensure efficient utilization of Citrix technologies to minimize total cost of ownership.
-
Maintain compliance and adherence to best practices: Ensure that Citrix deployments adhere to Citrix best practices, security standards, and industry regulations, reducing risk and improving overall governance.
-
Simplify complex tasks: Simplify administrative tasks to support a healthy, optimized environment.
For more information, see Citrix Advisor.
Microsoft Entra single sign-on configuration in Web Studio
You can now configure Microsoft Entra single sign-on (SSO) directly in Web Studio > Settings. After you enable this feature, the Microsoft Entra hybrid identity option becomes available when you choose the identity type for user logon during delivery group creation.
For more information, see Configure Microsoft Entra single sign-on (SSO) in Web Studio and Configure how users access resources in a delivery group.
Resource filtering
The resource filtering feature lets you configure rules to control user access to resources across delivery groups. You can define the resource type (application, desktop, or both), apply tag restrictions, and set conditions for rule enforcement based on factors like network location and store connection context. To access the feature, go to Delivery groups > Settings > Resource filter. For more information, see Restrict user access to resources across all delivery groups.
Improved scope control for Default Policy Set
Scope control has been available for policy sets. To maintain compatibility, the Default Policy Set is now assigned to any scope, with Bypass scope control enabled by default. Review your Default Policy Set assignments and adjust them if you want to limit access based on scope.
You can update scope assignments in two ways:
- From the policies: Edit the Default Policy Set and change its associated scopes.
- From the scope: Go to the scope in Administrators > Scopes and assign or remove Default Policy Set from it.
For more information, see Create and manage scopes and Create and manage policy sets.
Expanded icon support
When customizing icons for desktops and applications, you can now extract and use icons from .exe files, in addition to the previously supported .icon format.
You can browse and select those icons from either your local machine or a VDA machine. The maximum supported icon file size is 500 KB. For more information, see Create delivery groups.
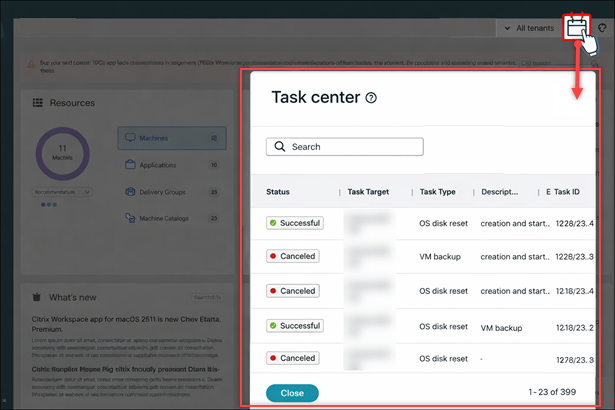
Task Center now available
Task Center provides a centralized view of scheduled and recurring tasks in Studio, helping you track these task statuses: Scheduled, Completed, Failed, or About to run. You can access Task Center by selecting the calendar icon in the upper-right corner of the Studio console.
In this release, Task Center supports Hardware update and OS disk reset tasks. Support for additional task types will be added in future releases. For more information, see Monitor and manage tasks in Task Center.
Discover Numecent Cloudpaging applications from network shares
You can now discover Numecent Cloudpaging applications from network shares using the App packages node in Web Studio. Previously, Cloudpaging discovery was supported only from the Cloudpager console. This feature requires delivery groups with VDA version 2603 or later. For more information, see Deploy and deliver app packages.
Customize column layout in Search main views
You can now reorder columns in Web Studio to better organize and group related information. Web Studio retains your column order and width preferences, so your customized layout persists across sessions. Currently, this capability is supported in the main views in Search.
Improved multi-selection in the Search node
We’ve updated the Search node with a more intuitive table layout. This change enables you to:
-
Select multiple items using checkboxes in each row, making the experience more intuitive.
-
Select all items on the current page using the check box in the column header.
While multi-selection and page-level selection aren’t new (previously done using keyboard shortcuts), this enhancement greatly improves affordance and usability, and lays the groundwork for future support of multi-selection across pages.
Automated database and site upgrades with PowerShell SDK
In addition to upgrading through Site Manager, you can now upgrade your database and site automatically using a new PowerShell SDK cmdlet Update-XDSite. This cmdlet enables version-independent, long-term automation of the upgrade process, providing an alternative to using Site Manager. It is especially useful for environments that require scripted or repeatable upgrade workflows.
For more information, see Upgrade the database and site automatically and Citrix Virtual Apps and Desktops SDK Guide.
Red Hat OpenShift: Citrix Provisioning catalog using MCS
With Web Studio, you can now create Citrix Provisioning catalogs in Red Hat OpenShift virtualization environments. Previously, you had to switch between different consoles to provision and manage those catalogs. This feature simplifies the process, letting you perform provisioning and power management tasks entirely within Studio. For more information see, Create Citrix Provisioning™ catalogs in Citrix Studio.
Simplified image version deletion with automatic unsharing
Previously, deleting a shared image version required you to first manually unshare it from all resource locations via Manage Image Share, then delete it.
Now, as long as no machine catalog is actively using the image version for deployment, you can delete it in a single step. Web Studio automatically removes all image share configurations across resource locations as part of the deletion — no manual unsharing required.
Share prepared image versions across hosts in the same resource pool in XenServer
You can now use the Images node to share image versions across hosts in the same resource pool in XenServer. This implementation ensures consistency and uniformity of images across different hosts, enhancing deployment flexibility and operational efficiency. You can also use PowerShell commands to achieve this goal. For information, see Image management.
Manage prepared images for Azure Local
Image management functionality is now generally available for Azure Local environments. You can use Images node to create image definitions, versions, and MCS machine catalogs. This implementation significantly reduces the storage and time costs, and simplifies the VM deployment and image update process. You can also use PowerShell commands to achieve this goal. For information, see Create a prepared image machine catalog in Azure Local.
Use existing identity pools to create identities for MCS-provisioned machines
When creating AD-joined catalogs or adding machines to them using Studio, you can now use an existing identity pool to allocate machine identities. This feature allows you to apply a consistent machine account naming scheme across multiple catalogs. For more information, see Machine identities.
Citrix Director
Citrix Aidrien integration with Citrix Director
Citrix Director now includes integration with Citrix Aidrien in Citrix Cloud for in-product support and assistance for Citrix and NetScaler solutions with 2603 release. With a single click, administrators can launch Citrix Aidrien in Citrix Cloud and sign in using their Citrix Cloud credentials to access Citrix Aidrien capabilities.
For more information on Citrix Aidrien and supported use-cases in Citrix Director, see Citrix Aidrien integration for Director.
App protection reporting in Citrix Director
Real-time reporting of protection policy activations and security risk detections is available in Citrix Director and Monitor. The reporting enables you to quickly assess the risk and configure your protection policies to ensure a safer environment. By proactive risk management and policy reconfiguration, you can strengthen endpoint security in your environment and reduce exposure to emerging threats. For more information, see Endpoint Security policy activation & threat detection reporting in Director
uberAgent integration - Enhanced performance metrics for sessions, machines, and applications
Session, machine, and application performance data from uberAgent will now be available in Director/Monitor. Unified Observability in Director and Monitor brings the performance data together into a single, consistent view of the Citrix environment. It correlates user experience indicators, such as session scores, with underlying session behavior, machine resource utilization, and application performance to provide end‑to‑end visibility across the delivery stack. This unified approach helps administrators assess overall experience health, analyze performance trends, and identify the underlying causes of performance issues without switching between disconnected views or tools.
Machine Creation Services™ (MCS)
Service Window
The Service Window feature provides a capability to schedule and automate operations on MCS-provisioned VMs. This feature currently supports various operations such as Reset OS disk and hardware configuration changes using Web Studio and PowerShell. For information, see:
Repair Active Directory account for existing MCS provisioned catalogs
You can now repair Active Directory (AD) computer accounts for existing on-premises AD joined and Microsoft Entra Hybrid joined MCS machine catalogs using Service Window. This is useful when VMs have lost domain trust. This feature applies to both persistent and non-persistent MCS machine catalogs. For more information, see Repair AD account for existing catalogs.
Manage on-premises image replication
This enhancement introduces an explicit image replication workflow for on-premises hypervisors. Previously, you were not able to replicate image version instances to newly added or superseded storage locations, making it difficult to manage image availability across all necessary storage. With this enhancement, you can run PowerShell commands and replicate the image version instance to storage locations. This feature applies to on-premises hypervisors, including VMware, XenServer, and Nutanix AHV Prism Central environments.
For more information, see Image Replication of additional storage for supported on-premises hypervisors.
Enable Entra Hybrid join for existing MCS provisioned catalogs
You can now convert existing on-premises Active Directory joined MCS machine catalogs to Microsoft Entra Hybrid joined catalogs using Service Window. This feature applies to both persistent and non-persistent MCS machine catalogs. For more information, see Enable Entra Hybrid join for existing catalogs.
Preserve SCCM GUID for non-persistent VMs
This enhancement ensures MCS preserves the SMS Unique Identifier (GUID) for SCCM client-installed, MCS-provisioned non-persistent VMs. Previously, these machines generated new GUIDs upon reboot or image update, causing duplicate entries in the SCCM console.
This helps you to:
- Ensure each provisioned machine has a unique SCCM client
ID. - Prevent duplicate entries for the same machine in the SCCM console.
- Maintain persistent SCCM
GUIDsacross reboots and image updates.
Support for Entra ID extension attributes in MCS
You can now integrate Entra ID extension attributes into your MCS environment. These attributes allow you to store unique, custom data directly on your Entra ID device objects. You can thus apply precise conditional access policies by filtering devices with extension attributes, refer to Supported operators and device properties for filters for creating more filters based on device attributes. The feature is supported for Microsoft Entra hybrid joined identity types.
You can manage your MCS machine catalogs using Entra ID extension attributes (ExtensionAttribute1-15). For this, prepare a Service Principal with “Device.ReadWrite.All” permission. You can create and update an MCS machine catalog with Extra ID extension using both Studio and PowerShell commands.
Extension attributes are assigned to devices (both persistent and non-persistent VMs) when they are registered. See Identity pool of Microsoft Entra hybrid joined machine identity.
Azure
Azure ZRS disk types for prepared images
MCS in Azure now enables you to select Zone Redundant Storage (ZRS) disk types for prepared images with MCS image management. This enhancement provides greater flexibility in disk type selection and improves the resiliency of your MCS machine catalogs in Azure by ensuring higher availability for prepared image disks.
This helps you to:
- Have prepared image disks with higher availability.
- Avoid the risk of losing prepared images due to zone outages.
- Maintain ongoing operations without impact from storage-side disk failures.
For more information, see Create a prepared image.
Change Azure VM availability zones
This enhancement allows you to modify the availability zone property for existing MCS provisioned VMs in Azure. Previously, this required recreation of the VM. This feature provides greater flexibility, especially for persistent virtual machines.
This helps you to:
- Adjust existing Azure VMs to have no availability zone affinity.
- Assign a specific availability zone to Azure VMs that currently lack one.
- Move an existing Azure VM from one availability zone to another.
For more information, see Update provisioned machines to current provisioning scheme state.
Enhance Azure backup SKU mix
This enhancement removes previous limitations in Azure’s BackupVmConfiguration feature. Previously, you can’t mix VM SKUs that support hibernation with those that do not support it within the same backup list. This update allows you to include both hibernate-capable and non-hibernate-capable SKUs in your backup configurations.
This helps you to:
- Use a broader range of VM SKUs in your backup configurations.
- Improve VM provisioning and start success rates on Azure.
- Increase the resilience of your deployments.
For more information, see Configure backup VM sizes.
Azure SSD storage for ephemeral OS disks
This feature enhances ephemeral OS disk performance in Azure by allowing you to select higher-tier SSD storage types. Previously, only Standard_LRS was supported. Now, you can use StandardSSD_LRS or Premium_LRS by setting the StorageType custom property when creating an MCS catalog.
This helps you to:
- Achieve a higher SLA with improved reliability.
- Experience significantly higher IOPS compared to
Standard_LRS.
For more information, see Configure storage type used by ephemeral disks.
Support for Azure Extended Zones
You can now provision workloads in Azure Extended Zones using MCS provisioning. Azure Extended Zones are small footprint extensions of major Azure regions. They provide lower latency and data residency for customers that are further from the main region location. For more information, see Azure Extended Zones.
AWS
Amazon Workspaces Core Managed Instances: Cross-account provisioning using PowerShell
There are use-cases where the Cloud Connectors must be placed in a separate AWS account (shared services account or site components account) with IAM roles that have cross-account access (cross-account IAM role) and MCS-provisioned machine catalogs in separate secondary AWS account (workloads accounts), without the need for additional Cloud Connectors in the separate accounts. To support such scenarios, this feature uses VPC peering and cross-account access using IAM roles to make provisioning across different AWS accounts possible for enterprises managing multiple AWS accounts.
With VPC peering, you can have your Cloud Connector, and provisioned VMs in different regions or accounts be able to communicate among each other.
With cross-account access using IAM roles, you allow the primary account (Cloud Connector account) to assume an IAM role to access AWS resources in the secondary account (machine catalog VMs).
For detailed information, see Cross-account provisioning.
Flexible billing for Amazon WorkSpaces Core Managed Instances
You can now choose between Monthly (flat-rate) and Hourly (pay-as-you-go) billing models when provisioning Amazon WorkSpaces Core Managed instances using Citrix MCS.
This flexibility allows you to optimize compute costs based on your specific workload requirements and usage patterns.
Use the Monthly billing mode for persistent desktops to benefit from predictable, flat-rate pricing, or use Hourly billing for on-demand or intermittent workloads.
This feature requires your AWS account to be configured for the Amazon WorkSpaces billing service.
For more information, see Fexible billing.
Support for creating MCSIO-enabled MCS machine catalogs of Amazon WorkSpaces Core Managed Instances
You can now create MCSIO-enabled MCS catalogs to create MCSIO-enabled MCS machine catalogs of Amazon WorkSpaces Core Managed Instances to improve write IOPS by directing write operations to the write-back cache and to reduce the startup time when the persisting OS disk is enabled. For more information, see MCSIO enabled catalog.
Support for assigning security groups per network interface to VMs using the machine profile in AWS EC2
In the AWS EC2 virtualization environment, you can now create an MCS machine catalog where the provisioned VMs are assigned security groups per ENI (Network Interface). To do this, use a machine profile input (EC2 instance or launch template) that has different security groups mapped to distinct ENIs. For example, if machine profile input has ENI A with SG 1 and ENI B with SG 2, then provisioned VMs will also have ENI A with SG 1 and ENI B with SG 2.
This feature applies to:
- Persistent and non-persistent catalogs
- New machine catalogs
- New VMs provisioned to an existing catalog
For information, see Create a machine profile-based machine catalog using PowerShell.
Nutanix AHV Prism Central
Support for creating Citrix Provisioning catalogs using MCS PowerShell commands with Nutanix AHV Prism Central connection
You can now create Citrix Provisioning catalogs using MCS PowerShell commands in Nutanix AHV Prism Central host connection.
This implementation provides you the following advantages:
- A single unified API to manage both MCS and Citrix Provisioning catalogs.
- Have new features for Citrix Provisioning catalogs, such as, identity management solution, on-demand provisioning, and so on.
For more information, see Create a catalog in Nutanix AHV Prism Central using PowerShell.
Migrate machine catalogs to Citrix-managed Nutanix AHV Prism Central host connection
With this feature, you can migrate your Citrix machine catalogs, and their associated VMs from existing Nutanix AHV (for Prism Element) and Nutanix AHV PC (for NC2 on Azure) host connections to the Citrix-managed Nutanix AHV Prism Central host connection. For migration, use PowerShell commands, which also include fast rollback options in case of issues, and commands to clean up source resources post-migration. For information, see Migrate machine catalogs to Citrix-managed Nutanix AHV Prism Central host connection.
Support for image management in Nutanix AHV Prism Central environments
Image management functionality is now generally available for Nutanix AHV Prism Central virtualization environments. This implementation significantly reduces the storage and time costs, and simplifies the VM deployment and image update process. You can currently use only PowerShell commands to achieve this goal. For information, see Create catalogs using prepared images in Nutanix AHV Prism Central.
Reset OS disk for persistent VMs
With this feature, you can now reset OS disk for persistent VMs using the Reset-ProvVMDisk PowerShell command in Nutanix AHV Prism Central environments. For more information, see Reset OS Disk for Persistent VMs.
VMware
Support for provisioning Data disk in VMware
A Data disk allows storage of persistent data like event logs, security traces, and application data. With this feature, you can now create and assign a persistent and non-persistent Data disk to an MCS created persistent or non-persistent VM of an MCS machine catalog in VMware.
The Data disk must be provisioned from the master image. The provisioned VM’s Data disk derives properties like storage policy, size, and so on from the master image. For machine profile based catalog, it can optionally use the VM template’s Data disk for deriving the properties. If the VM template doesn’t have a data disk, then Storage’s default policy is used. For more information, see Provision a Data disk on MCS created VM.
Red Hat OpenShift
vCPU calculation and CPU topology constraints
When updating the CPU configuration of an OpenShift virtual machine, the plugin computes the number of sockets based on the requested vCPU count and the existing CPU topology (cores and threads) from the machine profile.
The formula used is:
sockets = requestedVCpuCount / (cores × threads)
<!--NeedCopy-->
For more information, see vCPU calculation and CPU topology constraints.
vGPU Support in OpenShift MCS
OpenShift MCS currently supports vGPU configuration through passthrough behavior. The vGPU settings defined on the master VM or in the Machine Profile are read and applied to the VMs provisioned through the MCS catalog. Currently, you can’t modify vGPU parameters during catalog creation. The vGPU configuration is inherited directly from the source configuration and applied to the provisioned VMs as configured.
Enhanced Citrix Virtual Desktop Assistant application
The Citrix Virtual Desktop Assistant application is now enhanced to have the following new features:
-
Home page:
- Record your session: Records your active virtual desktop session as MP4 video clips for troubleshooting, collaboration and session review.
- Take a screenshot: Captures your entire session, including areas that Windows Snipping tool might miss or black out.
- Apps page: Displays Optimized tag beside the application name if that application is in the optimized list.
- Tools page: Displays tools such as Snipping tool and Session recording.
- Sounds page: Displays warning messages if Citrix Virtual Desktop Assistant cannot use your microphone.
- AOT logs: Exports logs for your session and share the logs with your administrator.
- About page: Option to download support files and send feedback along with the Citrix Virtual Desktop Assistant logs.
Preview features
Power management of Oracle Compute Cloud@Customer (C3) Instances with Oracle C3 plug-in (Preview)
Oracle Compute Cloud@Customer (C3) extends Oracle Cloud Infrastructure (OCI) services to on-premises environments. This hybrid deployment is designed to meet data sovereignty and regulatory requirements by keeping data local while utilizing OCI’s identity and governance services for streamlined access management.
With Oracle C3 plug-in, you can create hosting connections to your Oracle C3 environments, create catalogs, and power manage instances in the catalog using Web Studio. Alternatively, you can use PowerShell commands. For more information, see:
- Oracle Compute Cloud@Customer (C3) environments
- Connection to Oracle Compute Cloud@Customer (C3)
- Create an Compute Cloud@Customer (C3) catalog
- Power manage Compute Cloud@Customer (C3) VMs
Support for Amulet Hotkey CoreStation plugin (Preview)
With this feature, Citrix manages your Amulet Hotkey CoreStation workloads through a Amulet Hotkey CoreStation plugin. With this plug-in, you can create hosting connections to your Amulet Hotkey CoreStation enclosure, create catalogs, and power manage machines in the catalog using PowerShell commands.
For more information, see:
- Amulet Hotkey CoreStation virtualization environments
- Connection to Amulet Hotkey CoreStation
- Power manage Amulet Hotkey CoreStation VMs
- Create an Amulet Hotkey CoreStation machine catalog
Profile Management
For information about new features, see the What’s new article in its own document.
Linux VDA
For information about new features, see the What’s new article in its own document.
Session Recording
For information about new features, see the What’s new article in its own document.
Citrix Provisioning™
For information about new features, see the What’s new article in its own document.
Citrix Virtual Delivery Agent for macOS
For information about new features, see the What’s new article in its own document.
Workspace Environment Management™
For information about new features, see the What’s new article in its own document.
Federated Authentication Service
For information about new features, see the What’s new article in its own document.
In this article
- Delivery Controller
- HDX
- Web Studio
- Citrix Director
- Machine Creation Services™ (MCS)
- Enhanced Citrix Virtual Desktop Assistant application
- Preview features
- Profile Management
- Linux VDA
- Session Recording
- Citrix Provisioning™
- Citrix Virtual Delivery Agent for macOS
- Workspace Environment Management™
- Federated Authentication Service