Map view of successful session launches
Overview
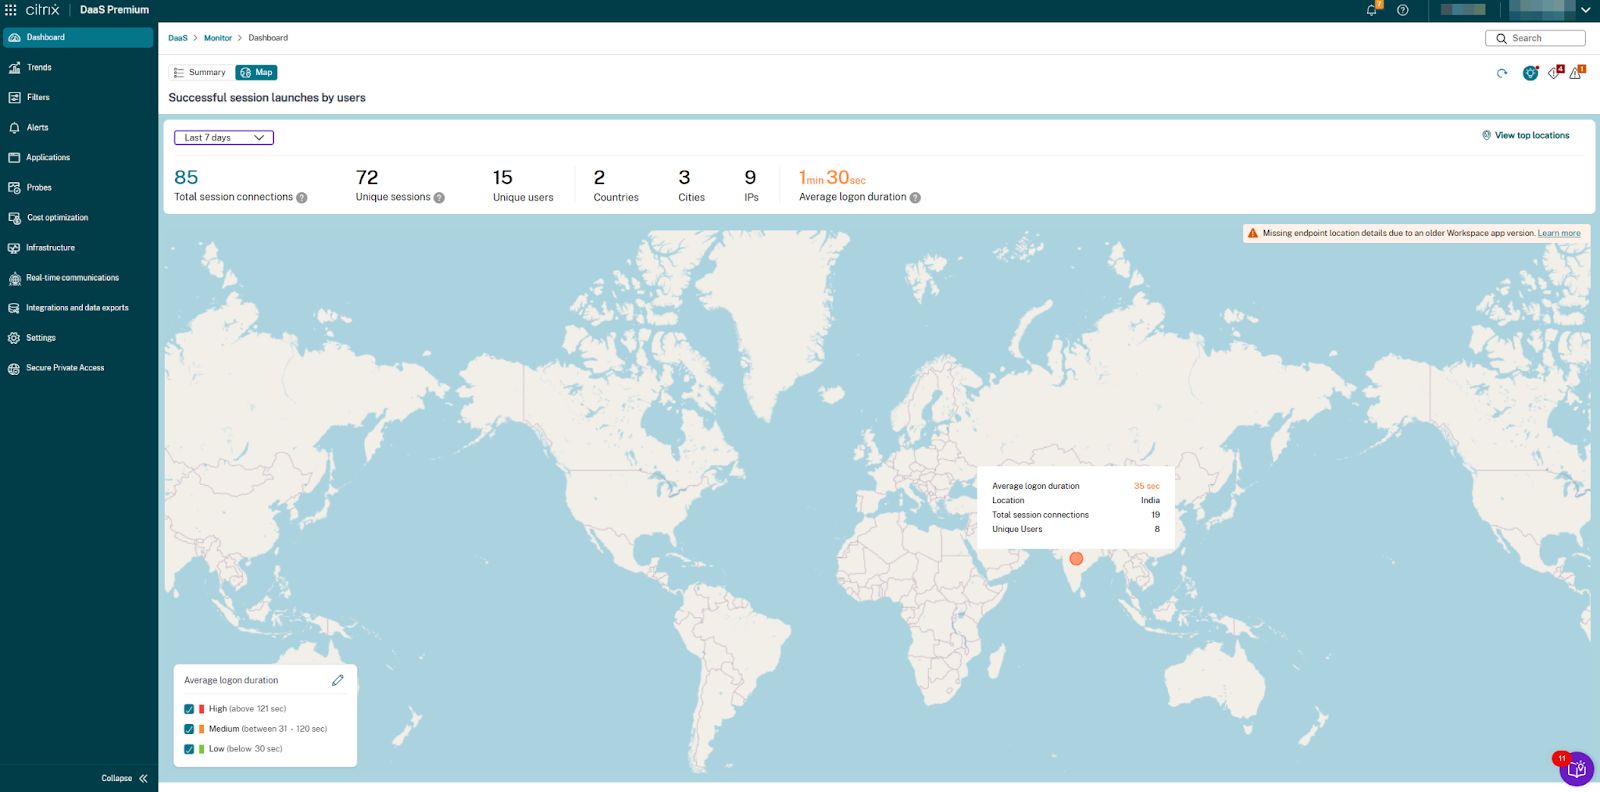
The Map view in Citrix Director provides administrators with a comprehensive geographical visualization of successful session launches across their Citrix environment. This feature visually maps user connections on a global scale, helping IT teams quickly identify regional performance patterns, troubleshoot geographical connectivity issues, and optimize the end-user experience based on location data. The map displays color-coded connection points that indicate logon performance across different geographical locations.
Prerequisites
The following table lists the features, endpoint metrics, and the supported product versions:
VDAs
| VDA Windows version | VDA Mac version | VDA Linux version |
|---|---|---|
| 2411 or later | NA | NA |
| Virtual Delivery Agent version | Citrix Workspace app for Windows version | Citrix Workspace app for Mac version | Citrix Workspace app for Linux version | Citrix Workspace app for HTML5 version | Citrix Workspace app for ChromeOS version |
|---|---|---|---|---|---|
| 2411 or later | 2409 or later | 2409 or later | 2408 or later | 2411 or later | 2411 or later |
Note:
The studio policy ‘Endpoint Location Data Collection’ must be enabled to access and display location data on the map. Please ensure this policy is configured before proceeding.
Key benefits
- Geographical performance insights: Instantly visualize connection performance metrics across different countries and regions.
- Customizable performance thresholds: Define your own standards for low, medium, and high (poor) logon durations.
- Connection density visualization: Identify high-traffic geographical areas through color-coded indicators and varying circle sizes.
- Global deployment overview: Access critical summary metrics for your entire environment.
- Regional troubleshooting: Quickly identify and address performance issues by geographical area.
- Real-time monitoring: View data that updates automatically every 5 minutes.
With full administrator permission, when you open Director, the Dashboard provides a centralized location to monitor the health and usage of a site.
The Dashboard contains Summary and Map views:
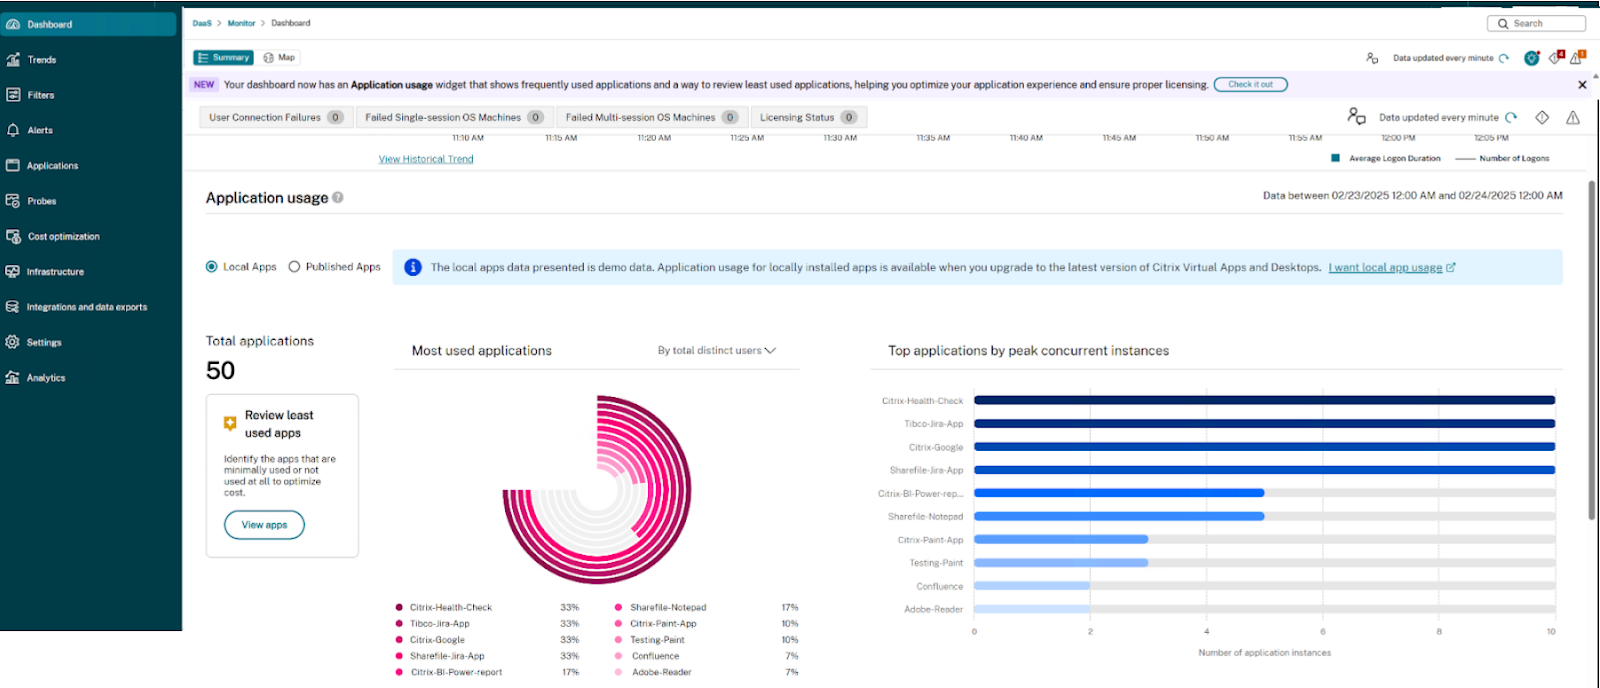
Summary view:
Map view:
User interface components
Navigation and view options
- Summary/Map toggle: Switch between summary statistics and geographical map visualization
- Time range selector: Filter data by time period (default: “Last hour”)
- View top locations: Option to focus on areas with highest connection density
- Data update indicator: Shows when data was last refreshed (updates every 5 minutes)
- Notification icons: System alerts and messages related to the deployment
Summary dashboard metrics
At the top of the Map view, administrators can view the following critical deployment-wide metrics:
| Metrics | Description |
|---|---|
| Total Session Connections | The aggregate number of session connections across all locations |
| Unique Sessions | The number of individual sessions established, excluding duplicates |
| Unique Users | The total count of distinct users who established connections |
| Countries | The number of different countries from which connections originated |
| Cities | The number of distinct cities from which connections originated |
| IPs | The total number of unique IP addresses that established connections |
| Average Logon Duration | The mean time taken for session establishment across the entire deployment |
Performance classification
Connection performance is categorized into the following three tiers, with customizable thresholds:
| Performance Level | Color Code | Default Threshold | Description |
|---|---|---|---|
| Low (Good) | Green | Below 60 sec | Fast logon experiences with minimal delays |
| Medium | Orange | 61-120 sec* | Acceptable logon times |
| High (Poor) | Red | Above 120 sec | Suboptimal logon experiences requiring attention |
Note:
The interface allows administrators to customize these thresholds through input fields in the legend panel.
Map legend and threshold controls
The interactive legend panel provides:
- Color-coded performance indicators with corresponding threshold values
- Editable threshold fields for customizing Medium performance range (minimum and maximum values)
- Validation message ensuring the maximum threshold exceeds the minimum threshold and is neither zero nor negative
- Selection/filter controls to focus on specific performance categories
System requirements and notifications
Citrix Workspace app version compatibility
The map displays a warning banner when endpoint location details are missing due to outdated Citrix Workspace app versions:
- Warning message: “Missing endpoint location details due to an older Workspace app version.”
- Resolution: Upgrading to the latest Workspace app version ensures complete geographical data collection
- Learn more: The banner includes a link to documentation with additional information on version requirements
Configuration options
Setting performance thresholds
- Locate the legend panel on the bottom left of the Map view.
- Enter custom values for Medium performance category:
- Minimum threshold (default: 61 sec)
- Maximum threshold (default: 120 sec)
- The Low category automatically adjusts to “below [minimum threshold]”.
- The High category automatically adjusts to “above [maximum threshold]”.
- Validation ensures maximum threshold exceeds minimum threshold and neither is zero or negative.
- Changed threshold values are stored in browser cache ( local storage) and are specific to the browser.
Time range configuration
- Use the dropdown menu in the top-left corner of the metrics section.
- Select the desired time period (default: “Last hour”).
The map and metrics automatically update to reflect data from the selected period.
Map view usage
You can use the Map view for the following:
Regional performance troubleshooting
- Identify regions showing predominantly red (High) logon duration indicators.
- Correlate with infrastructure components serving those regions.
- Implement targeted optimizations for affected geographical areas.
Capacity planning
- Review connection density patterns by observing circle sizes across different regions.
- Identify high-traffic geographical areas (larger circles) requiring additional resources.
- Plan infrastructure scaling based on regional usage patterns.
Global deployment assessment
- Use the metrics panel to understand the scale of your deployment (total connections, unique users).
- Compare logon performance across different geographical regions.
- Establish baseline performance expectations for different locations.
Threshold optimization
- Review the distribution of green, orange, and red indicators across the map.
- Adjust thresholds to better reflect acceptable performance for your specific environment.
- Create more meaningful performance categorization based on actual user experience.
Troubleshooting
Missing geographical data
If the warning banner “Missing endpoint location details due to an older Workspace app version” appears:
- Identify users with outdated Citrix Workspace app versions.
- Plan a phased upgrade to the latest Citrix Workspace app version.
- Prioritize upgrades in regions where geographical data is most critical.
Performance categorization issues
If performance categories seem inaccurately represented:
- Review current threshold settings in the legend panel
- Adjust the Medium category minimum and maximum values as needed
- Ensure thresholds align with your environment’s actual performance characteristics and expectations
Data refresh issues
If data seems outdated:
- Check the Data updated every 5 minutes indicator for the last refresh time.
Note:
For the past week, auto-refresh is disabled. Refresh manually to get the latest data.
- Verify the selected time range matches your troubleshooting period.
- Use the Refresh button if available to manually update the data.
Best practices
- Regularly review and adjust performance thresholds based on infrastructure improvements.
- Use the View top locations option to focus on areas with the highest connection volume.
- Compare geographical performance patterns before and after infrastructure changes.
- Create baseline reports of regional performance during optimal operation periods.
- Consider regional network conditions when setting performance expectations.
- Educate users about upgrading to the latest Citrix Workspace app version for complete data collection.
- Regularly check the Map View to identify emerging trends in session performance.