Secure Private Access integration with Monitor (Preview)
Secure Private Access is integrated with Monitor, the monitoring and troubleshooting console for Citrix DaaS. Administrators and help-desk personnel can monitor and troubleshoot Web/SaaS and TCP/UDP app sessions and events from the DaaS Monitor, in addition to the Secure Private Access dashboard.
Service entitlements
To use the DaaS Monitor feature with Secure Private Access, you must have both Secure Private Access and DaaS entitlements.
Supported clients
- Citrix Workspace™ app - 2409 and later
- Citrix Secure Access for Windows - 24.8.1.19 and later
- Citrix Secure Access for macOS - 24.10.1 and later
How to access Monitor
You can access Monitor from the Secure Private Access dashboard (Go to Monitor) or from the Citrix DaaS™ service tile.
Session definitions
A Secure Private Access session offers a comprehensive summary of an end-user’s session lifecycle, application activity, and user experience on a specific device. A session serves as a unified record for troubleshooting and analysis by providing visibility into the following aspects:
- Detailed insights into how applications are accessed, including launch hops, network topology, connections, and routing details. These details are crucial for resolving issues related to access policies.
-
Tracks all session activity from:
- Browsers accessing web or SaaS applications.
- The Citrix Secure Access client for private applications using TCP/UDP protocols.
Some of the key characteristics of a Secure Private Access session are:
- Each session is assigned a unique ID for tracking and analysis.
- A single session can include multiple app launches and provides a comprehensive view of the user activity within that specific session.
-
For each app, the session tracks:
- The security controls that apply to the app.
- The policy display name and ID that triggered the security controls.
- The condition that resulted in the policy being enforced.
- The session tracks all the internal domains that a user has visited in Citrix Enterprise Browser™ providing insights into the user navigation within the secure environment.
Web/SaaS app sessions
The session starts and ends for Web/SaaS apps is defined as follows:
- Start: Citrix Enterprise Browser or Chrome Enterprise Premium is opened in the Citrix Workspace app and applications are accessed.
- End: A session ends in the following scenarios.
- You close the Citrix Enterprise Browser.
-
After 30 minutes of inactivity and no session activity is reported.
The Citrix Enterprise Browser/Chrome Enterprise Premium client sends a session activity every 15 minutes to Monitor. If this session activity is not received for 30 minutes, which might occur due to the following reasons:
- Network failure.
- Internet connectivity issues.
- Session closure after the 360-minute interval without session activity.
Note:
For apps launched through native browsers (agentless), the session ends after 120 minutes of inactivity.
TCP/UDP app sessions
The session starts and ends for TCP/UDP apps is defined as follows:
- Start: You log in to the Citrix Secure Access™ client and access the apps.
- End: A session ends in the following scenarios.
- You log out of the Citrix Secure Access client.
- After 30 minutes of inactivity and no session activity is reported.
Agentless app sessions
The session starts and ends for the agentless apps is defined as follows:
- Start: You launch the app from Citrix Workspace app or from a web browser.
- End: A session ends after 120 minutes of inactivity.
Known limitation:
The agentless app sessions are terminated after 120 minutes of inactivity regardless of the timeout settings configured in the Secure Private Access console (Settings > Timeouts).
View a Secure Private Access session by user
View a session using the Search field
-
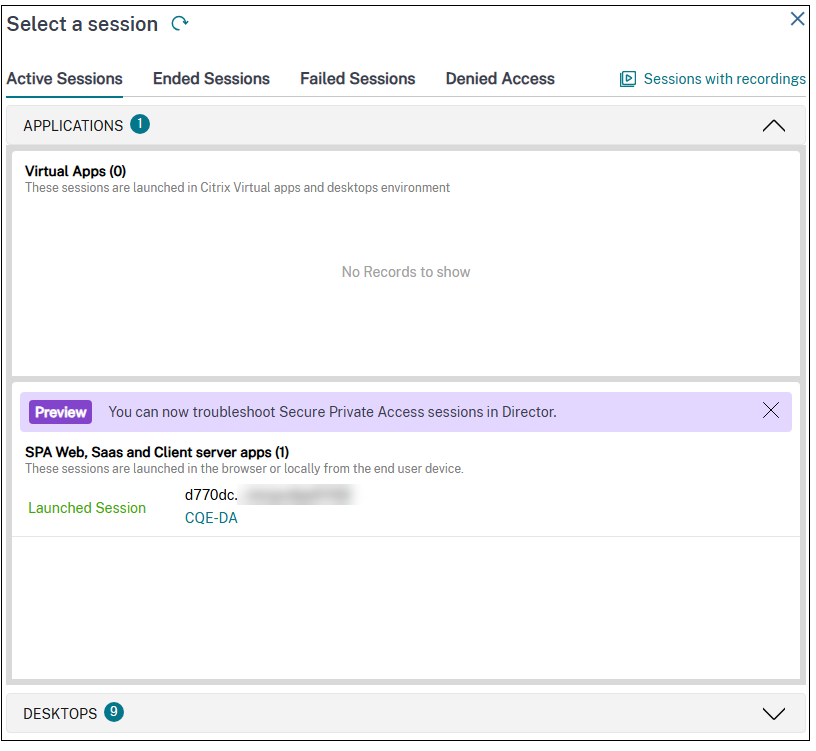
On the Monitor dashboard, click Search and enter the user name. The Select a session screen appears.
[Optional step]. If you don’t find the entered user name, click Search Directories to find the user name.

-
Select the required user. The Select a session screen appears.
View a session from the Filters page
You can search for the sessions from the Filters page wherein you can search for the specific sessions using the various conditions.
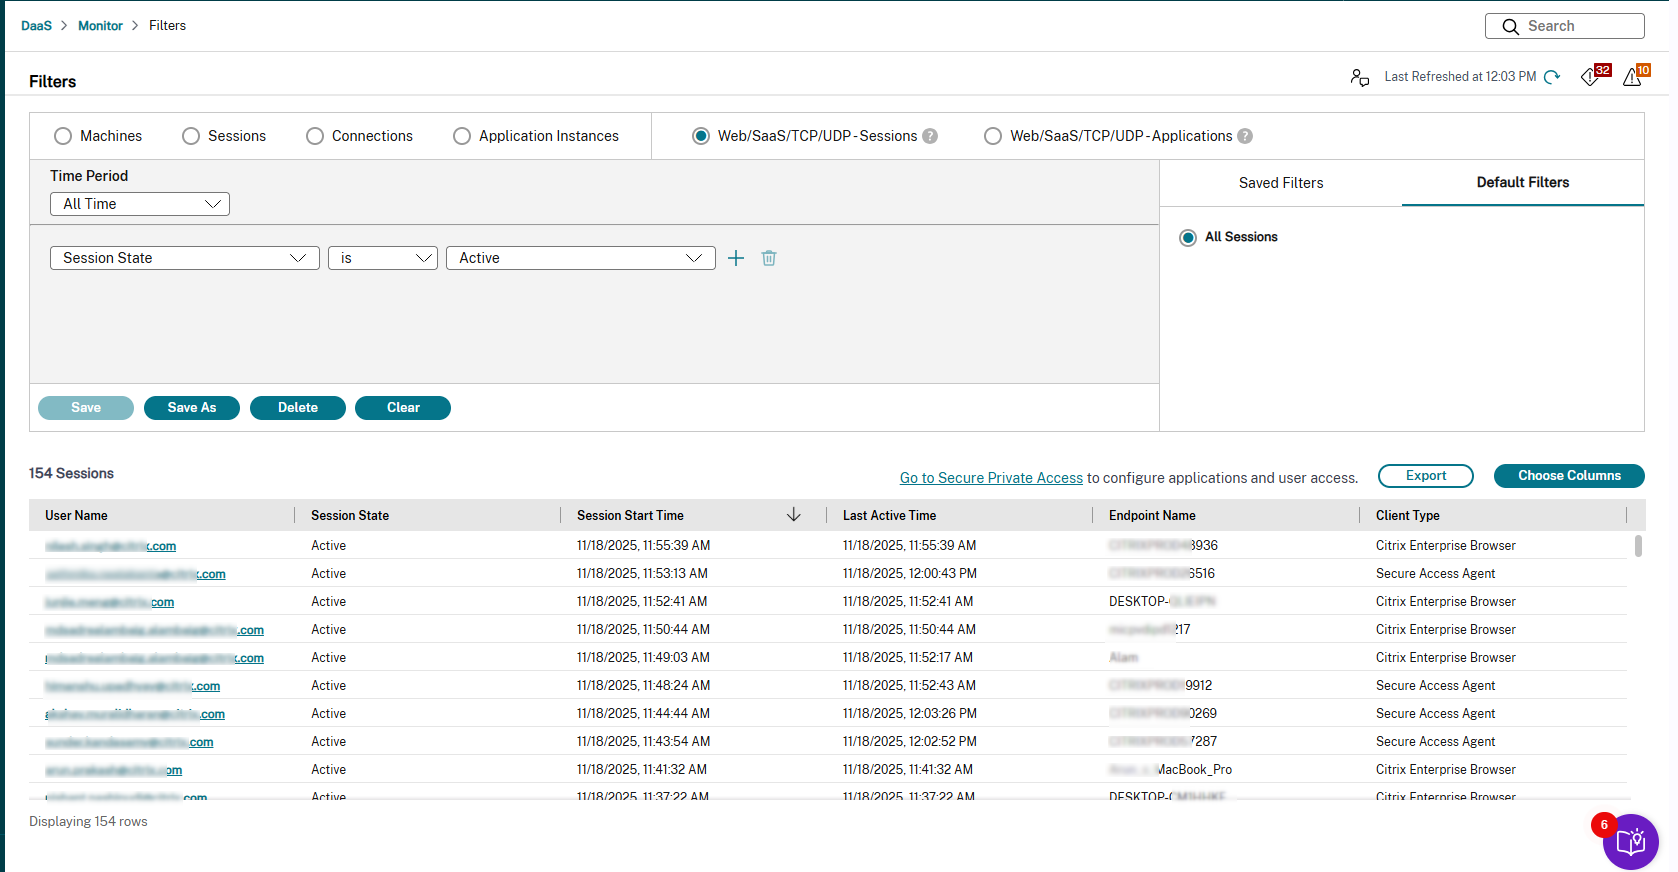
Perform the following steps to view a user session from the Filters page:
-
Refine your search based on the various filters such as the machines, sessions, connections, Application instances, Secure Private Access sessions, and Secure Private Access applications. You can also refine your search based on the timeline.
-
Use the drop-down lists to select further filter criteria (for example Associated user, Endpoint IP and so on). For more information, see Filter data to troubleshoot failures.
The list of sessions associated with the specified user is displayed.
Activity Manager for Secure Private Access session
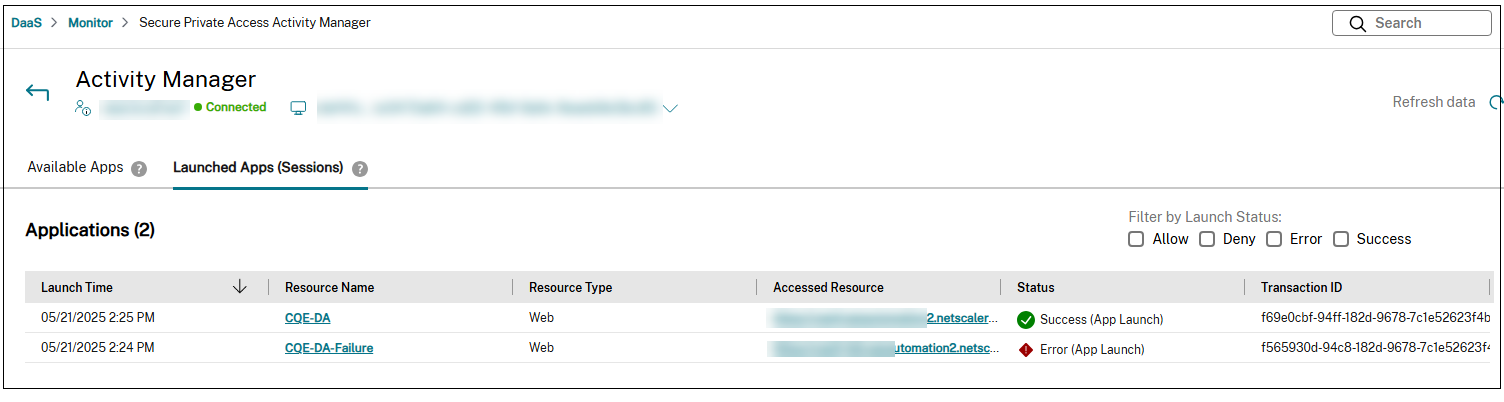
Citrix Monitor offers the Activity Manager view for Secure Private Access sessions, which gives you an overall view of the session activities. The Activity Manager provides a comprehensive view of all apps and desktops that are successfully opened, failed to open, and the outcome of the policies set in the Secure Private Access app.
The Activity Manager contains the following tabs:
Available Apps: Displays the apps that are available in the Citrix Workspace app. This section shows the last enumeration attempt of the apps and the status of the enumeration attempt.
Launched Apps: Displays the apps that are opened in the Citrix Workspace app.
Note:
If an application is accessed multiple times in the same session, only the details of the most recent access are captured.
View Activity Manager
To view the Activity Manager, do the following:
-
On the Monitor dashboard, click Search and enter the user name.
[Optional step]. If you don’t find the entered user name, click Search Directories to find the user name.
-
Select the required user. The Select a session screen appears.
-
Select an active session that is opened using the Secure Private Access session. The Activity Manager for the selected session appears.
-
Click Available Apps to view apps that are available in the Citrix Workspace app or click Launched Apps (sessions) to view the apps that are opened in the Citrix Workspace app.
You can categorize and filter resources based on their access status for users. These statuses reflect the outcome of the policies configured within the Secure Private Access app.
- Allow: Indicates that the Secure Private Access policy allows access to the specified resource. As a result, the resource is visible and accessible within the user’s Citrix Workspace app.
- Deny: Indicates that the Secure Private Access policy prevents the user access to the resource. Although the resource might be visible within the user’s Citrix Workspace application, it remains inaccessible, indicating access restrictions resulting from policy enforcement.
- Error: Indicates a scenario where a user is intended to have access to a resource according to the Secure Private Access app policies. However, due to an underlying issue, the resource is not functioning correctly or is unavailable within the Citrix Workspace app. The error might be related to enumeration or session.
- Success: Indicates whether the app launch was successful.
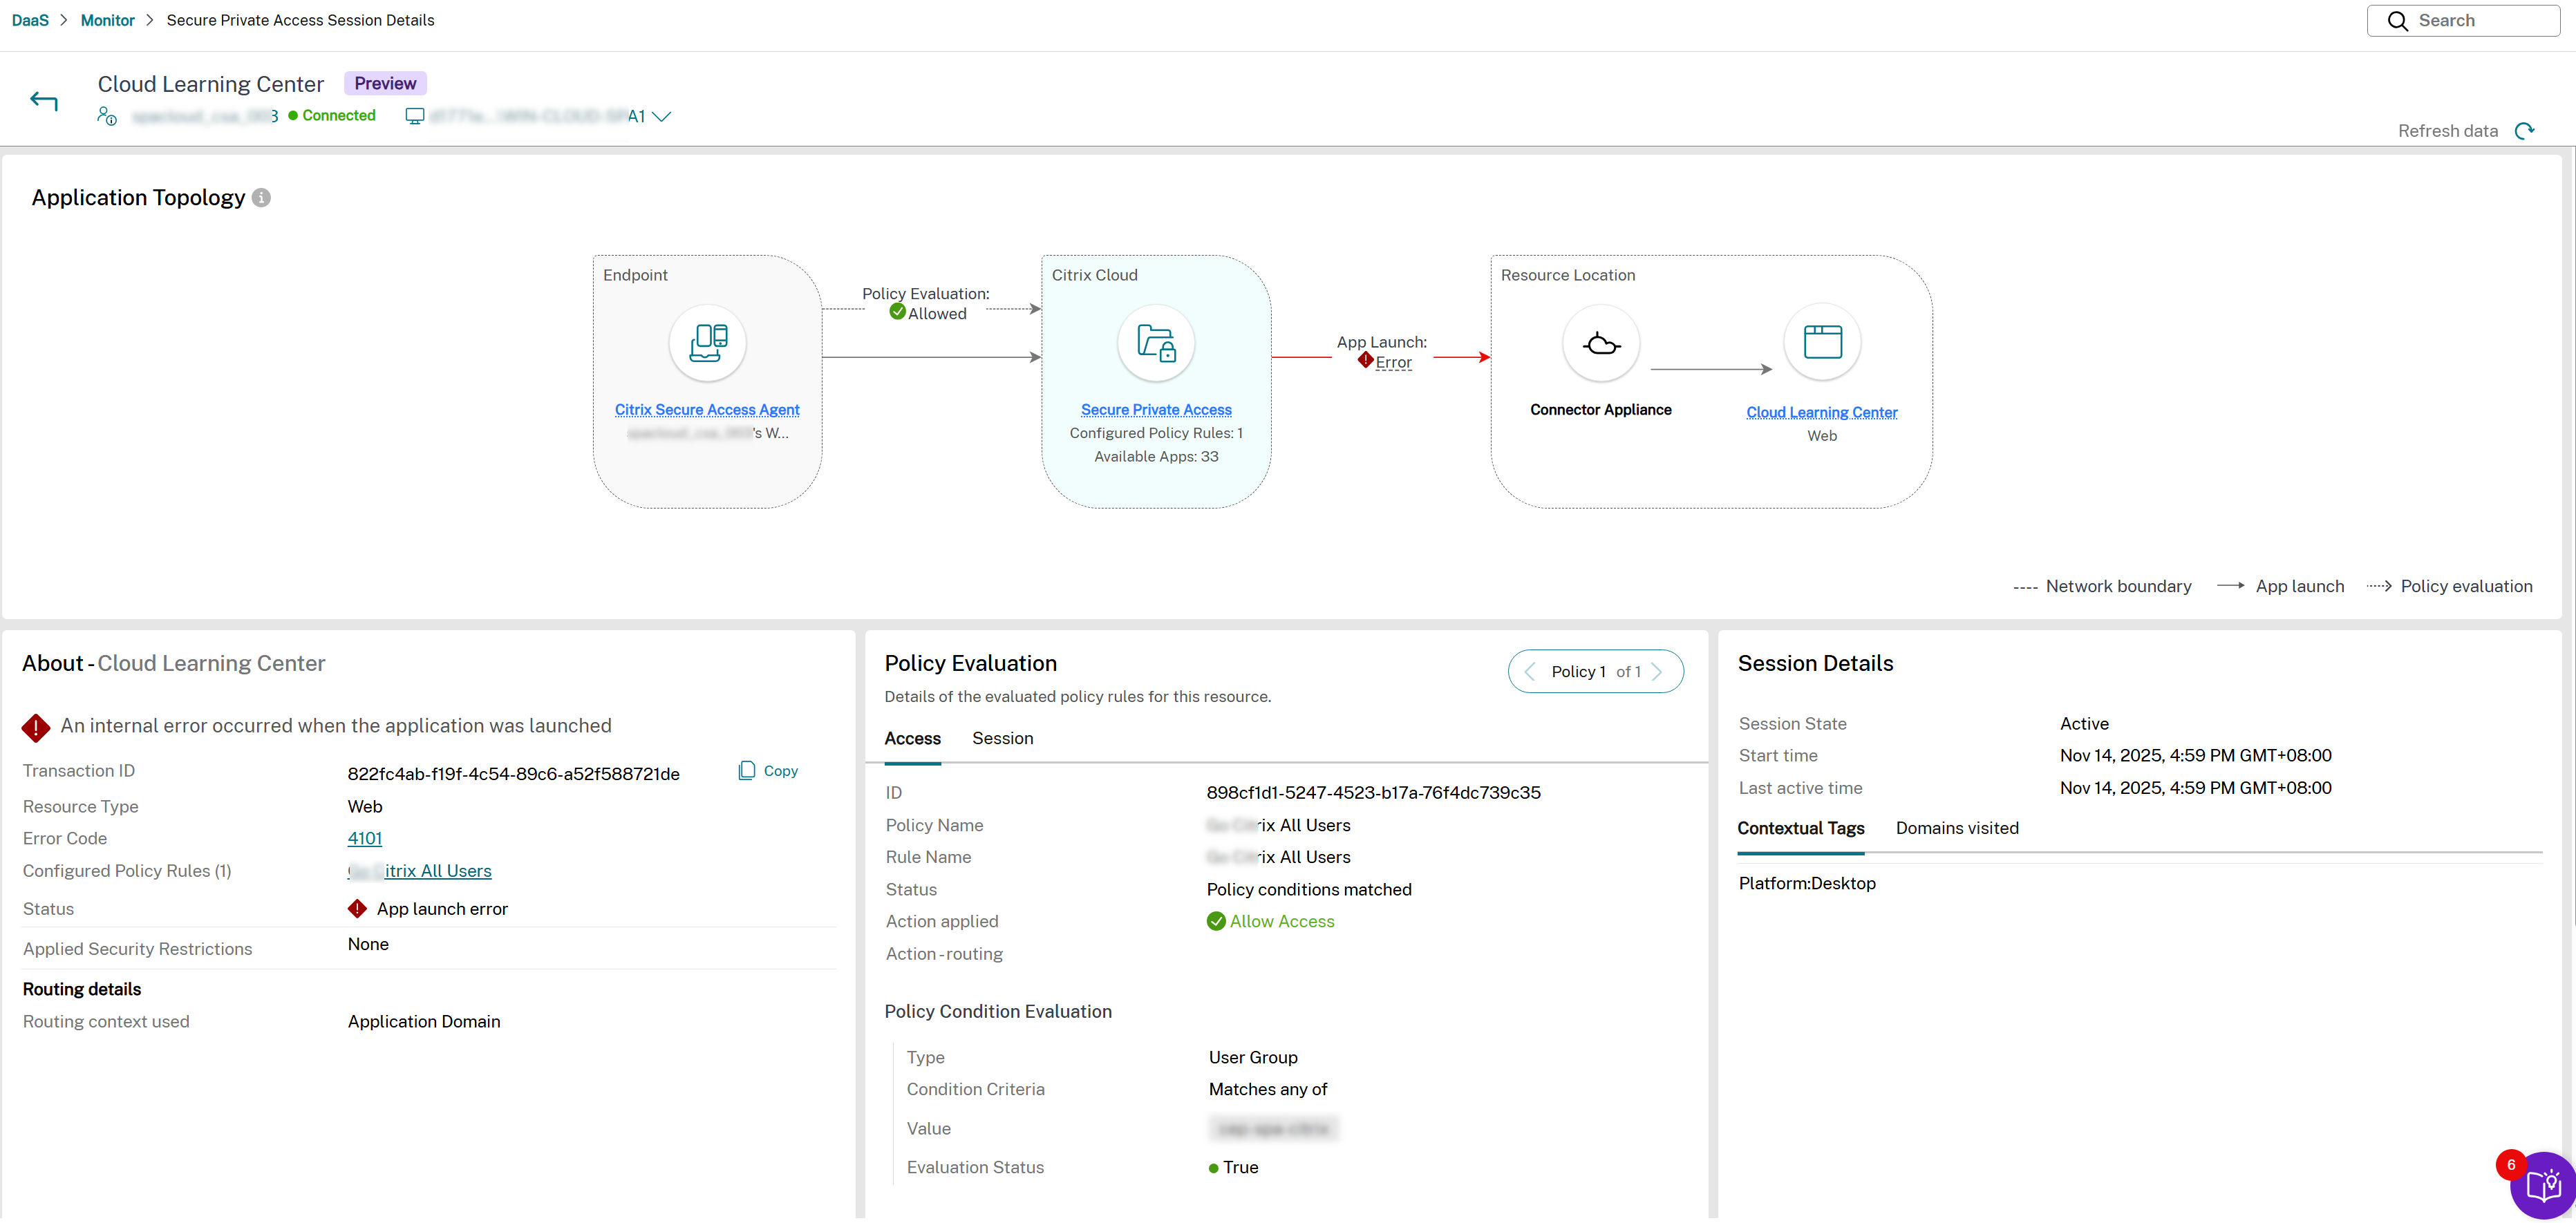
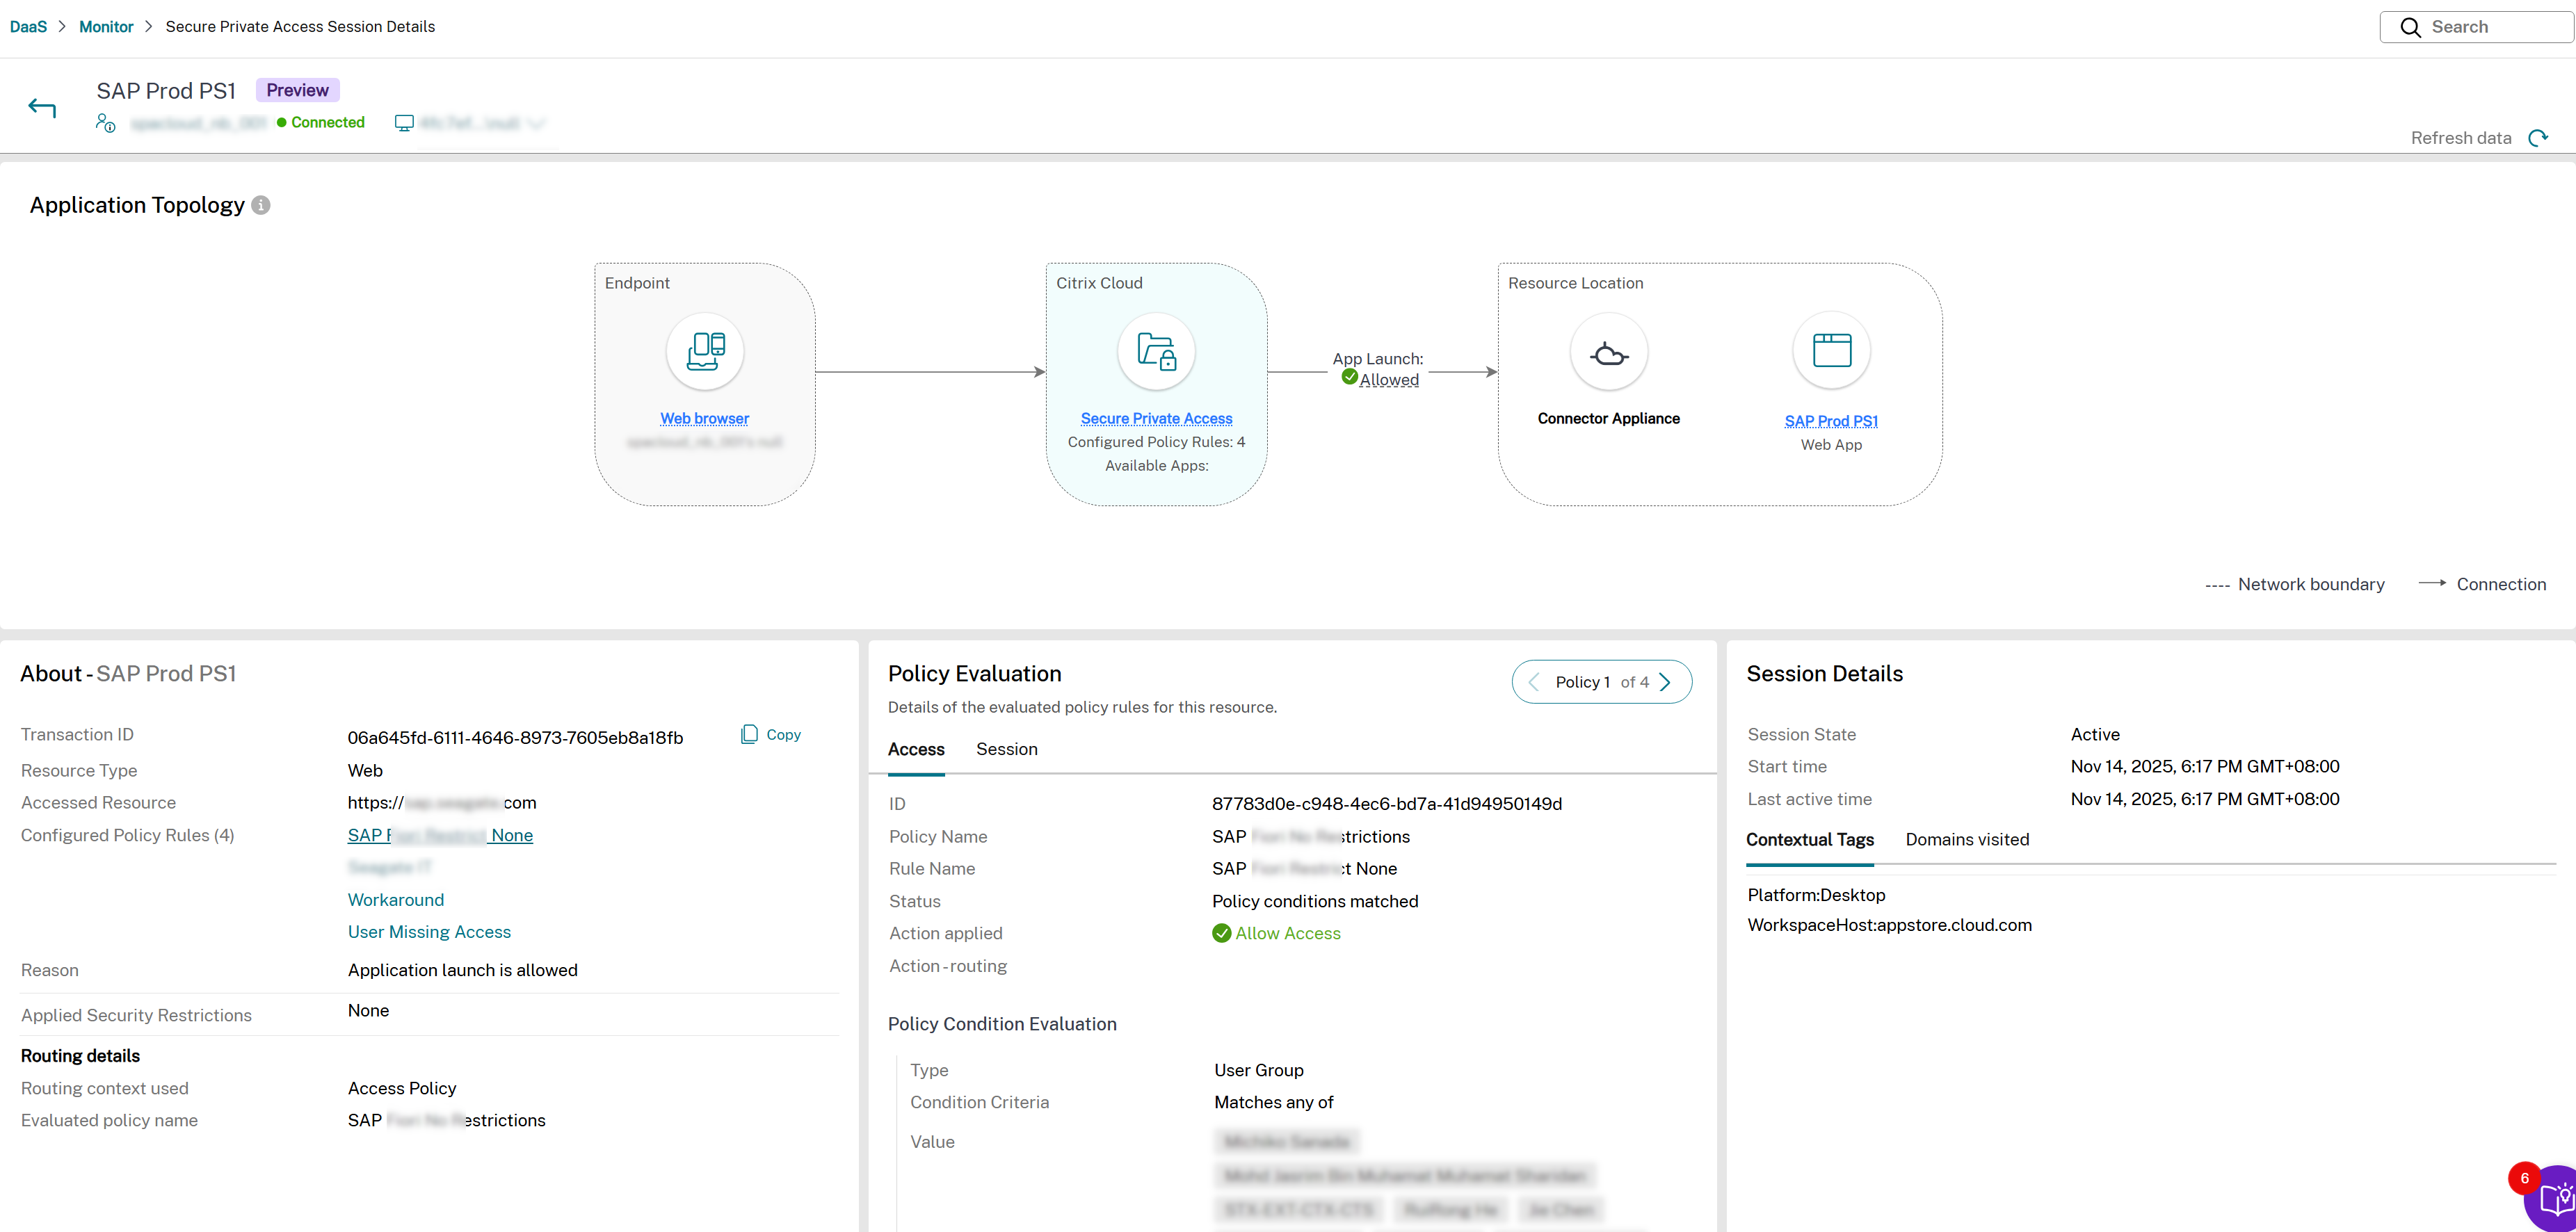
Secure Private Access Session Details page
A Secure Private Access Session Details page contains the following four panes:
-
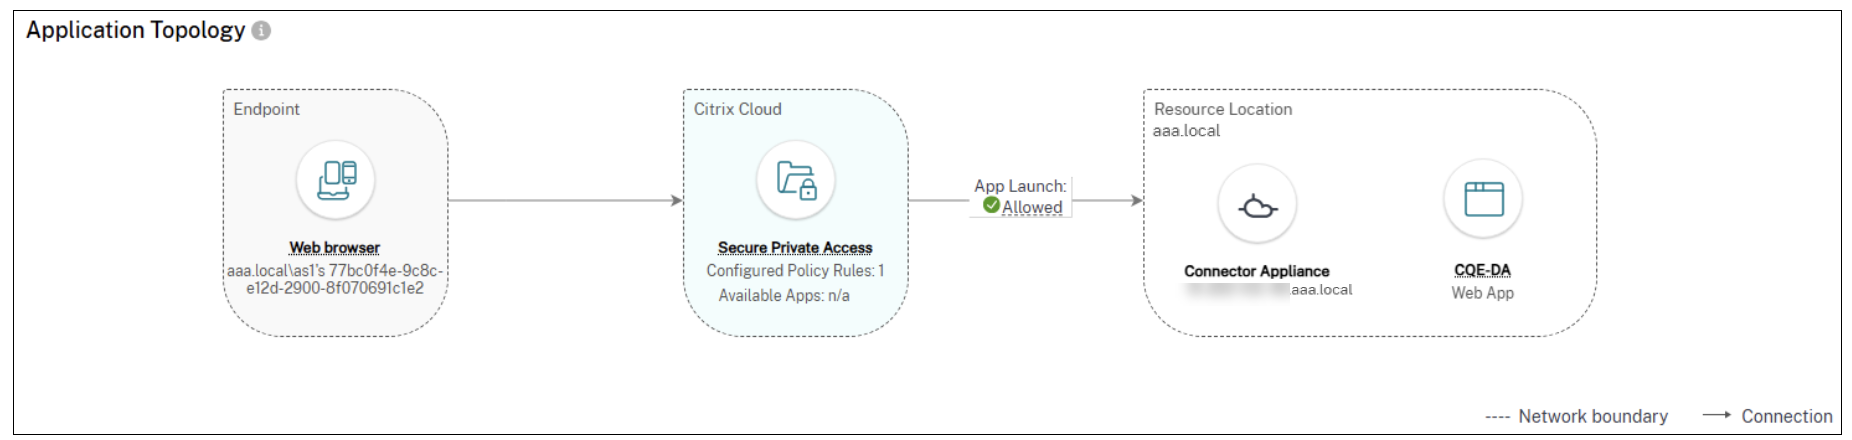
Application topology: Provides the flow of the app launch process. Also, provides complete details about the app. The endpoint connects to the Citrix Gateway and Citrix Gateway connects to the Secure Private Access plug-in. Using the information from the Secure Private Access plug-in, the app is launched.
You can view the application topology of an app from the Available apps or Launched apps section of the Activity Manager. You can also view the application topology for the apps for which access is denied from the Denied Access tab.
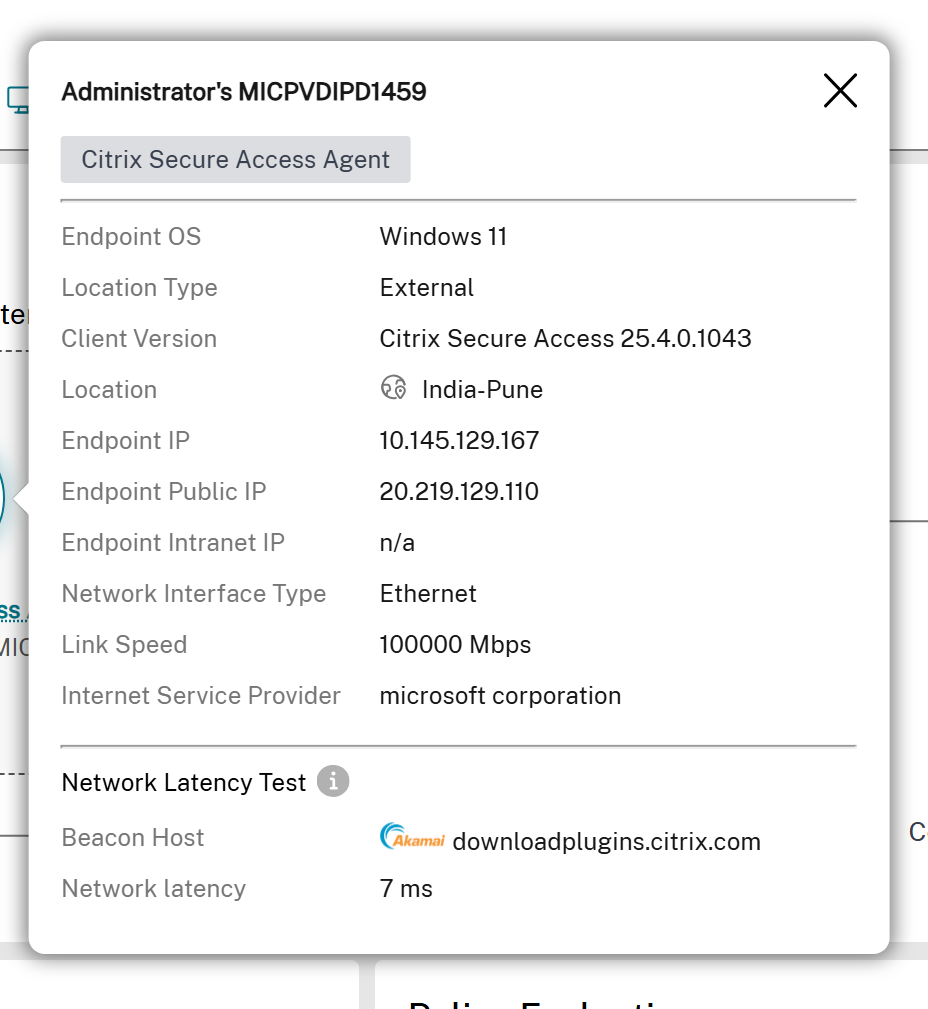
- Endpoint details: Displays key information about the client device and network used to access the application. Hover over Endpoint to view detailed information.
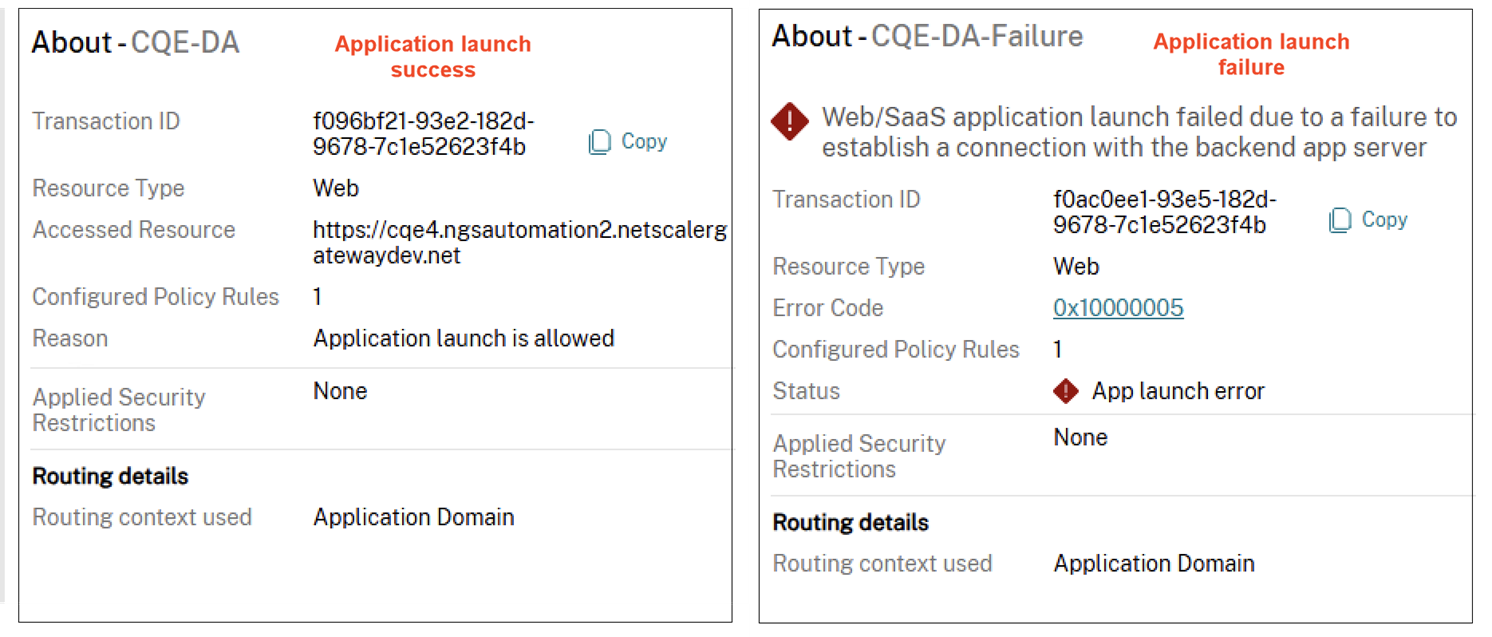
- About: Displays additional information regarding the Web/SaaS, TCP/UDP and agentless apps for both the successfully launched apps and the failed apps.
-
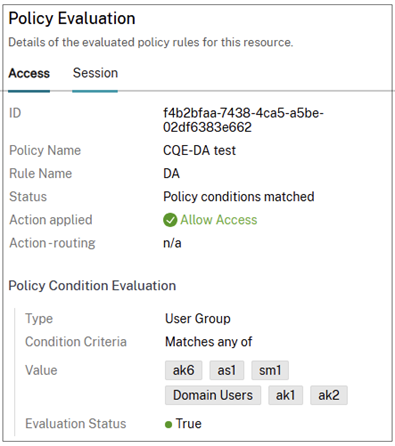
Policy Evaluation: Displays information related to the policy, such as rules, actions, and conditions in the Access and Session tabs.
- The access policy details can be viewed under the Access tab.
- The session policy details can be viewed in the Session tab.
- Session Details: Displays session details for a successfully established session. For a failed session, the reason for session failure is displayed.
- Hop by hop latency: Displays the latency details for each hop in the application topology. Help admins triage and isolate the performance /slowness issues on the multiple hops.
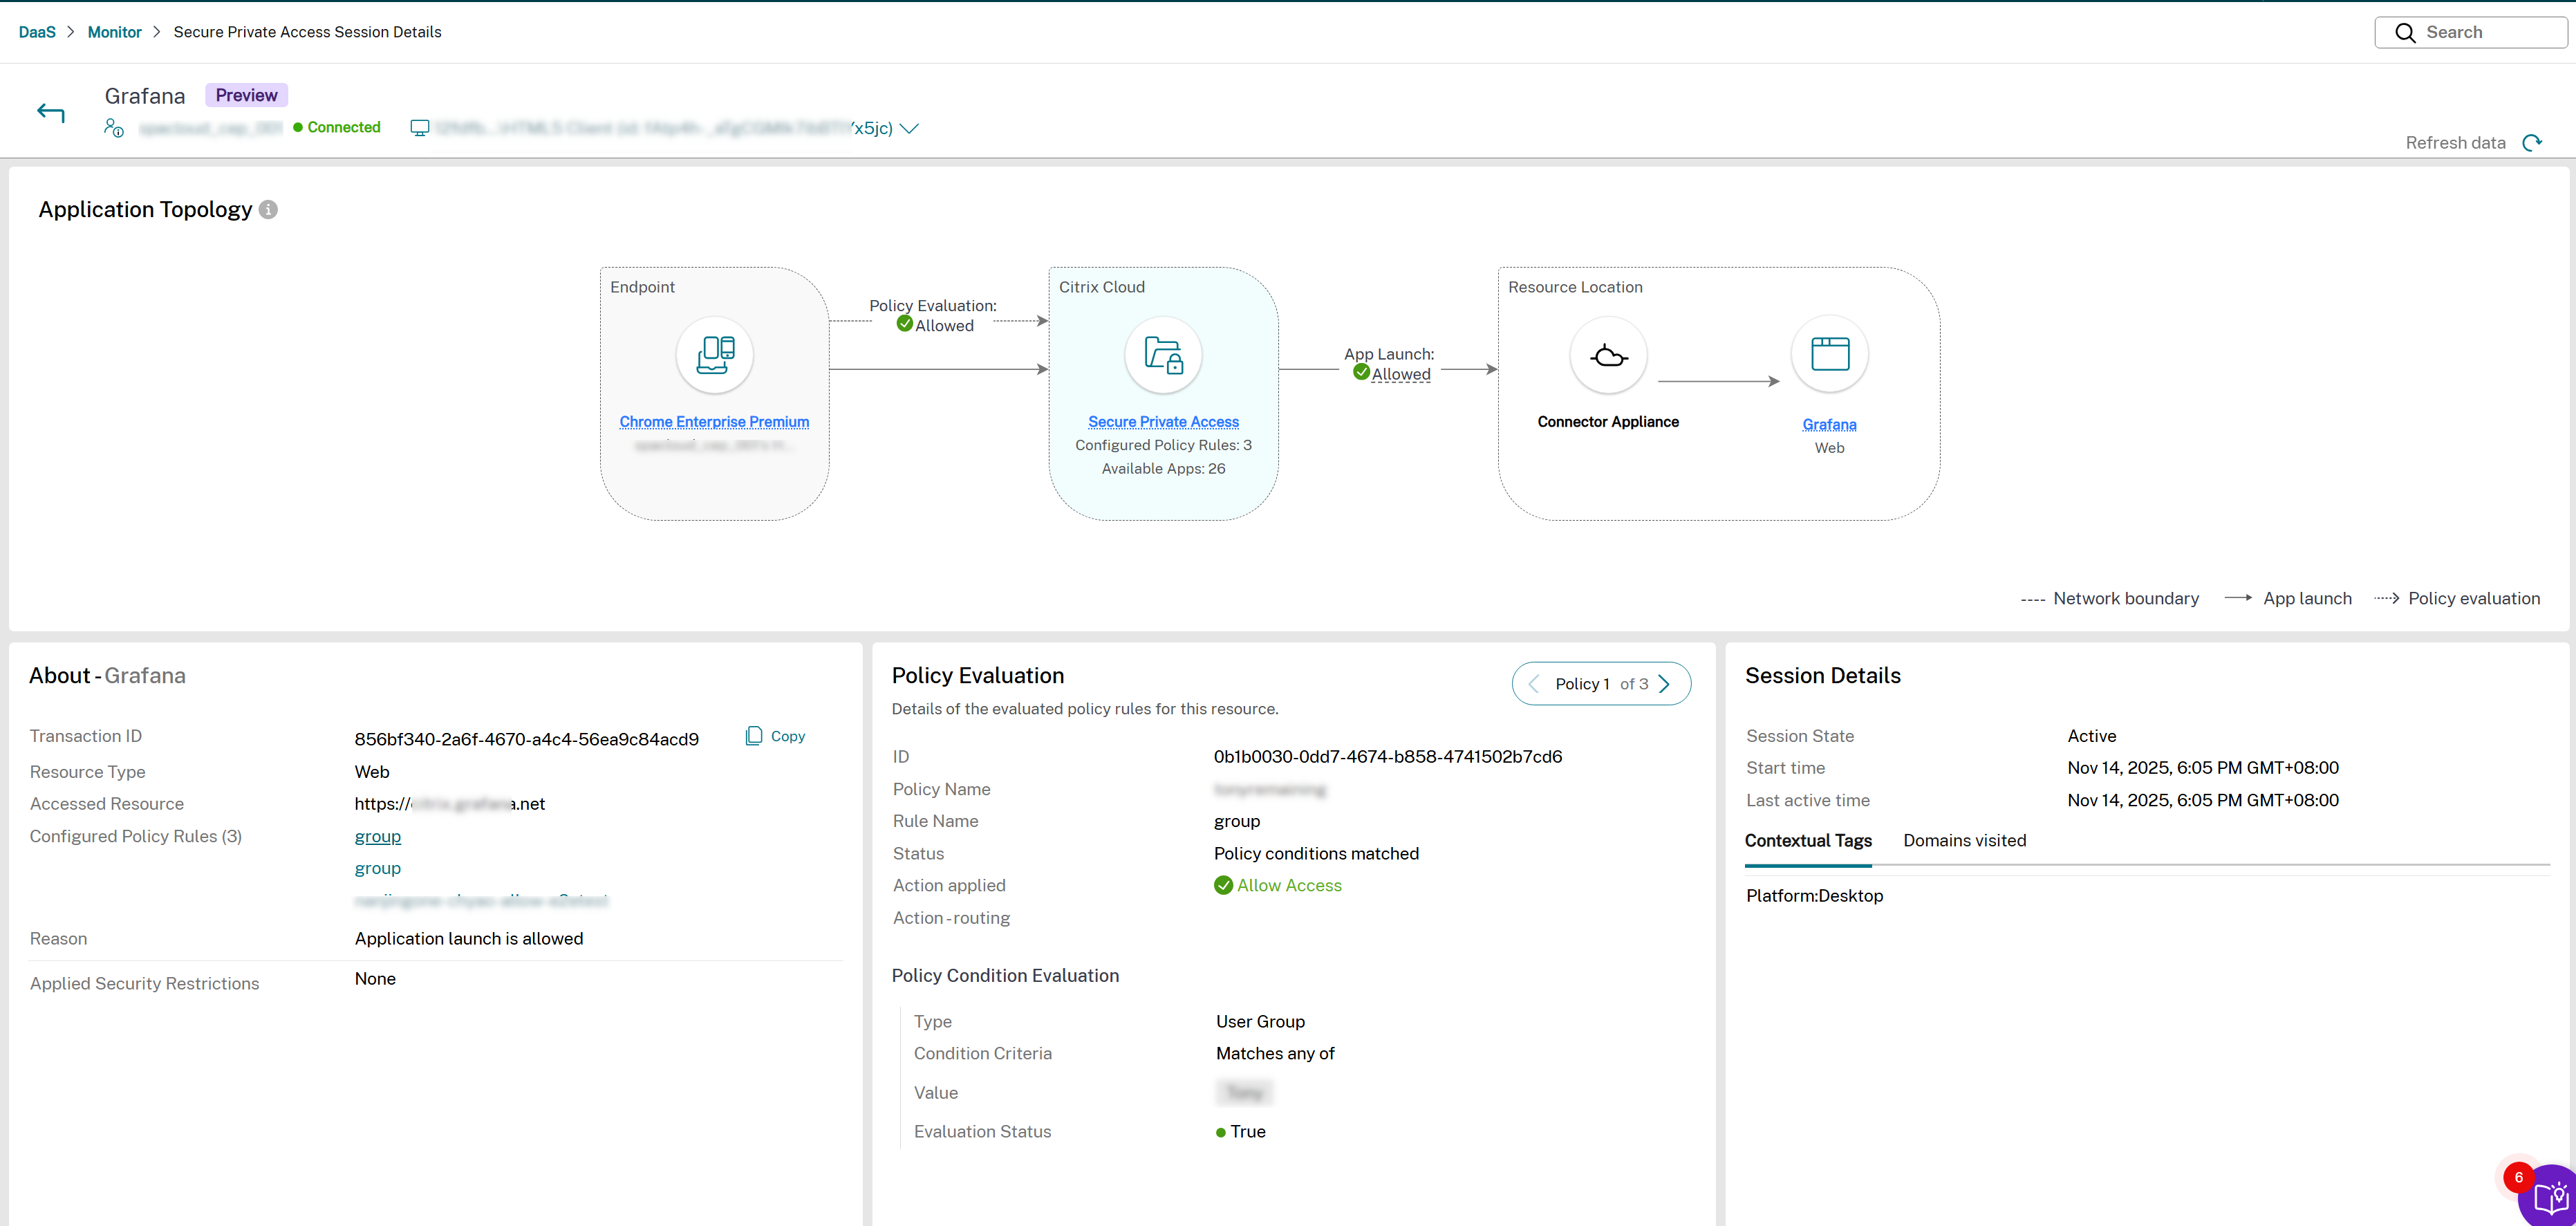
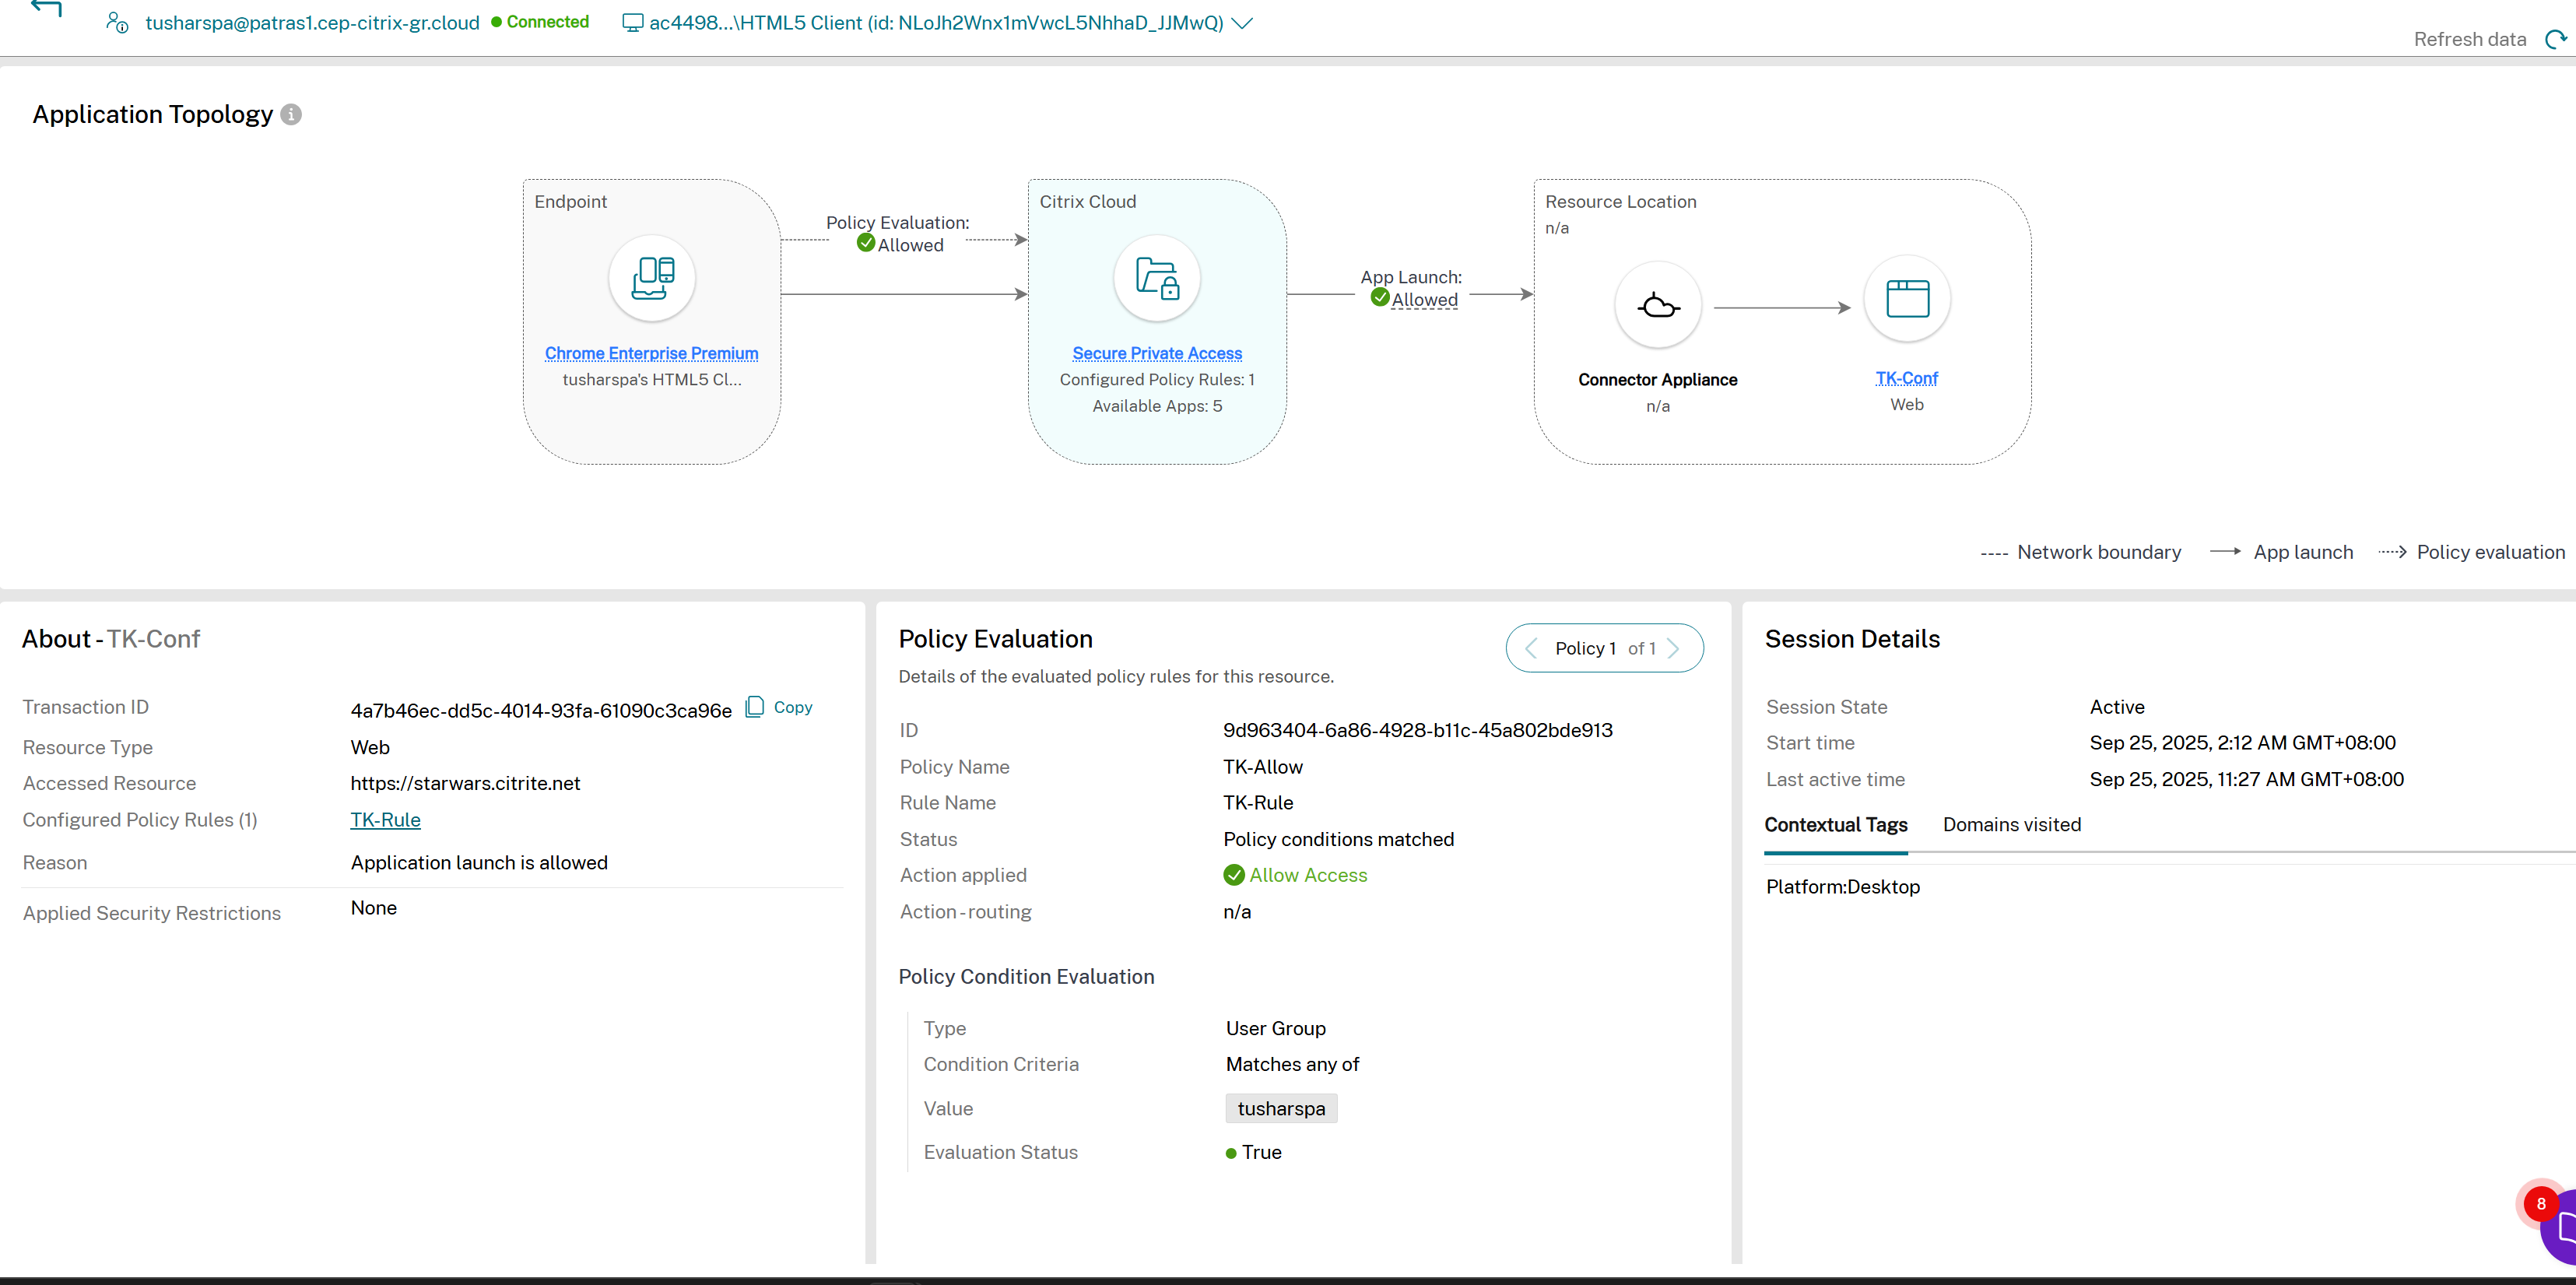
The following figure displays a sample Secure Private Access Session Details page for a successful app launch.
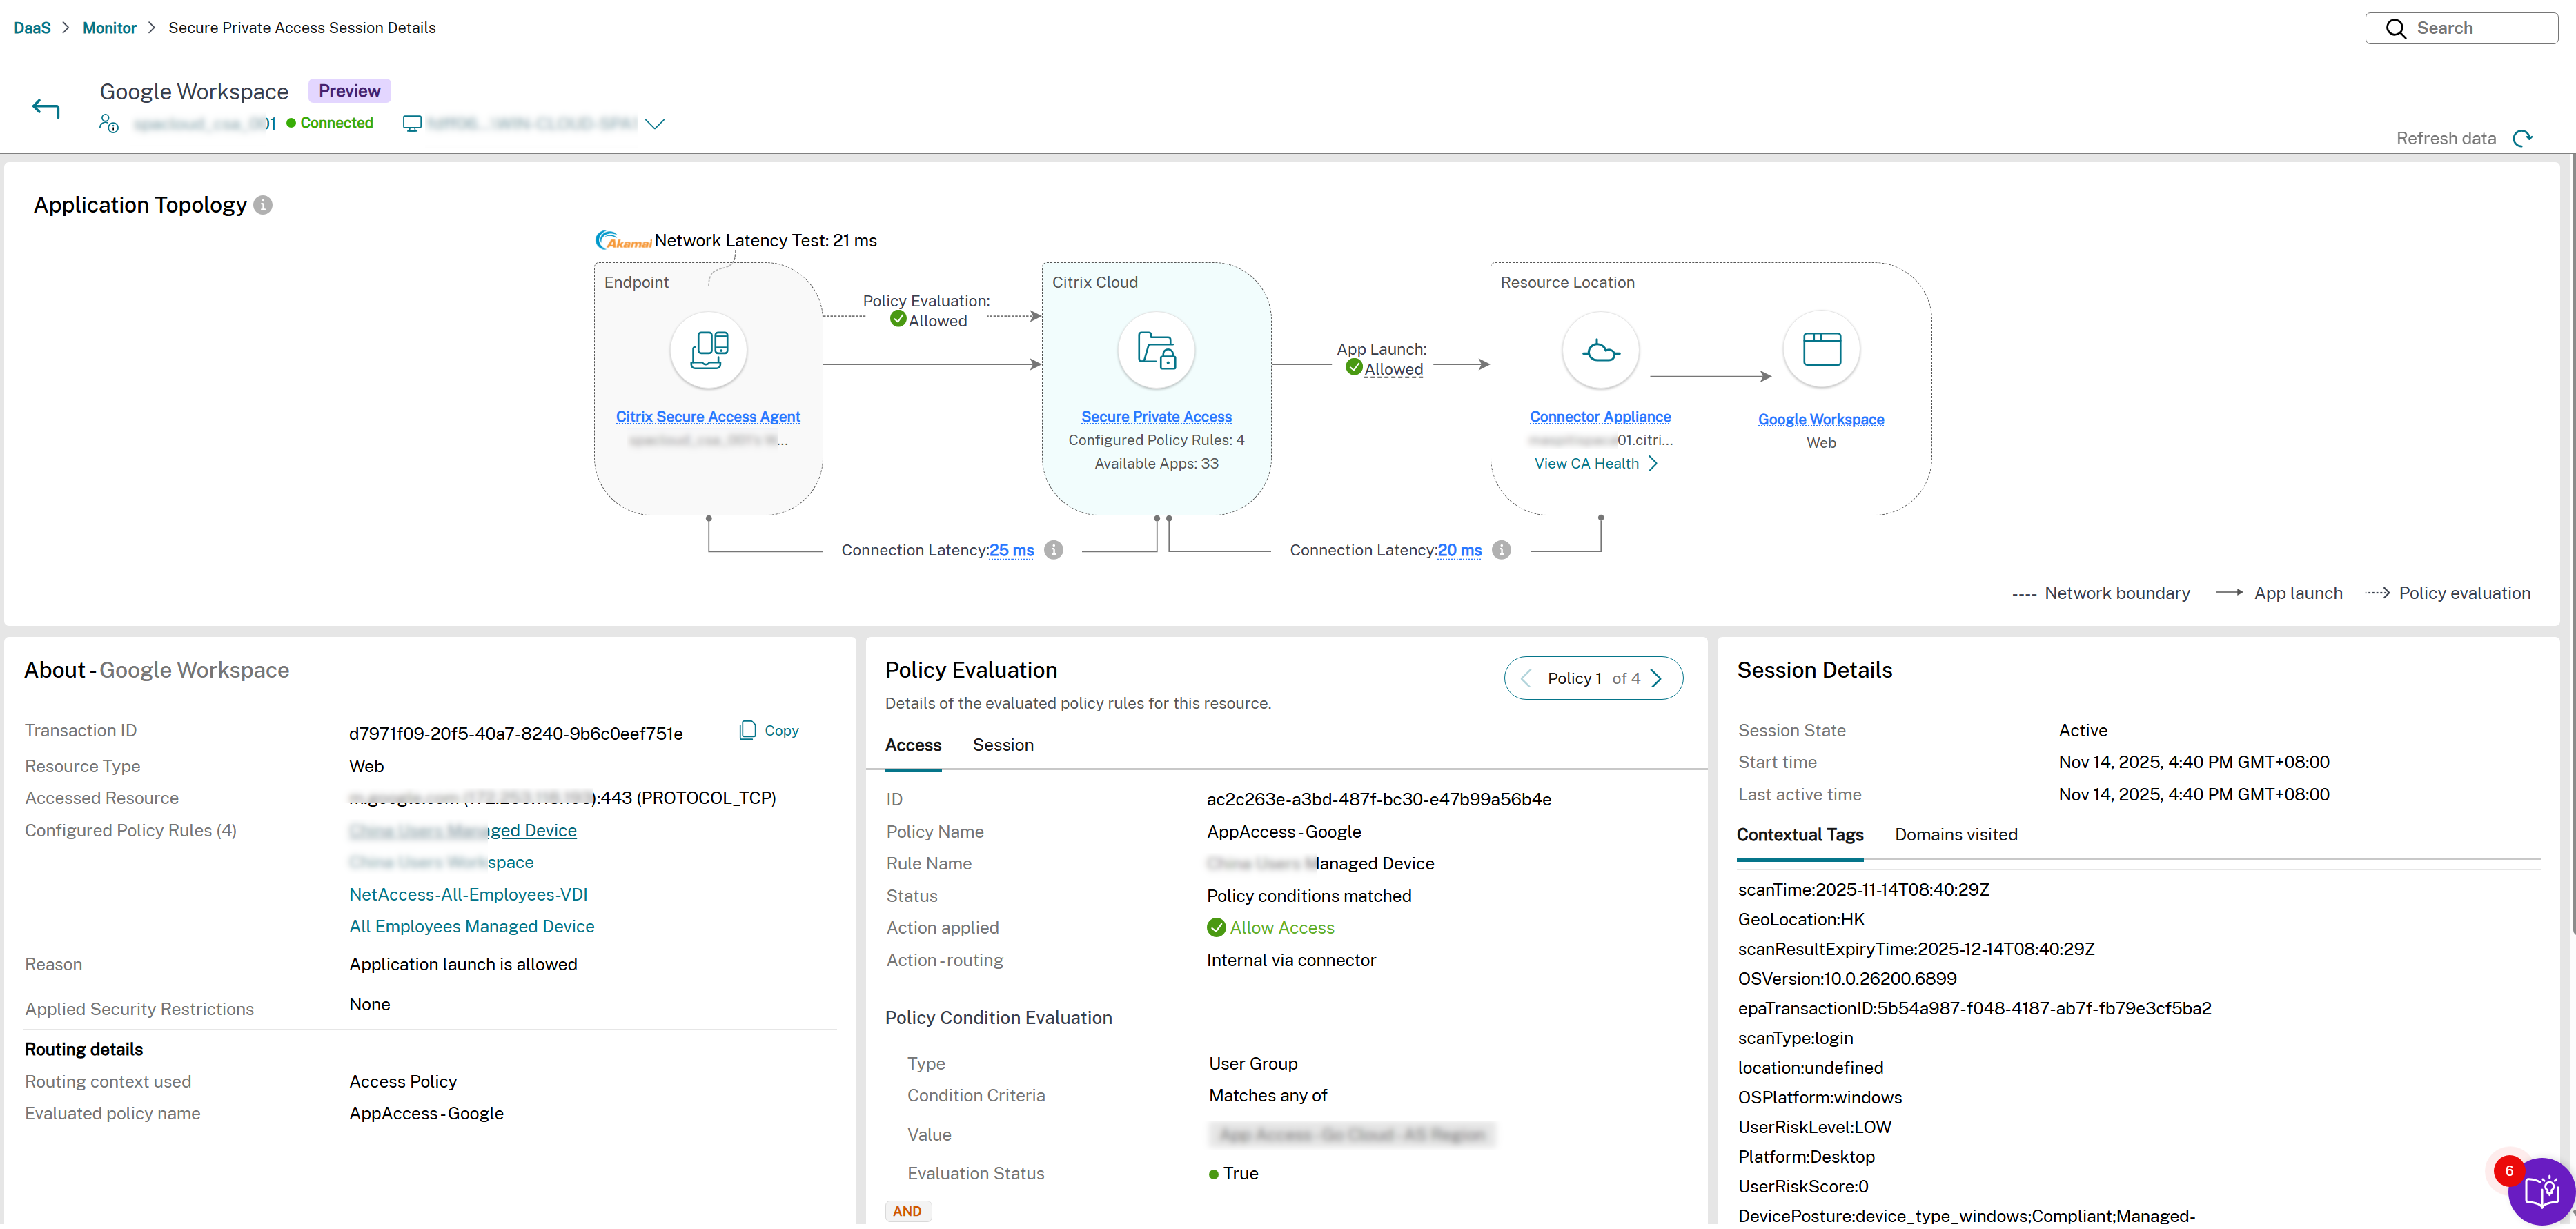
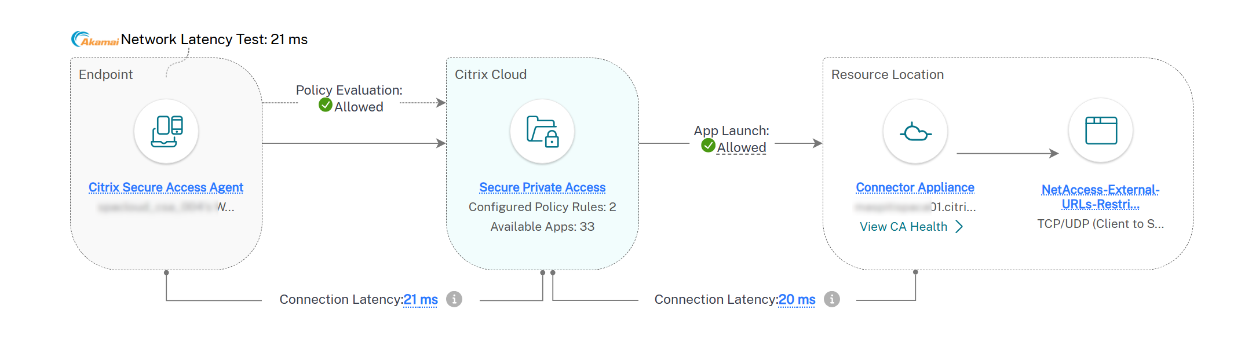
Application topology
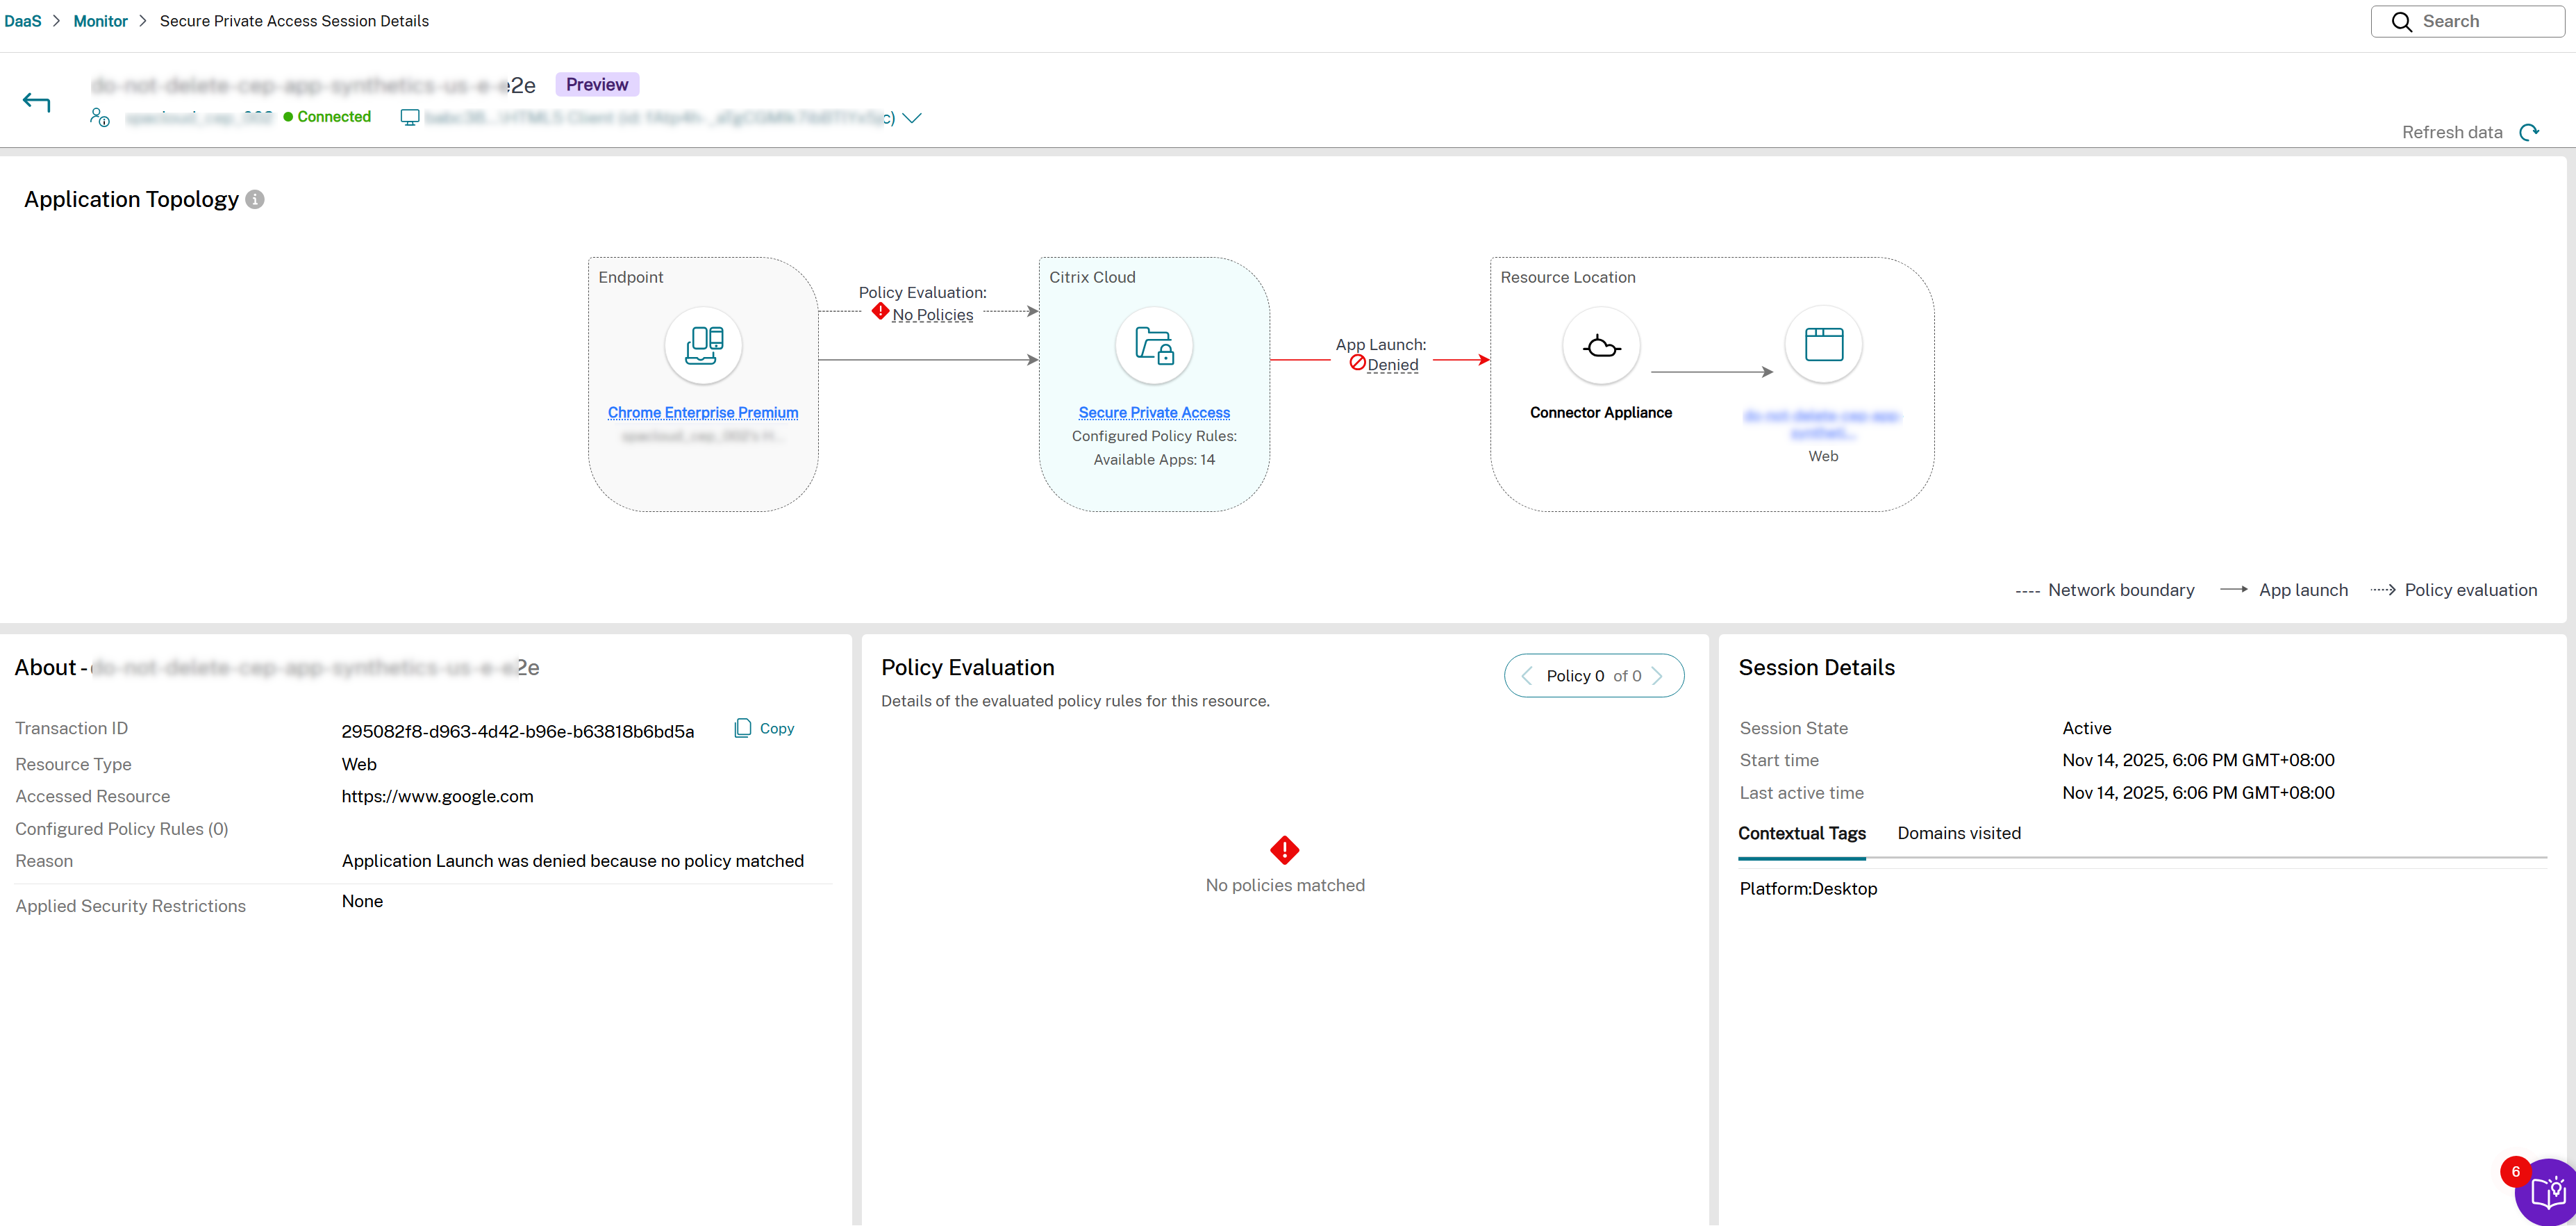
In a successful application launch scenario, the Application Topology represents the entire communication flow in a uniform color. Conversely, when an application launch fails due to issues such as a non-reachable Connector Appliance or an unavailable back-end server, Application Topology displays the specific segment of the flow where the failure occurs in a different color. For example, if the Connector Appliance is unreachable, the connection between Citrix Cloud™ and Resource Location might be highlighted in red indicating the failure.
The following figures display a sample application flow.
| Field name | Description |
|---|---|
| Endpoint | Displays the endpoint where the app is opened. The possible options are Citrix Workspace app and Citrix Secure Agent. The device ID is displayed. You can also view the endpoint OS, endpoint IP, location type, localtion and network details. |
| Citrix Cloud | Displays the number of enumerated apps and the number of configured policies. |
| Policy evaluation | Displays the result of the policy that is set on the Secure Private Access app. The possible values are Allowed, Denied, Access allowed with restrictions, and Error. |
| Public network | Displays the type of apps and the status of app launch. The possible value for app types is Web/SaaS app. Similarly, the possible values for app launch statuses are Allowed, Denied, Access allowed with restrictions, and Error. You can also view the top level URL, app type, and app publishing. |
| Resource Location | Displays the type of apps and the status of app launch. The possible value for app types is TCP/UDP app. You can also view the top level URL, app type, and app publishing. |
Endpoint details
Displays key information about the client device and network used to access the application. Hover over Endpoint to view detailed information.
The following figure displays a sample Endpoint details pane.
| Field name | Description |
|---|---|
| Endpoint OS | The operating system of the endpoint device. |
| Location type | The type of location from which the endpoint device is connecting. The possible values are Internal and External. |
| Client Version | The version of the Citrix Workspace app or Citrix Secure Access client installed on the endpoint device. |
| Location | The geographical location of the endpoint device based on its IP address. |
| Endpoint IP | The private IP address of the endpoint device. |
| Endpoint Public IP | The public IP address of the endpoint device. |
| Endpoin Intranet IP | The intranet IP address of the endpoint device. |
| Network Interface Type | The type of network interface used by the endpoint device. The possible values are Ethernet, Wi-Fi, Cellular, and Other. |
| Signal Strength | The signal strength of the network connection on the endpoint device, measured in dBm. |
| Link Speed | The speed of the network connection on the endpoint device, measured in Mbps. |
| Internet Service Provider | The name of the Internet Service Provider (ISP) for the endpoint device. |
| Beacon Host | The hostname of the beacon server used for connectivity checks. |
| Network Latency | The round-trip time for data packets to travel from the endpoint device to the beacon server and back, measured in milliseconds (ms). |
This information helps administrators identify the network path, troubleshoot connectivity issues, and correlate performance with specific endpoints. Fields are shown based on deployment type and available data.
About pane
Displays additional information regarding the Web/SaaS, TCP/UDP and agentless apps for both the successfully launched apps and the failed apps. In cases where an app fails, the About pane shows the corresponding error code. Clicking this code redirects you to a documentation page detailing the cause and workaround. For other issues, you are directed to the Citrix support page.
The following figure displays a sample About pane.
| Field name | Description |
|---|---|
| Transaction ID | Citrix Transaction ID generated during the session or enumeration. |
| Resource Type | Displays the type of the resource. The possible values are Web, SaaS, TCP/UDP (Server to Client), and TCP/UDP (Client to Server). |
| Accessed Resources
|
The data that appears in the Accessed Resources field varies depending on the app type. |
| SaaS apps - URL or the app FQDN | |
| TCP/UDP – IP address/FQDN, port, and protocol | |
| Web app (launched via Citrix Secure Access client) - FQDN, port, and protocol | |
| Web app (launched via Citrix Workspace) - URL | |
| Agentless apps - URL of the application | |
| Configured Policy Rules | The number of policies that are used within a session or enumeration. |
| Reason | The result of the analysis of the session or enumeration activity. |
| Applied security restrictions | Displays the security restrictions that are enforced on this app. |
| Routing context
|
Displays the policy type (access policy, session policy, or application domain) applied during routing. The routing context helps identify the hierarchy (access policy > session policy > default application domain) influencing routing decisions. |
| For session policy, the View details link provides additional details about the session policy. |
Policy Evaluation pane
Displays information related to the policy, such as rules, actions, and conditions in the Access and Session tabs. The access policy details can be viewed under the Access tab. The session policy details can be viewed in the Session tab.
| Field name | Description |
|---|---|
| ID | Citrix transaction ID |
| Policy Name | The name of the policy that is associated with the application. If there are multiple policies, the first policy that is matched with the set condition appears. |
| Rule name | The rule name configured within the policy. |
| Status | Results of the policy evaluation |
| Action applied | The action applied on the application based on the policy evaluation results. For example, deny access. |
| Action routing | Displays the routing path (Direct, Internal via connector, Internal via gateway) that a user’s request takes through the Secure Private Access service. |
| Type | The type of the policy condition. |
| Condition Criteria | The condition criteria of the policy applied in the session or during enumeration. |
| Value | Results of the condition evaluation. |
| Evaluation status | Status of the policy condition evaluation result. The different values are Allowed, Denied, Access allowed with restrictions, and Error. |
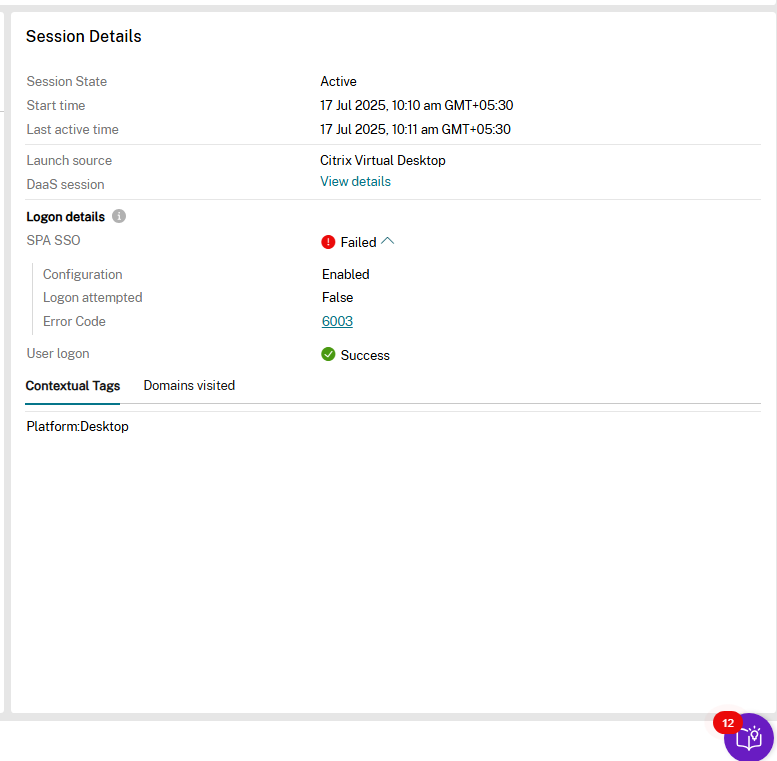
Session Details pane
For a failed session, the reason for session failure is displayed. For a successful session, additional details related to the session are displayed.
The Session Details pane remains empty for apps clicked from the Available Apps tab, as app enumeration is not associated with a session.
| Field name | Description |
|---|---|
| Session state | Displays the state of the session whether it is active or inactive. |
| Start time | Displays the session start time. |
| Last active time | Displays the last active time of the successful session. |
| Launch source | Displays the source from where the Secure Private Access session is launched. |
| DaaS Session | Displays details of the DaaS session. This field appears only in case of a single session or multi-session VDA. |
| Logon details | |
| SPA SSO | Displays whether the single sign on to Secure Private Access session is success or failure.If failed, user has to login manually. |
| Configuration | Displays the configuration status of single sign on to Secure Private Access session. If not configured, the details will be shared to the admin. |
| Logon attempted | Displays the logon attempt status of single sign on to Secure Private Access session. |
| Error code
|
Displays the error code when the logon attempt of single sign on to Secure Private Access session is failed. The possible error codes are: 6007 and 6003. |
| 6003- Error retrieving the Secure Private Access single sign-on handle from the Broker Agent service. | |
| 6007- Failed to login to Secure Private Access. | |
| User logon | Displays the manual user log on status to Secure Private Access session. |
| Gateway Virtual IP
|
Displays the virtual IP address of the gateway to which the successful session is connected. |
| This field is applicable only for hybrid data path deployment. | |
| Contextual Tags | Displays the contextual tags. The contextual tag on the Secure Private Access plug-in is the name of a NetScaler® Gateway policy (session, preauthentication, EPA) that is applied to the sessions of the authenticated users. |
| Domains visited (Internal) | Displays the internal domains accessed using the successful session. |
| Domains visited (External)
|
Displays the external domains accessed using the successful session. |
| The Domains Visited field is applicable only for the Web/SaaS apps and is updated only after 15 minutes, as the Citrix Enterprise Browser clients on macOS and Windows send session activity every 15 minutes. | |
Note:
The Session Details column pane remains empty for apps clicked from the Available Apps tab, as app enumeration is not associated with a session.
Hop by hop latency
The latency details for each hop in the application topology are displayed over each path.
This information helps admins triage and isolate the performance/slowness issues on the multiple hops.
Note:
- Hop-by-hop latency information is only available for apps launched via Secure Access Client version V25.7.1.x or later.
- Latency information from the client to SPA is displayed for the last hour only. If the session has not been active within the past hour, no data will be shown.
Sample topology diagrams for the various apps
Web/SaaS apps - Success scenario:
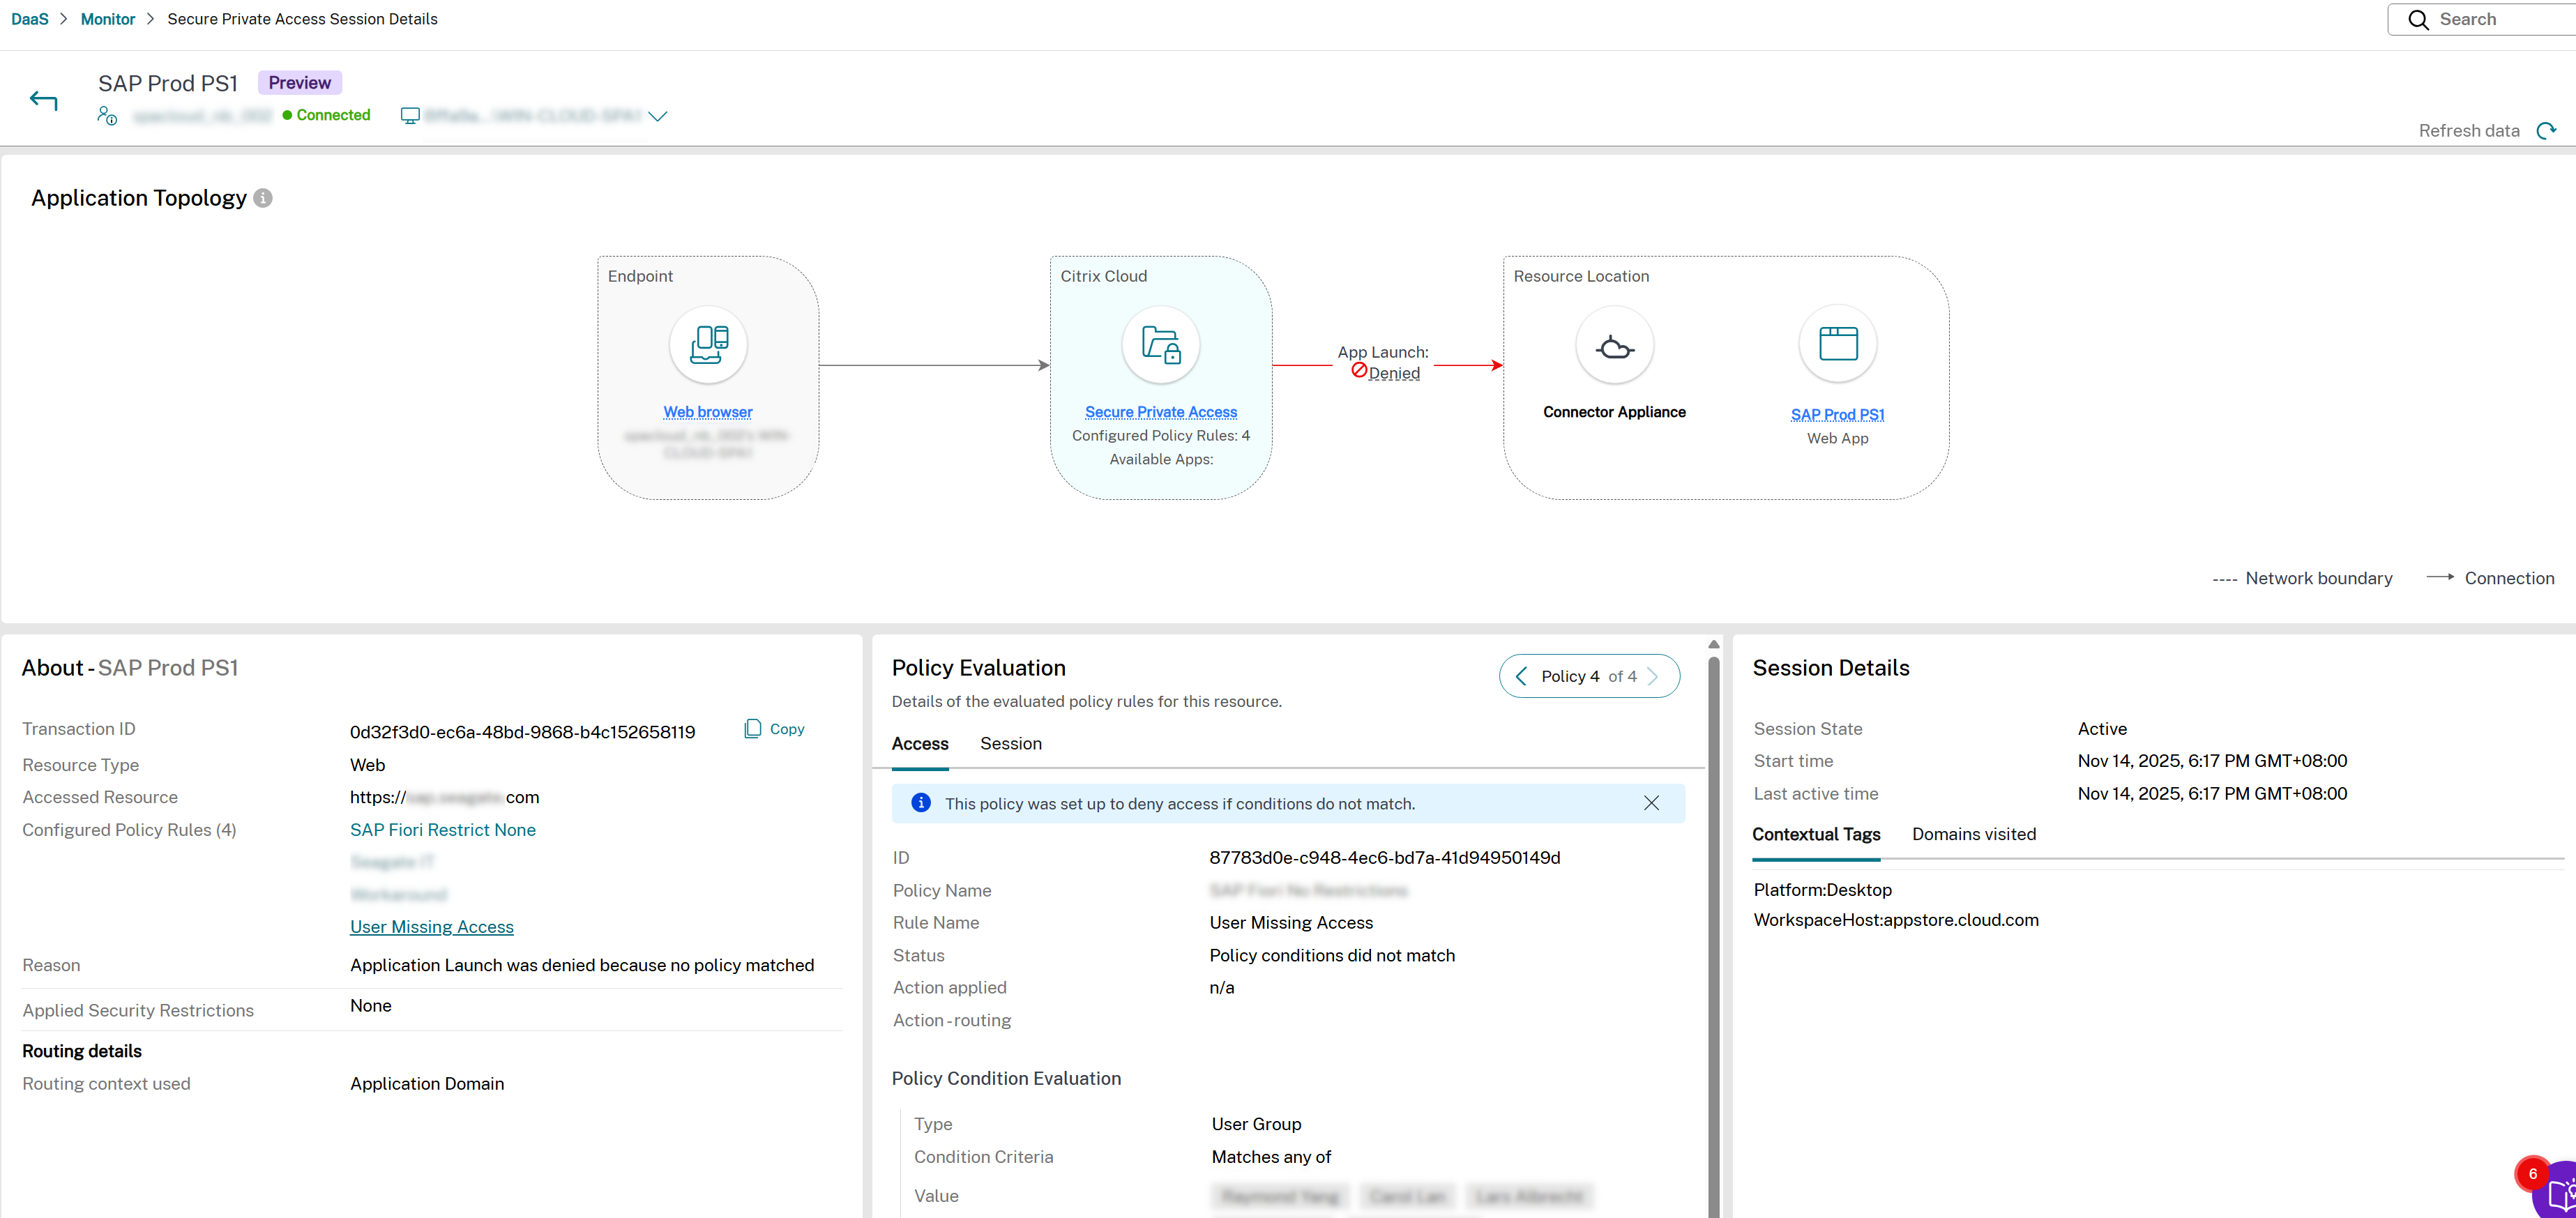
Web/SaaS apps - Failure scenario:
Agentless apps - success scenario:
Agentless apps - Failure scenario:
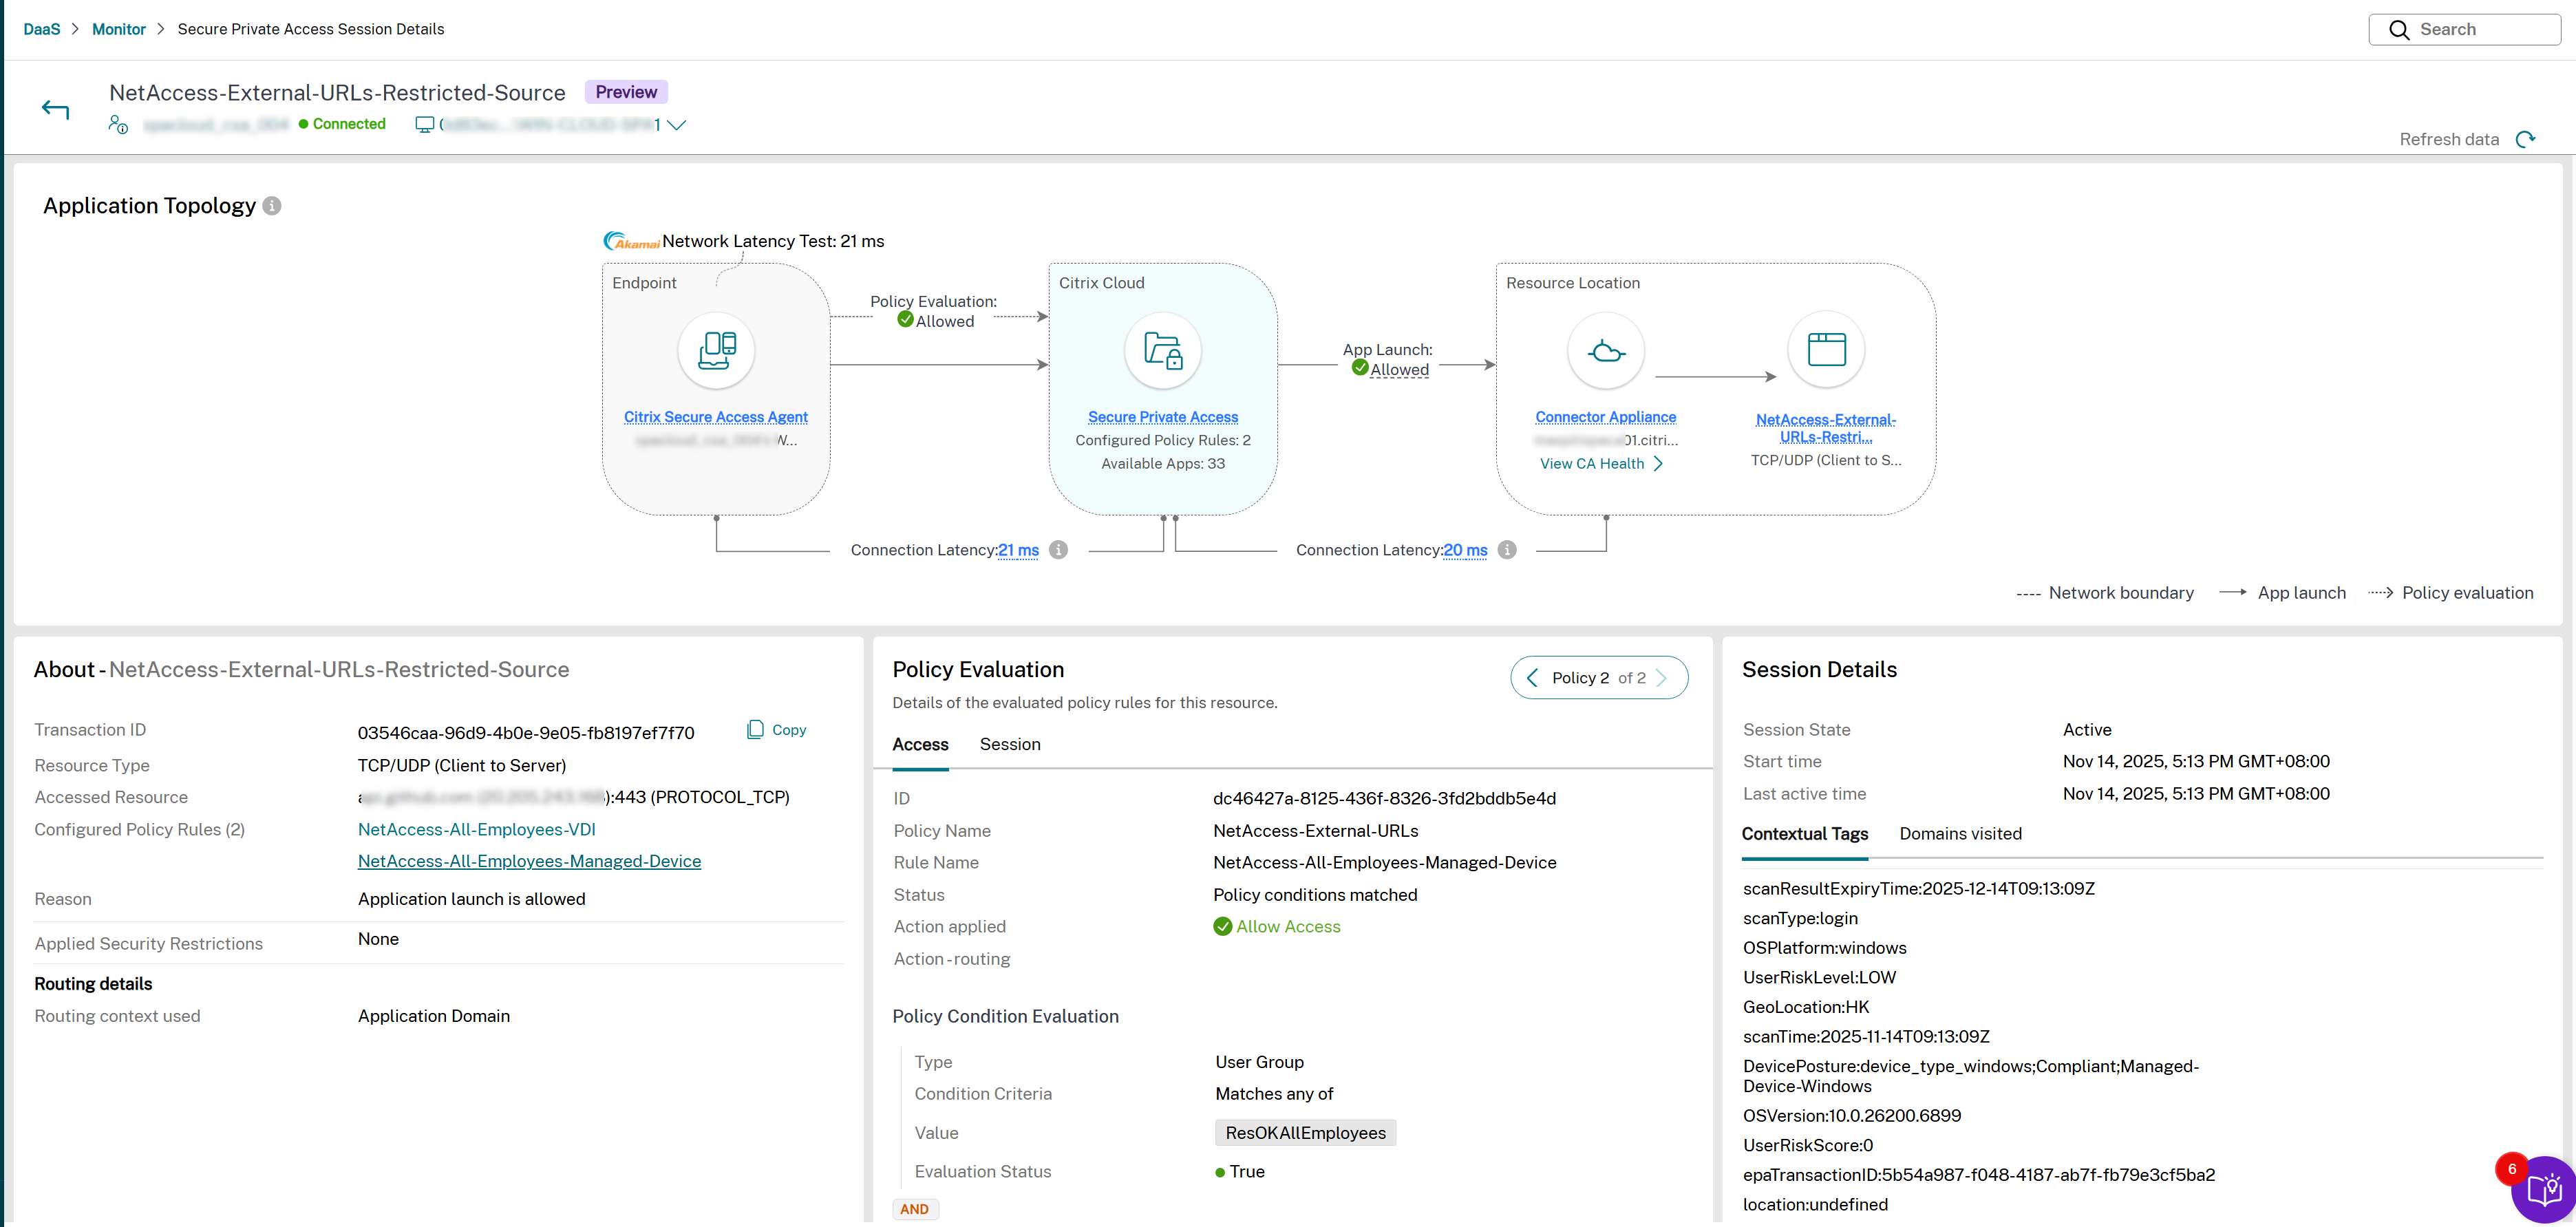
TCP/UDP apps - success scenario:
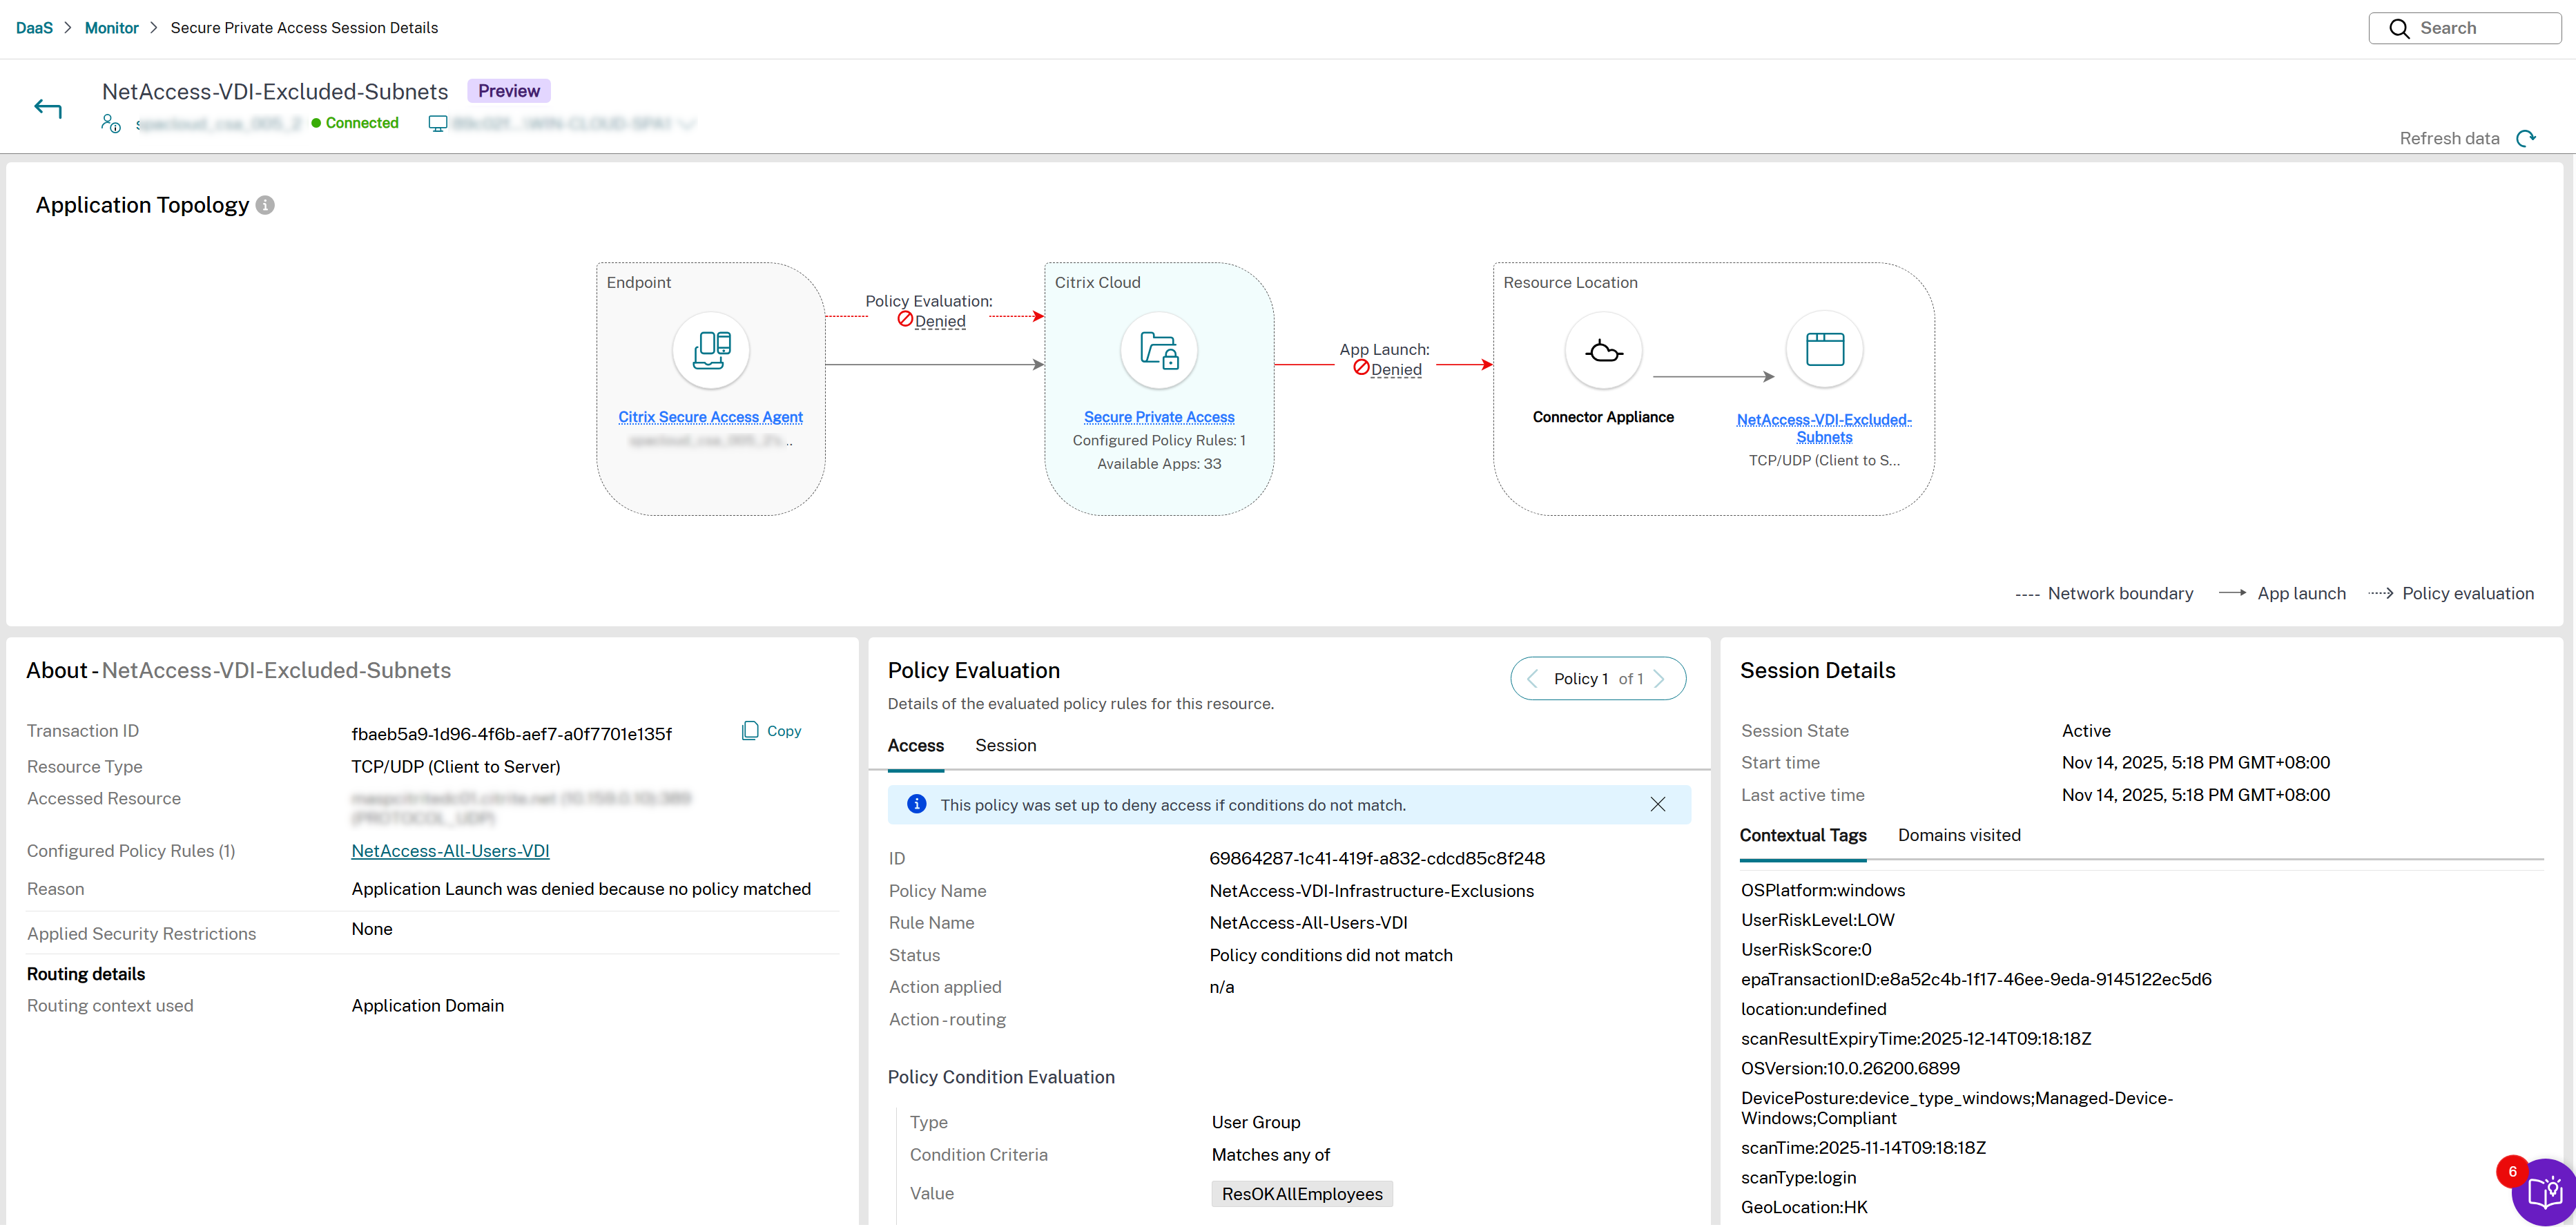
TCP/UDP apps - Failure scenario:
Hybrid deployment:
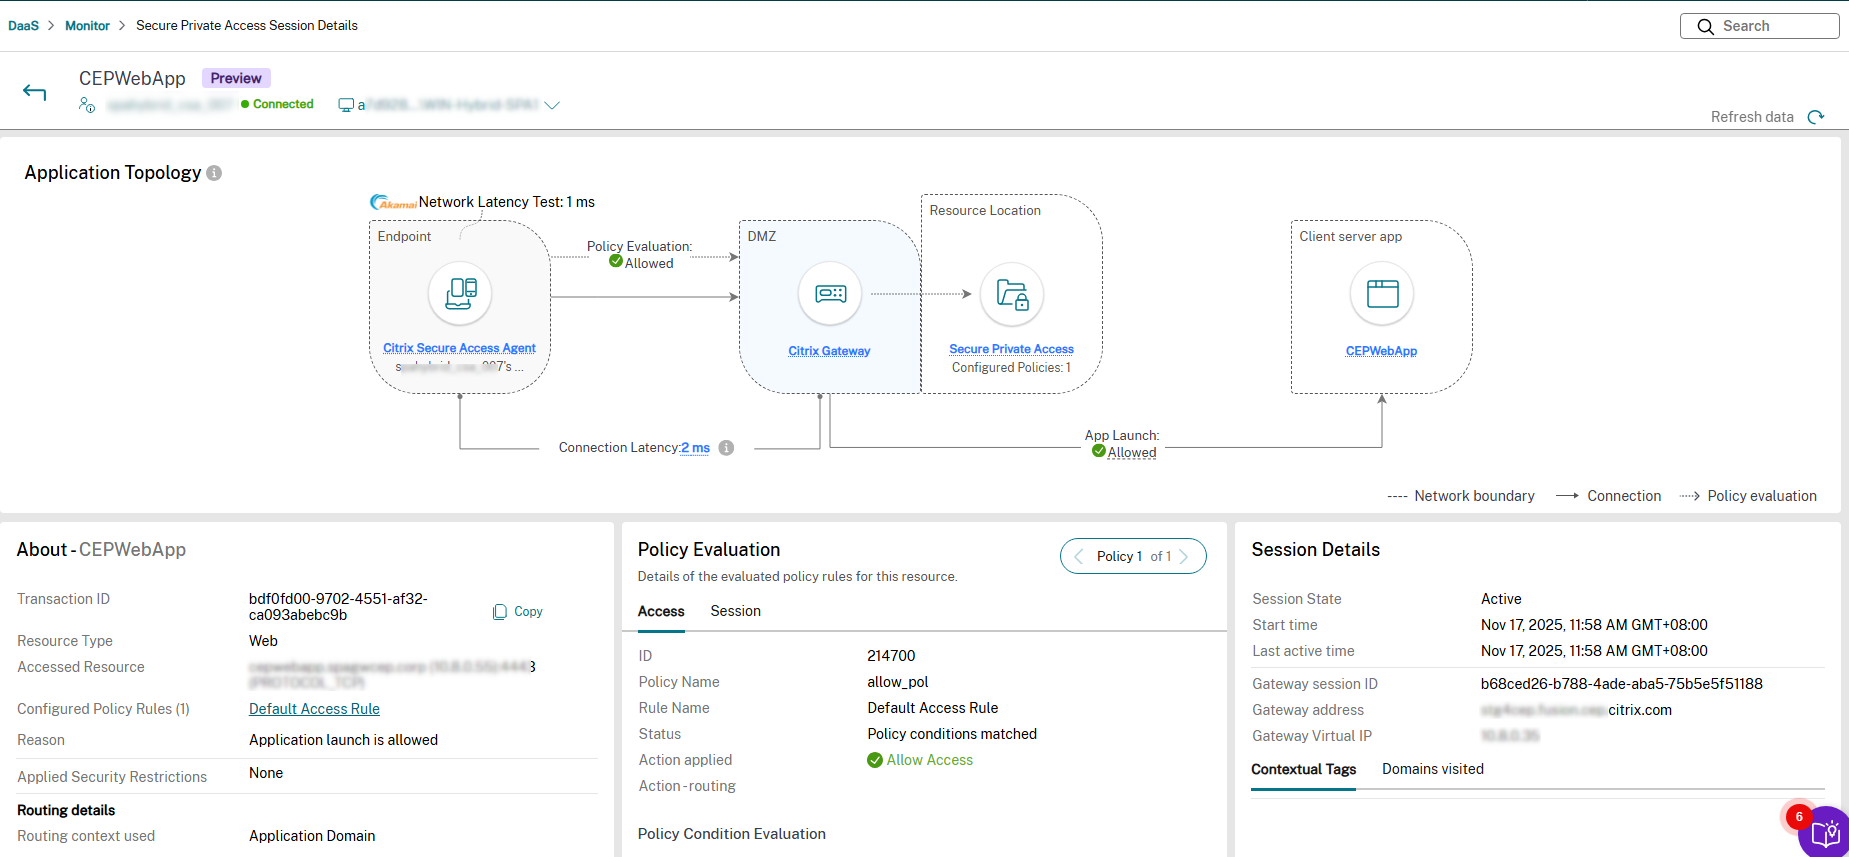
Chrome Enterprise Premium Web/SaaS apps - success scenario:
Chrome Enterprise Premium Web/SaaS apps - Failure scenario:
Create and manage alerts
You can set up alerts for proactively monitoring conditions and scopes of interest to you and reduce alert fatigue. Alerts can be configured with severity, re-alert intervals, notification mediums, and follow the alert lifecycle supported in the product.
For more information, see the following:
Support for Chrome Enterprise Premium
Secure Private Access integration with Monitor supports Chrome Enterprise Premium (CEP), enabling comprehensive monitoring and troubleshooting of Web/SaaS app sessions launched using Chrome Enterprise across devices.
Key features:
- User session search and filtering: Search and filter CEP user sessions across devices using the Client Type filter on the Filters page.
- Session activity review: View session activity, user profile enumerations, and app launches for CEP users.
- Session details and topology: Access the Session Details panel to review app launch transaction topology, including backend components (SPA PoP, Connector Appliance, and Client).
- Access policy triage: Analyze access policy outcomes, including denial errors, for CEP sessions.
- Visibility across Filters page: View detailed CEP session and application data, including launch errors, directly in the topology workflow.
- Domain and launch data collection: Collect and display data on domains visited (internal, external, direct, and bookmarked access) and app launch events.
- Session lifecycle visibility: Monitor session lifecycle, heartbeats, and events with up to 7 days of historical data.
- Data parity: Ensure consistent data and visibility for all launch scenarios—Citrix Workspace app, CEP direct, SPA hybrid, and SPA cloud deployments.
Note:
To monitor and troubleshoot Web/SaaS app sessions launched using Chrome Enterprise, ensure that you have the Chrome Enterprise Premium license. For more information about Chrome Enterprise Premium, see Chrome Enterprise.
View a session launched using Chrome Enterprise Premium in Filters page
You can search for the Chrome Enterprise Premium sessions from the Filters page, where the Client Type filter is available to locate specific sessions launched using Chrome Enterprise Premium.
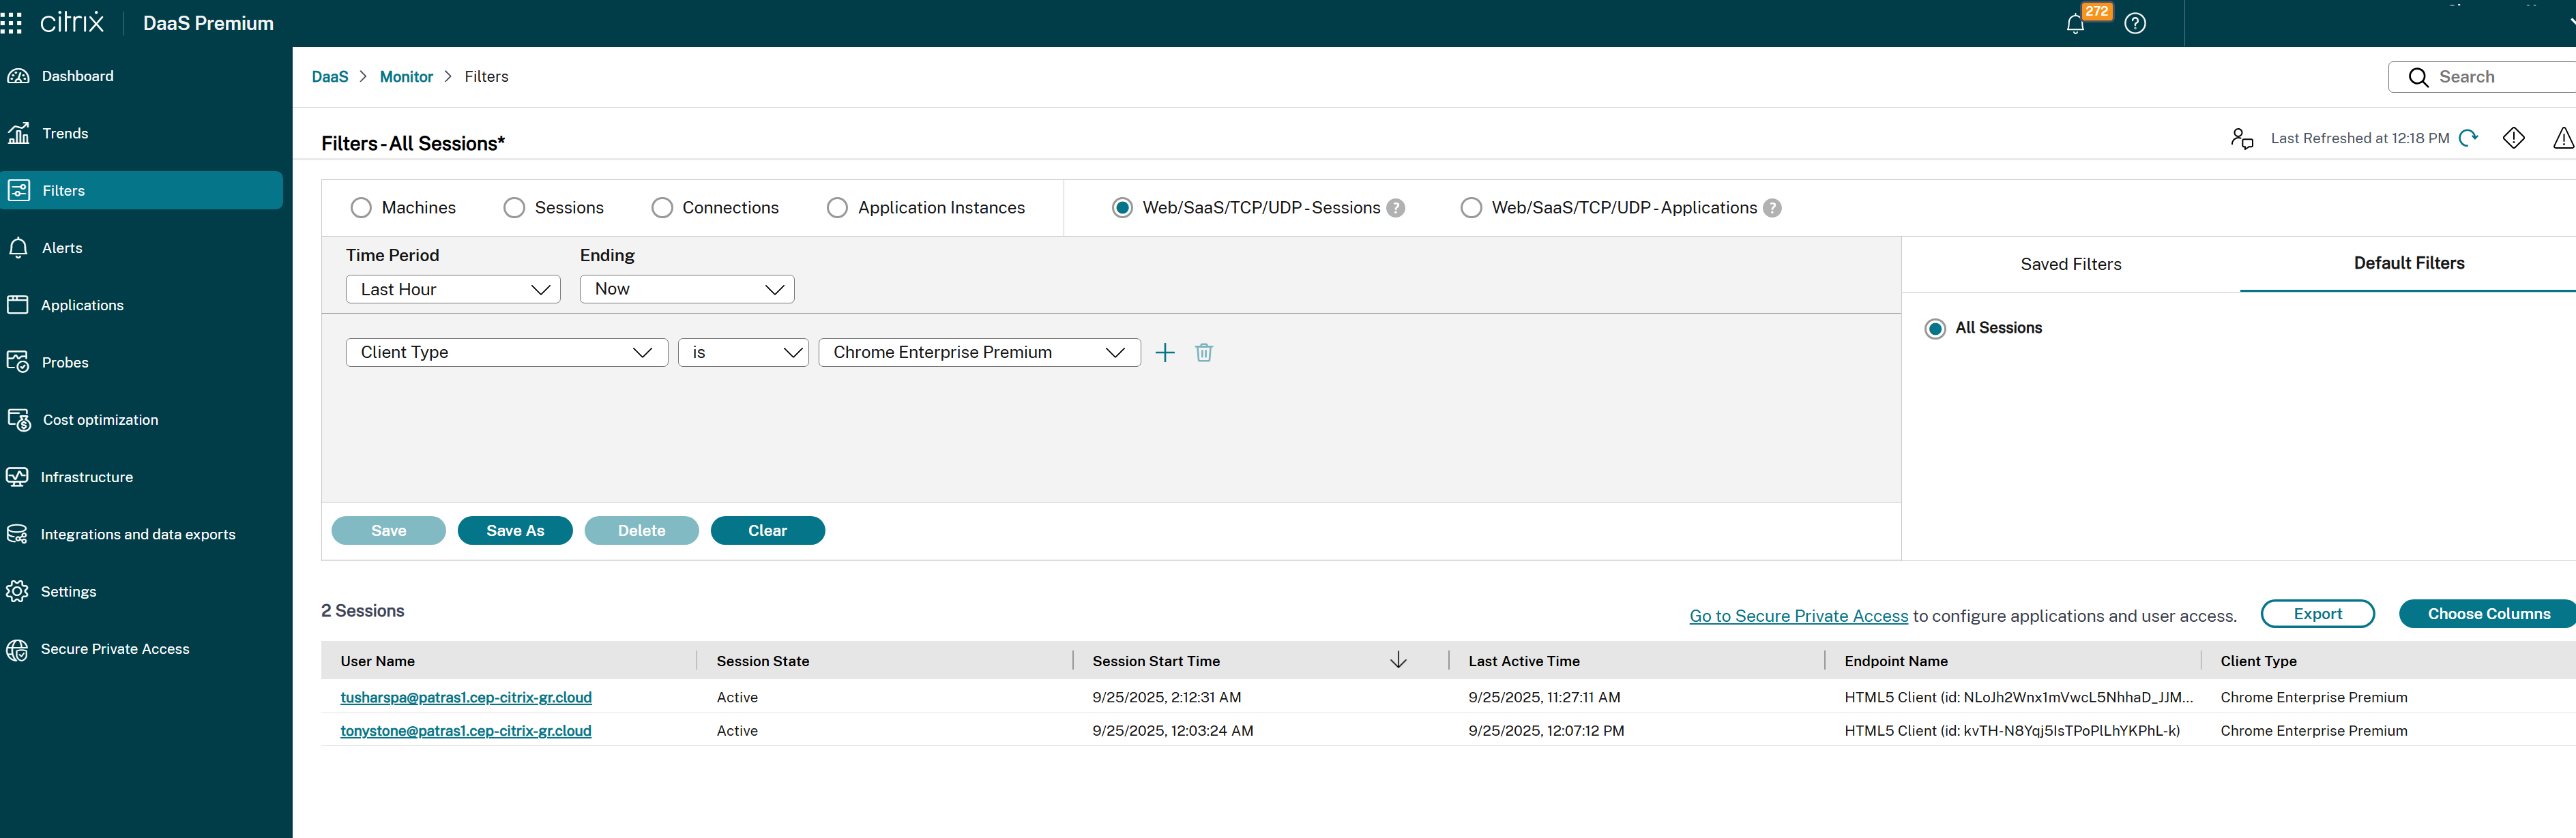
The Activity Manager Page provides a complete view of app launch transactions, access policy outcomes, and launch errors, along with domain visited data and session lifecycle events.
Observability for multi-session VDA
The observability for multi-session VDA feature enhances the monitoring and troubleshooting capabilities for Secure Private Access sessions within a multi-user VDA environment. This feature empowers Citrix Helpdesk Administrators to monitor Secure Private Access sessions, troubleshoot issues, and gain insights into app launches and user transactions in case of a multi-session VDA.
Key features:
- Enhanced observability: Administrators can monitor Secure Private Access sessions, including app launches and enumerations, within the Citrix Director interface. This includes detailed views of enumeration and app launch issues.
- User context tracking: The feature maintains user context for apps accessed in a shared VDA environment, ensuring accurate session data visibility for each user.
- Error insights: Captures and displays Single Sign-On (SSO) failures, error codes (e.g., 6003, 6007), and troubleshooting steps to resolve issues.
- Session search: Administrators can search for sessions, apps, and user transactions using the same workflow as for VDI sessions and apps.
- Cross-session navigation: Enables navigation between Secure Private Access sessions and VDA sessions for streamlined troubleshooting.
Supported scenarios:
- Multi-user VDA environment: Supports multiple concurrent user sessions accessing internal apps, SaaS apps, and web apps through the Citrix Secure Access client.
- Single session Desktop: Extends the same functionality to single-session desktops for consistent observability across environments.
Error handling:
- Error Code 6003: Error in retrieving the Secure Private Access single sign-on handle from the Broker Agent service.
- Error Code 6007: Failed to login to Secure Private Access.
- Troubleshooting Guidance: Provides detailed error descriptions and links to troubleshooting steps within the Citrix Monitor.
For more information, see Citrix Secure Access client failed to do SSO in the Citrix Secure Private Access documentation.
Requirements:
- Citrix Secure Access Version: Requires Citrix Secure Access version 25.2.1.18 or later for Windows.
- DaaS Service: The DaaS service must be accessible for troubleshooting Secure Private Access sessions using Citrix Monitor.
- CAS Deployment: CAS deployment must be available in the Citrix Cloud region where the customer is onboarded.
- The Citrix Secure Access agent is auto-installed and provisioned on the VDI.
- Secure Private Access sessions are initiated for internal web apps, TCP/UDP apps, and SaaS apps routed through internal connector appliances.
The Observability for multi-session VDA feature provides administrators with powerful tools to monitor, troubleshoot, and manage Secure Private Access sessions in a multi-user VDA environment. By offering detailed insights and streamlined workflows, this feature enhances the overall management experience and ensures efficient resource utilization.
In this article
- Service entitlements
- Supported clients
- How to access Monitor
- Session definitions
- View a Secure Private Access session by user
- Activity Manager for Secure Private Access session
- Secure Private Access Session Details page
- Sample topology diagrams for the various apps
- Create and manage alerts
- Support for Chrome Enterprise Premium
- Observability for multi-session VDA