Troubleshoot
Log collection
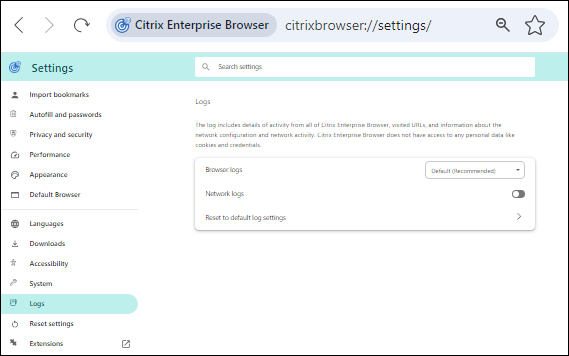
You can collect details about browser activity and network configuration by navigating to Settings > Logs. The log collection level is set to Default, which is the recommended value.
Windows:
- Right-click the Citrix Workspace™ app icon in the notification area and select Advanced Preferences.
- Select Log Collection. The Log collection dialog appears.
- Select one of the following log levels:
- Low
- Medium
- Verbose
- Click Start collecting logs and at the same time reproduce the issue to collect the related logs.
- Click Stop collecting logs after the issue is reproduced.
- Click Save log to save the collected logs.
The following Enterprise Browser logs appear in the Citrix Enterprise Browser™ folder:
-
CitrixEnterpriseBrowser_debug.log- Available based on the Browser logs level that you’ve selected in the Citrix Enterprise Browser settings. -
CitrixEnterpriseBrowser-netlog.json- Available if you have enabled Network logs in the Citrix Enterprise Browser settings.Note:
- The default path that contains the log files is
C:\Users\<user_name>\AppData\Local\Citrix\CitrixEnterpriseBrowserV2\User Data\Logs.
- The default path that contains the log files is
macOS:
- Open Citrix Workspace app and go to Preferences > Advanced > Logging.
- Select one of the following session log levels:
- Disabled (Default)
- Connection diagnostics
- Full
- Select one of the following store log levels:
- Disabled (Default)
- Normal
- Verbose
Note:
- The default path that contains the log files is
~/Library/Application\ Support/Citrix\ Receiver/Citrix\ Enterprise\ Browser/logs.
- Click Email Log Files to email the logs as a compressed file.
Error codes
Citrix Enterprise Browser prevents users from opening Web or SaaS apps when any unusual activity is noticed. Based on the type of activity, an alert with one of the following error codes might appear.
An end user can do the following troubleshooting steps:
- Collect the logs for the session and save the file.
- Close the browser and start the Web or SaaS app.
- Contact your organization’s administrator with the error code to troubleshoot further.
The administrator can open a support case and share the logs if the issue persists.
Here is the list of error codes:
| Error code | Description |
|---|---|
| PS1001 | Failed to fetch the policy document. To troubleshoot, check the address, gateway settings, your network connection and try again. |
| PS1002 | Failed to parse the policy document. |
| PS1003 | Failed to parse the legacy policy document. |
| PS1004 | The certificate obtained to validate the policy document is empty. |
| PS1005 | Failed to validate the fields in the policy document. |
| PS1006 | Failed to validate the signature of the policy document. To troubleshoot, an administrator can verify if the end user’s device time is in sync with the network time. |
| PS1007 | Failed to validate the certificate using the root certificate authority. |
| PS1008 | Failed to fetch the certificate to validate the policy document. |
| PS1009 | Failed to determine the store environment. |
| PS1010 | Failed to fetch the policy document. To troubleshoot, an administrator can close the browser and open again. |
| PS1011 | Failed to fetch the policy document because of the expired token. |
| APPP-01 | The website requires the App Protection component to be enabled. However, the App Protection service isn’t running on the system. |