Connector Statistics
The Connector statistics page provides a comprehensive view of the resource consumption on the selected connector during the last 24 hours. This information helps administrators correlate high CPU, memory, or bandwidth usage occurrences on the connector with session failures and experience across the sessions.
The page displays the synthetic latency calculated from the connector to the Gateway PoPs in your virtual apps and desktops environment. This information helps you choose and configure the closest Gateway PoP to achieve the optimum session experience.
Note:
Connector Statistics are not available for sessions connected using the Rendezvous protocol. This is because the Rendezvous protocol allows machines to bypass the Citrix Cloud Connectors to connect directly and securely with the Citrix Cloud control plane. For more information, see Rendezvous protocol.
Accessing the Connector statistics page
Click the connector name link from the Self-service view for Sessions.
Using the Connector statistics page
The Connector Statistics page displays usage statistics of connector resources-bandwidth, CPU, and memory in a single view. This helps corelate the usage pattern of connector resources with high latency and poor session performance occurrences.
The latency values from Connector to Gateway PoPs help you choose and configure the closest Gateway PoP to achieve the optimum session experience.
The Connector Statistics page displays data for the last 24 hours, by default. However, data is available for the last 14 days. To choose a different 24 hour period, use the calendar. Data is displayed for the last 24 hours from the time you choose.
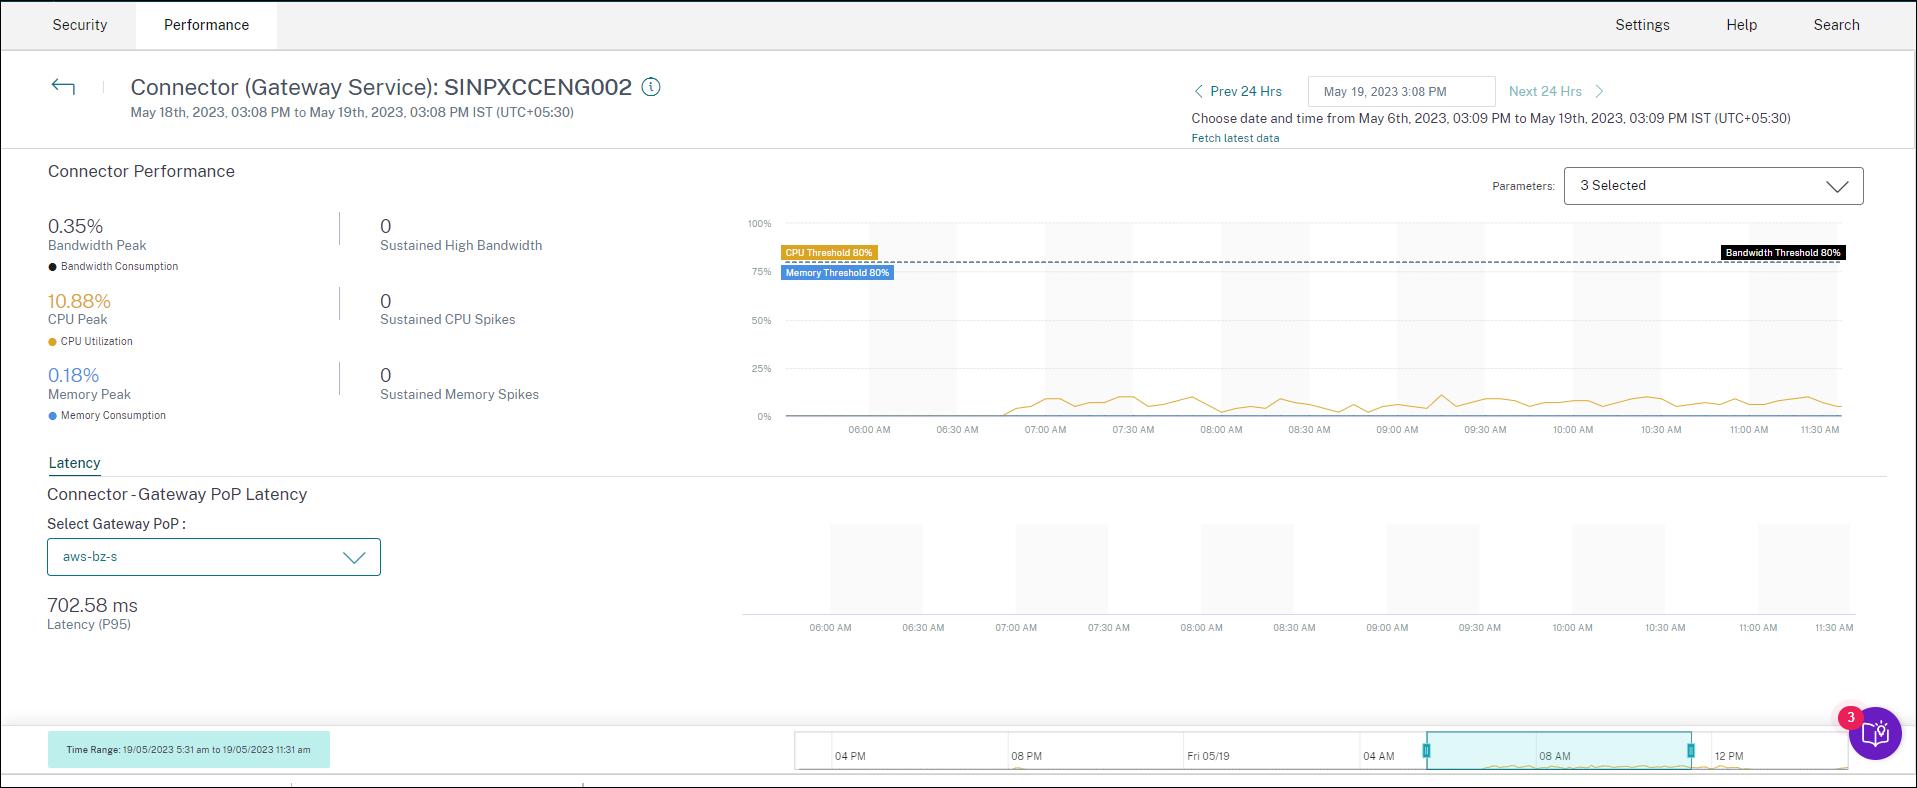
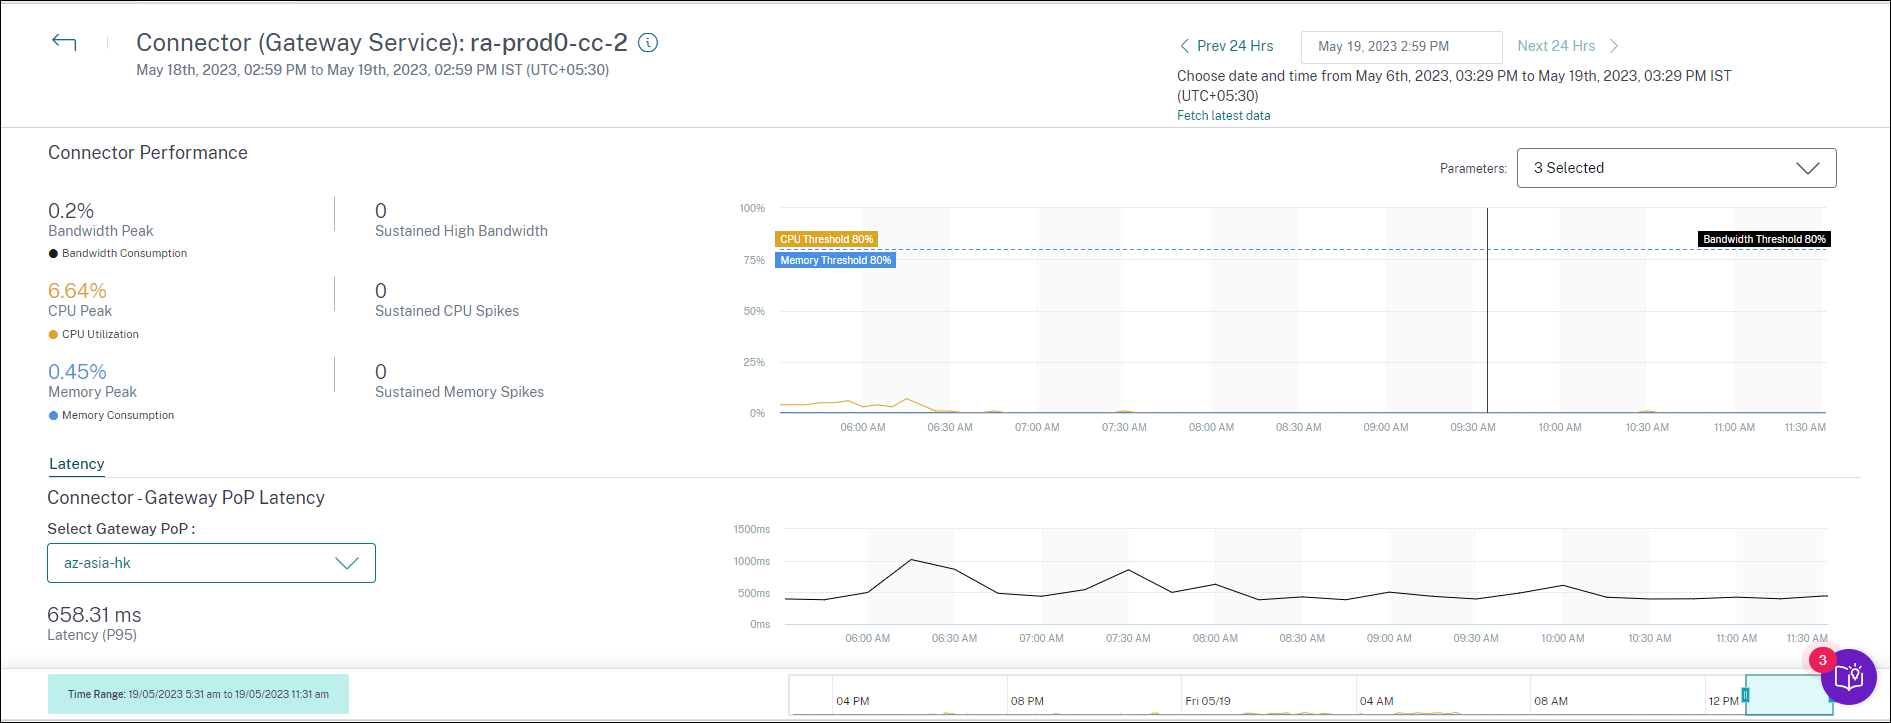
Connector Performance
Key parameters that define the connector resource usage are displayed. You can choose the parameters to be displayed from CPU, Bandwidth, and Memory.
- Bandwidth Peak represents the maximum bandwidth consumption in the connector in the last 24 hrs.
- Sustained High Bandwidth represents the number of times Bandwidth consumption crossed the Bandwidth threshold of 80% and sustained for 5 minutes or more.
- CPU Peak represents the maximum CPU utilization in the connector in the last 24 hrs.
- Sustained CPU Spikes represents the number of times CPU utilization crossed the CPU threshold of 80% and sustained for 5 minutes or more.
- Memory Peak represents the maximum memory consumption in the last 24 hrs.
- Sustained Memory Spikes represents the number of times memory consumption crossed the memory threshold of 80% and sustained for 5 minutes or more.
The peak percentage of each metric consumed in the connector is plotted over the 24 hour period available at a 5 minute granularity. This Connector Performance trend helps admins correlate issues of session failures and poor latency due to high resource consumption on the connector.
Connector Performance trends are plotted for a default 4-hour window. To view data corresponding to any other window in the 24-hour range, move the time navigation bars and choose a different time range. You can zoom in or out in a 6 hour window, to view the events corresponding to the selected time range.
Latency
Connector - Gateway PoP Latency represents the average value of synthetic latency calculated for the selected Gateway PoP in your virtual apps and desktops environment.
Typical use case
Connector Statistics view can be used to find out if high resource consumption on connectors is leading to sessions failures and high latency.
Click the sessions with poor Session Responsiveness on the User Experience dashboard.
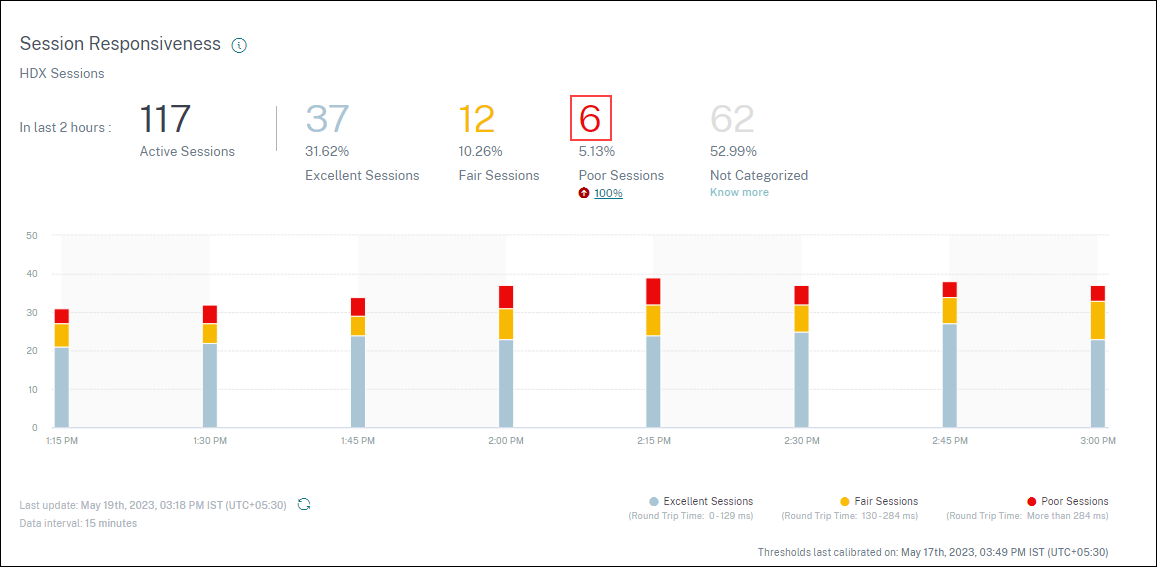
The Sessions self-service view is displayed with the details of the sessions having poor session responsiveness.
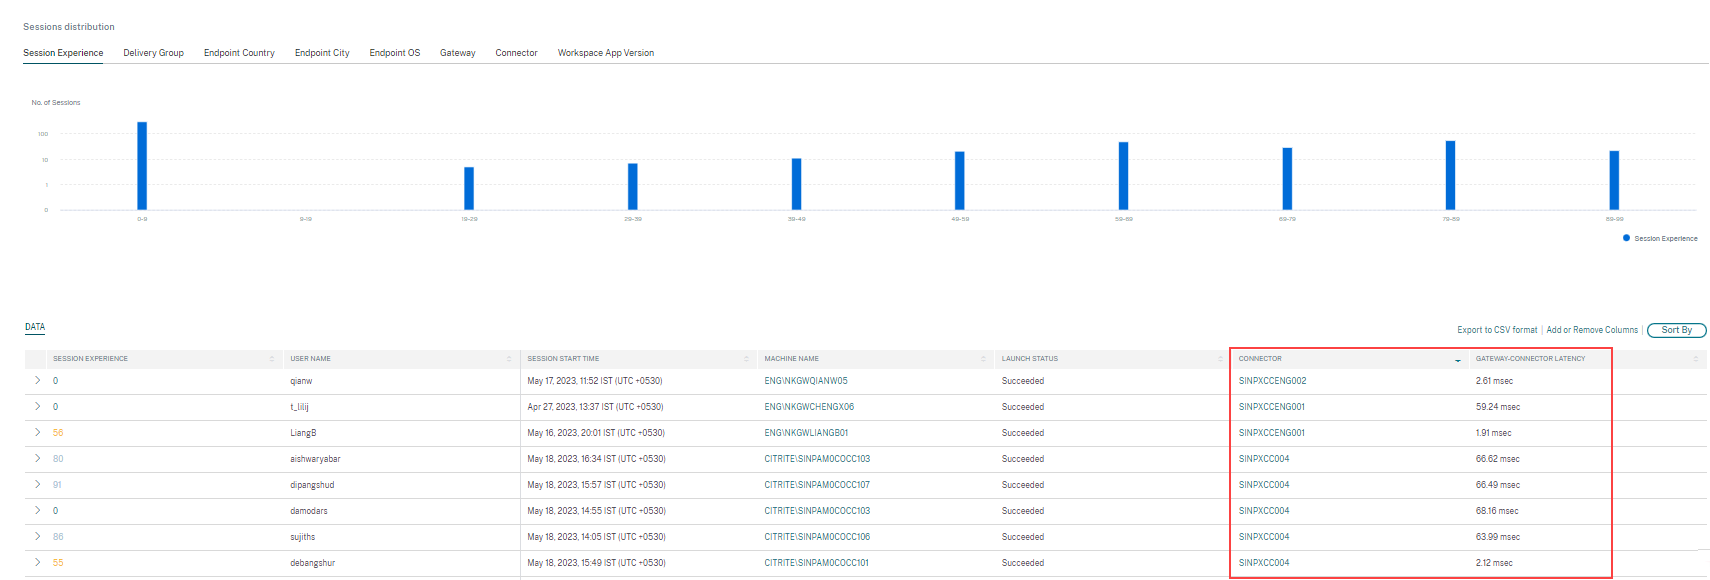
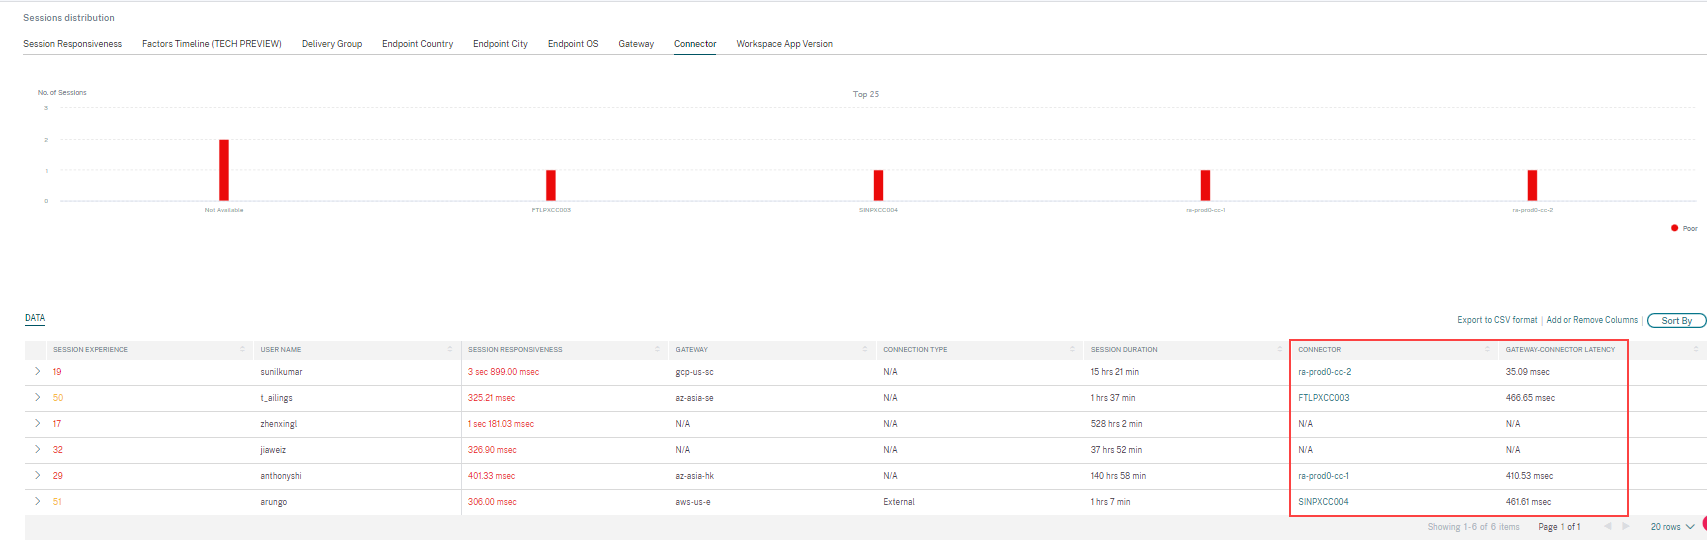 You can use the Connector pivot to see the distribution of sessions with poor responsiveness across the various connectors. Click the Add or Remove Columns link to add the Connector and Gateway-Connector columns to your view. Click the connector link to open the Connector Statistics view.
This view helps identify instances of high resource consumption on the connector and understand if they might cause poor responsiveness. The Connector - Gateway PoP Latency value in the Latency tab shows average value of synthetic latency calculated for selected Gateway PoPs in your virtual apps and desktops environment. This information helps you choose and configure the closest Gateway PoP to achieve the optimum session experience.