Session Details
The Session Details page provides a holistic view of the performance metrics of the selected session. Comprehensive session details and factors affecting the session performance are displayed for the session duration. This view gives visibility into session factors like ICARTT, Session Reconnects, bandwidth metrics, network latency, and endpoint network metrics. These factors are plotted along with the Session Score for the selected period. The Session Details view helps correlate the impact of available bandwidth and network latency on ICARTT and Session Score.
Notes:
- You need endpoints running Citrix Workspace™ app for Windows version 7 2108 or later to view Endpoint Network metrics.
- You need machines running Citrix Virtual Apps and Desktops™ 7 2112 or later on Citrix DaaS to view the bandwidth and network latency metrics.
- You must have the VDA data collection for Analytics policy set to Allowed on machines to enable the Monitoring service to collect machine related performance metrics such as Bandwidth and latency statistics. For more information, see Policy for collecting data for Analytics.
Accessing the Session Details page
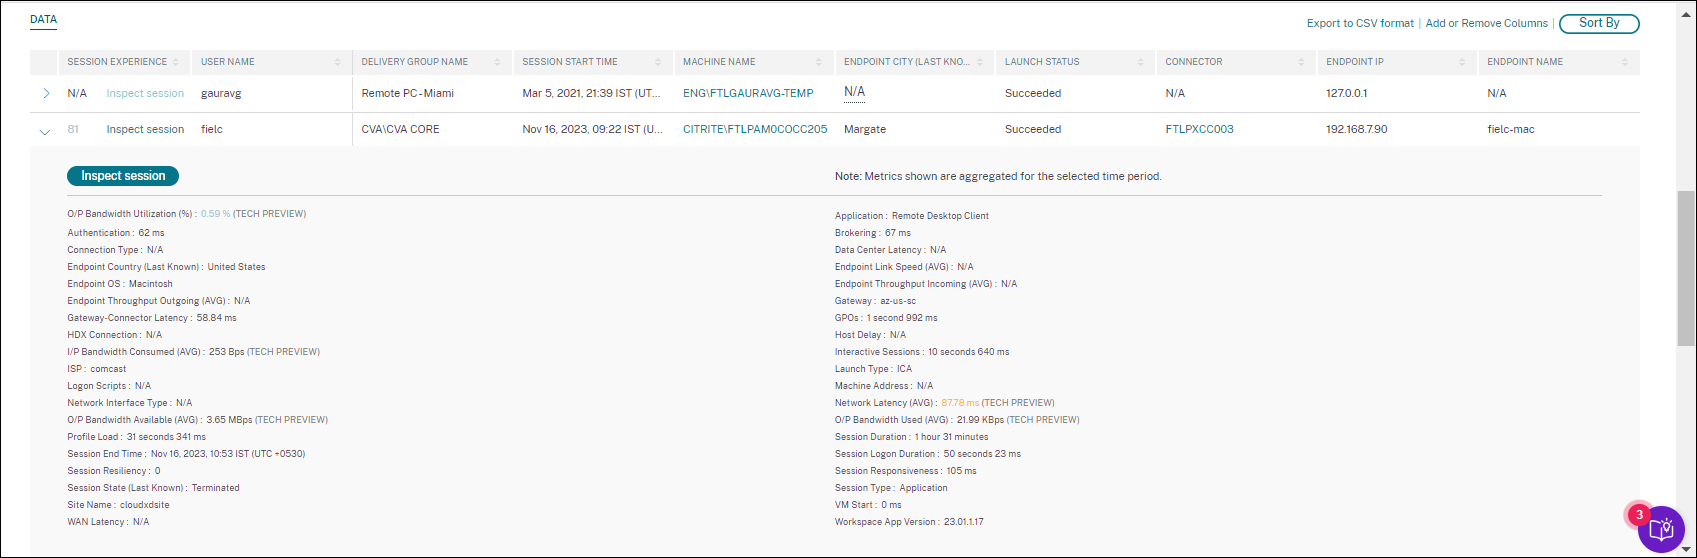
Click the Inspect Session link from the Self-service view for Sessions to open the Session Details page.
Using the Session Details page
The Session Details page displays statistics of the session like the ICARTT, Session Reconnects, Network Latency, Bandwidth, and Endpoint Network metrics on a single view. This information helps correlate the session performance with these factors.
The Session Statistics page displays data for up to 72 hours of the session duration.
Session Score and the other session performance and factors metric charts take into account the disconnected duration of the session. This consideration enables the overall Session Score and associated metrics to be an accurate representation of the session performance. The duration for which the session is disconnected is represented in the all charts and tooltips.
Session attributes
Key session attributes are displayed as follows:
- User name
- Session status
- Session Duration
- Logon Duration
- Delivery Group
- Site
- The machine on which the session was launched. Click the machine name link to see the corresponding Machine Statistics page.
- ISP
- Endpoint Link Speed (Avg)
- Endpoint Location
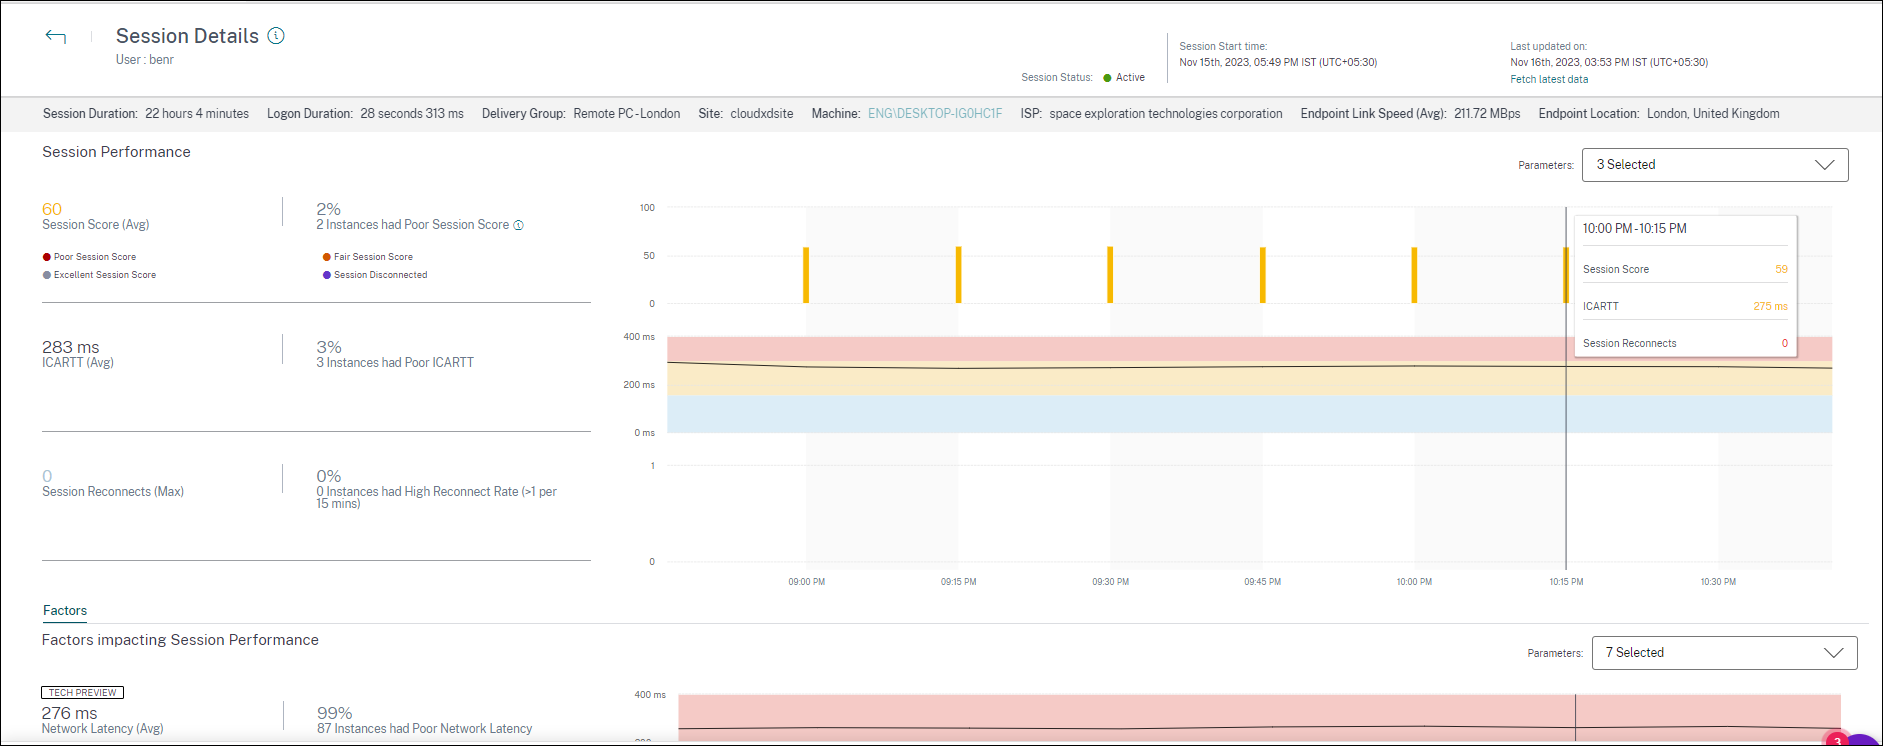
Session Performance
The key parameters that define the session performance displayed here are as follows:
- The average Session Score, ICARTT measurement, and Session Reconnects measurement
- The percentage values of session duration during which Poor Session Score, High ICARTT, and High Reconnect Rate was experienced
- The number of instances (of 15 min duration) during which Poor Session Score, High ICARTT, and High Reconnect Rate was experienced
- The average values of Session Score, ICARTT, and Session Reconnects plotted over the session duration at a 5 min granularity. The graphs are color-coded to indicate the performance of individual factors. You can choose the parameters to be displayed from Session Score, ICARTT, and Session Reconnects.
Factors (Preview)
This section displays measurements of bandwidth, network latency, and endpoint throughput factors that impact the session performance. Average values of Network Latency, Output Bandwidth Consumption, Output Bandwidth Available, Input Bandwidth Consumption, WiFi Signal Strength, Endpoint Throughput Incoming, and Endpoint Throughput Outgoing are listed. The metrics are available out-of-box and do not require any specific configuration.
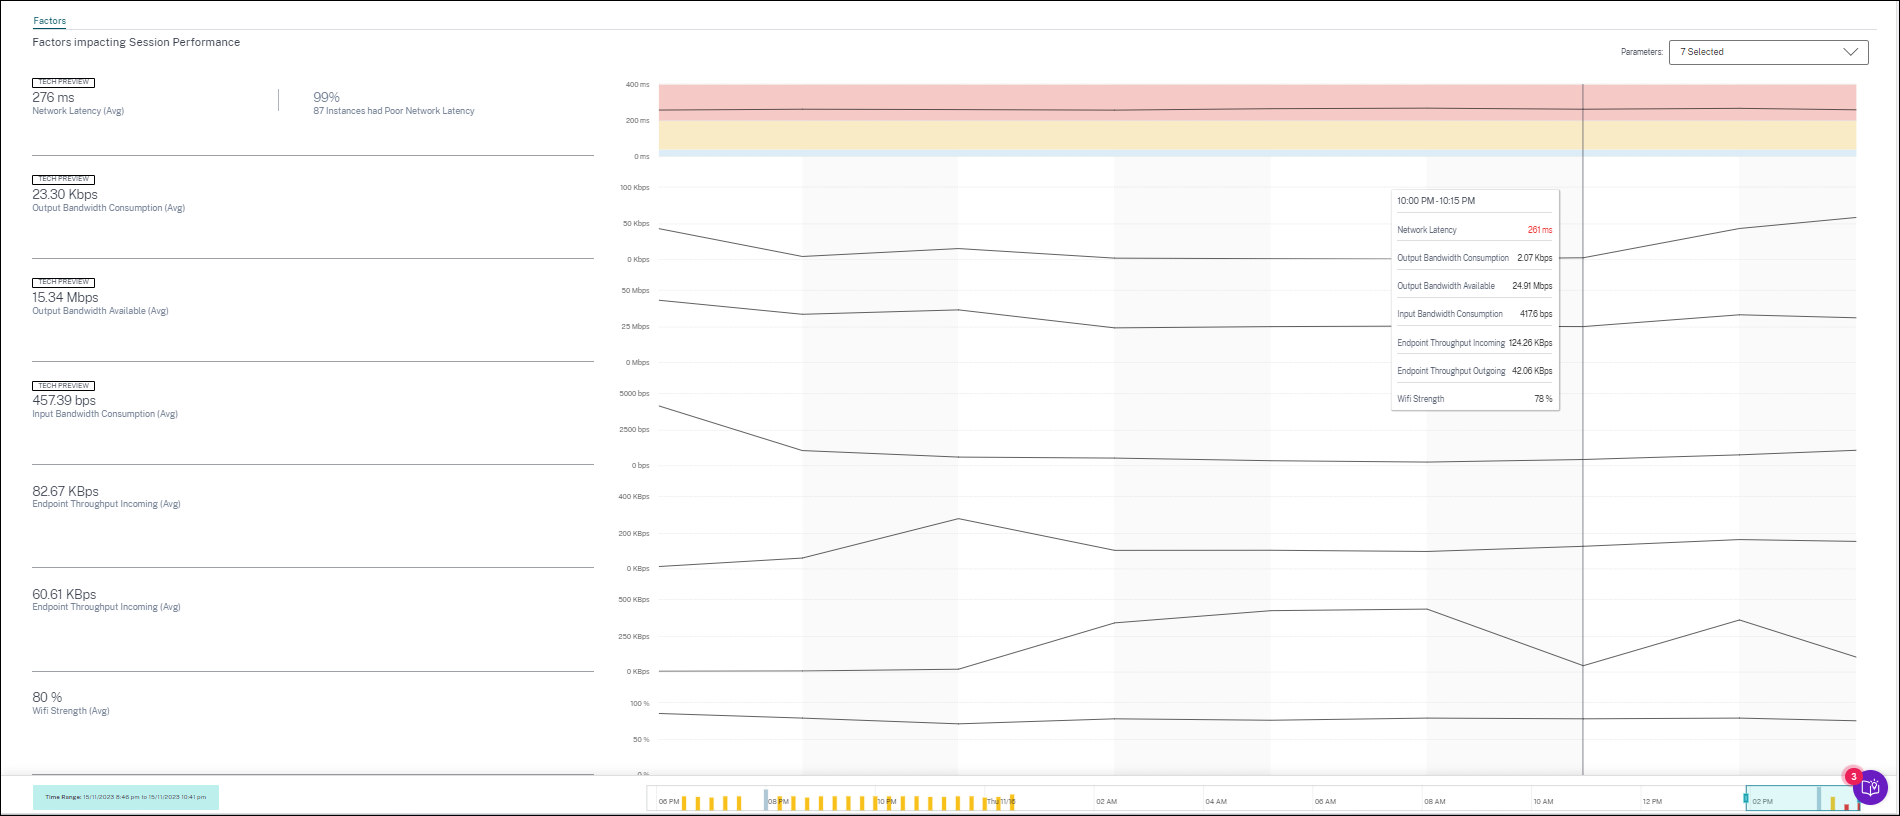
The metrics are plotted over the session duration with 15-minute granularity. You can choose the parameters you want to see in this section. These graphs are color-coded to indicate if the factors were excellent, fair, or poor.
All the trends are plotted for a default 4-hour window. To view data corresponding to any other window during the session duration, move the time navigation bars and choose a different time range. You can zoom in or out in a 6-hour window, to view the events corresponding to the selected time range.
The bandwidth, network latency, and endpoint throughput metrics and trends help analyze the session performance with respect to the individual parameter performance. It helps identify a specific factor that might be affecting the session performance.
Typical use case
Session Details view can be used to triage a specific factor that might be causing poor session performance. All the details pertaining to a launched session in the selected duration are available on the details view.
- You can start from the Poor Sessions number in the Session Responsiveness section of the User Experience dashboard.
- The Sessions self-service view is displayed with the details of the sessions having poor session responsiveness.
- Choose Session Responsiveness as the factor to view the sessions. Choose Factors Timeline as the pivot. The graph shows the distribution of sessions based on the Output Bandwidth Usage, Network Latency, and ICARTT.
- On the tabular view, expand the selected session row to see all the metrics related to the session. The bandwidth, latency, and endpoint throughput metrics are listed here.
- Click the session score to open the Session Details view. Analyze the view over the required interval to identify the factor causing poor session experience.
- Use the graphs to identify the factors that might be causing poor session experience.
- You can compare the overall throughput consumption with the endpoint link speed and the bandwidth consumption to spot if a user was probably running a bandwidth-intensive application outside the HDX™ channel resulting in poor session experience.
- You can identify if a drop in the WiFi signal strength led to a poor session experience.