Self-Service Search for Performance
Self-service search provides insights into key performance indicators associated with users, sessions, and machines collected by Citrix Analytics for Performance. Performance metrics such as session responsiveness, logon duration, session launch attempts, session failure count are displayed for users, machines, or sessions sorted and filtered based on your selection.
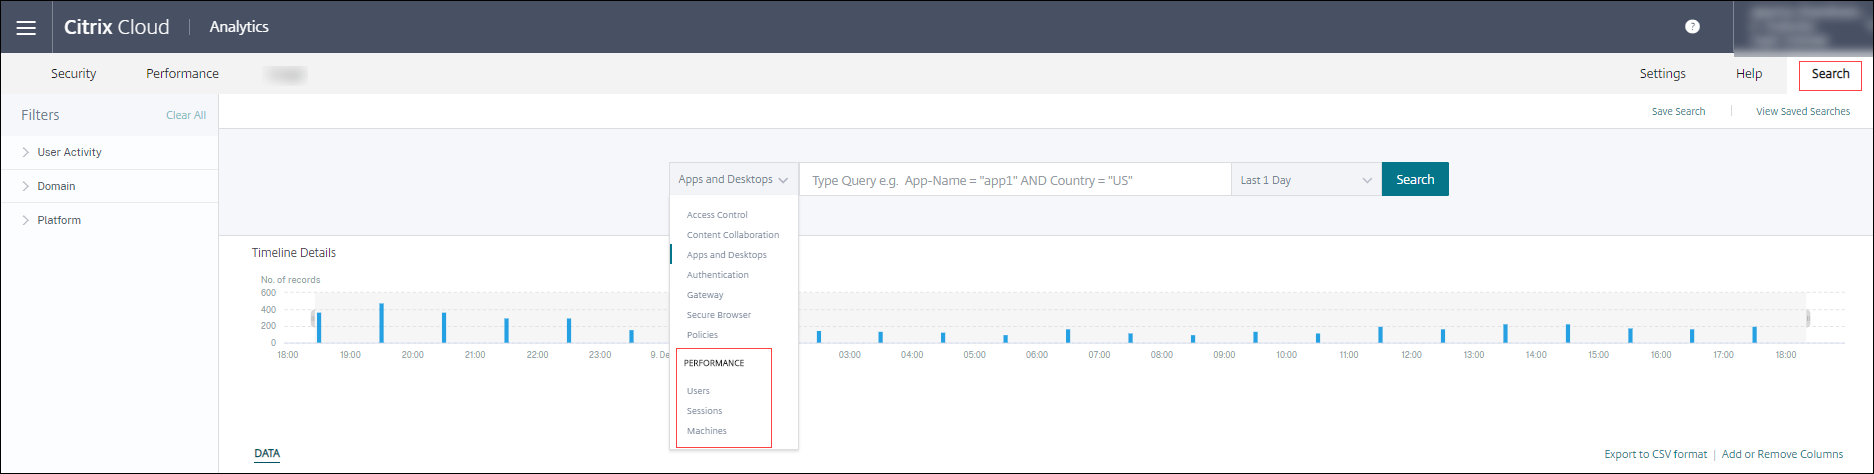
You can reach the self-service page from the main Search menu of the Citrix Analytics.
Note:
For more information on the self-service functionalities, like the usage of self-service search, scheduling an email for a search query and more, see Self-service search.
To view the Performance related events on the self-service page, select Users, Sessions, or Machines under Performance from the list in the search bar, select the time period, and then click Search.
Specific Users, Sessions, and Machines based self-service pages are also displayed upon clicking the users, sessions, or machines numbers respectively on the User experience dashboard and User Experience (UX) Factors pages.
You can use the search bar to enter your query to filter the results. You can also narrow down your search using the facets on the left hand pane. The set of users, sessions, or machines displayed is based on the selection criteria.
Select facets to filter events
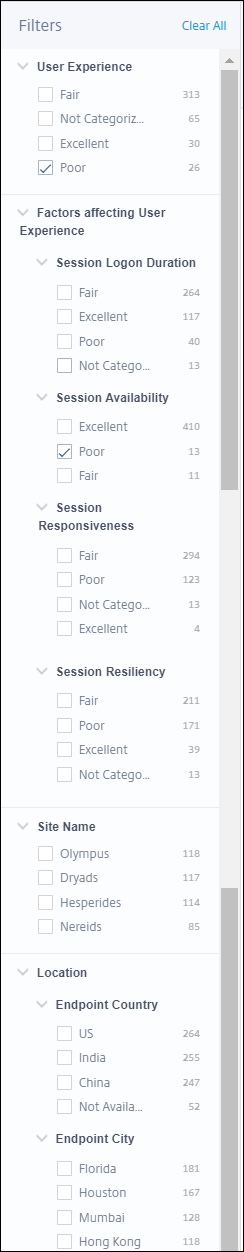
Use the facets on the left-hand side pane to filter the data. Some of the facets associated with the Citrix Analytics for Performance are as follows:
Session State
In the Sessions self-service view, you can select sessions based on the state of the session from among the following values:
- Unknown
- Connected
- Disconnected
- Terminated
- PreparingSession
- Active
- Reconnecting
- NonBrokeredSession
- Other
- Pending
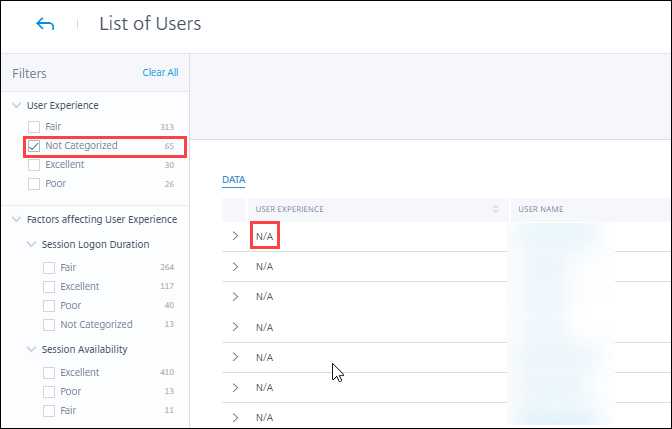
User Experience
Search users based on the user experience being Excellent, Fair, or Poor. The User Experience score can be “Not Categorized” if either the Session Responsiveness or the Session Logon Duration factor measurements be unavailable for the selected time period. The User Experience Score and the Session Experience Score are displayed as N/A in the self-service search results in these cases.
Session Experience
Search sessions based on the session experience being Excellent, Fair, or Poor. The Session Experience score can be “Not Categorized” if either the Session Responsiveness or the Session Logon Duration factor measurements are unavailable for the selected time period. The Session Experience Score is displayed as N/A in the self-service search results in these cases.
Factors affecting User Experience
Search users, sessions, and machines based on the individual factors affecting the user experience, such as Session Logon Duration, Session Responsiveness, Session Availability, or Session Resiliency.
Failure Type and Reason
In the Sessions self-service view, Failure Type and Failure Reason facets represents the Session Availability performance factors.
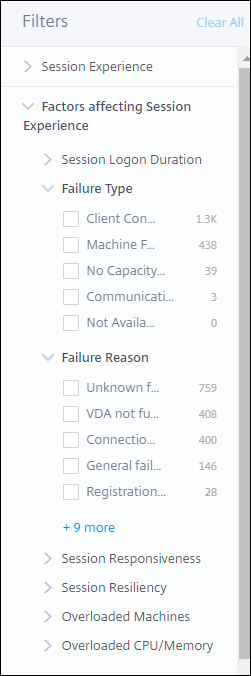
Failure Type provides filtering based on the type of session failures, such as Machine Failure, Client Connection Failure, Communication Failure. Failure Reason provides filtering based on the reason for session failure, such as a machine not functional, or a registration timeout.
Overloaded Machines and CPU/Memory
The Overload facets help filter machines, users, and sessions based on the load on the CPU and memory resources.
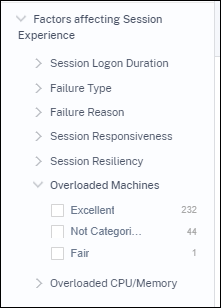
Overloaded Machines provides filtering based on how overloaded the machine resources are. Overloaded CPU/Memory provides filtering based on whether CPU or memory caused the overload.
Endpoint OS
Search sessions based on the operating system running on the endpoint machine from which the session has been launched. This parameter helps identify issues that can be common among all endpoints running the same OS. The OS information is displayed as N/A for endpoints running Citrix Workspace app for Windows version 1912 and earlier.
Workspace App Version
Search sessions based on the Workspace App Version on the endpoint machine from which the session has been launched. This parameter helps identify issues specific to a particular Workspace App Version. The Workspace App Version information is displayed as N/A for endpoints running Citrix Workspace app for Windows version 1912 and earlier.
Delivery Group
Filter users, sessions, and machines based on the Delivery Group the machines belong to.
Site Name
Filter users, sessions, and machines based on Site.
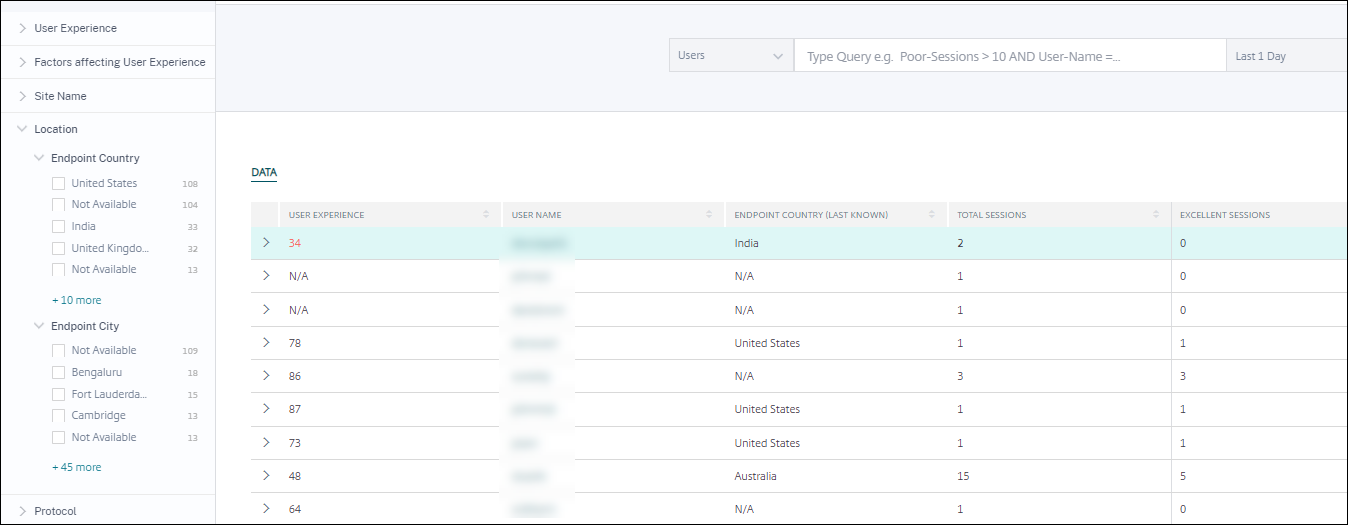
Location
You can now search users and sessions based on the location of the Endpoint Country or City. The Location facet helps isolating latency-related issues to a specific location.
The location information is extracted from the public IP address securely transmitted by the endpoint machine to Citrix Analytics. If your organization uses an on-premises StoreFront deployment, you can configure your StoreFront servers to enable Citrix Workspace app to send events to Citrix Analytics. Follow the steps as described in Onboard Virtual Apps and Desktops Sites using StoreFront.
You can disable the transmission of the IP address from the Citrix Workspace app on the endpoint machine by setting the SendPublicIPAddress registry entry to false. For more information, see Enhancement to Citrix Analytics Service in the Citrix Workspace app for Windows documentation.
Note:
In the case of a closed customer environment where the endpoints are operating within an intranet, ensure that the URL
https://locus.analytics.cloud.com/api/locateipis accessible to the endpoints.
Location of an endpoint can be Not Available or N/A for the following reasons:
- The session failed to launch.
- Communication time-out occurred with the URL,
https://locus.analytics.cloud.com/api/locateip. - The SendPublicIPAddress registry entry in the endpoint machine is set to disable the IP address transmission.
- The StoreFront™ server of your on-premises Site deployment is not configured with Citrix Analytics.
- The Citrix Workspace App for Windows version is earlier than 1912. See the Citrix Workspace app versions supported for other OS in the Citrix Workspace app Version Matrix article
Session Protocol
The Protocol facet helps you filter users and sessions based on the protocol of the session - HDX™, Console, or RDP.
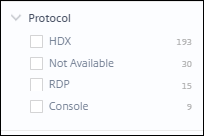
This facet lists only the current protocols of sessions and not all supported session protocols.
Connection Type
Use the Connection Type facet to filter sessions based on whether the endpoints are directly connected to the machines or through a gateway. The Connection Type facet has the following elements,
- internal – for direct connections without Gateway
- external – for connections through Gateway
The Connection details are available for Endpoints running Citrix Workspace app version 20.12.0 or later for Windows. For all other endpoints, the Connection type is displayed as N/A.
This facet helps identify and troubleshoot issues related to the gateway easily.
Machine OS Type
This facet is available on the Machines based self-service view. It helps narrow down your search to a specific Machine OS type.
Launch Type
This facet shows the classification of sessions as ICA® based or Connection leased on the Sessions Self-service view. It helps find the number of sessions that were launched via Connection Lease.
Aggregated State
This facet is available on the Machines based self-service view to help narrow down your search based on the Aggregated State of the machine. Aggregated state represents the least favorable state the machine has been in, from among Ready for use, Active, Maintenance, Unregistered and Failed in that order.
Load
The Load facet is available on the Machines based self-service view to help narrow down your search based on the load on the machine. You can select machines with High, Medium, or Low load. The machines might not be categorized if they are in shutdown, unregistered or failed state or if the resource data is not available for the machine.
Self-service search for Users
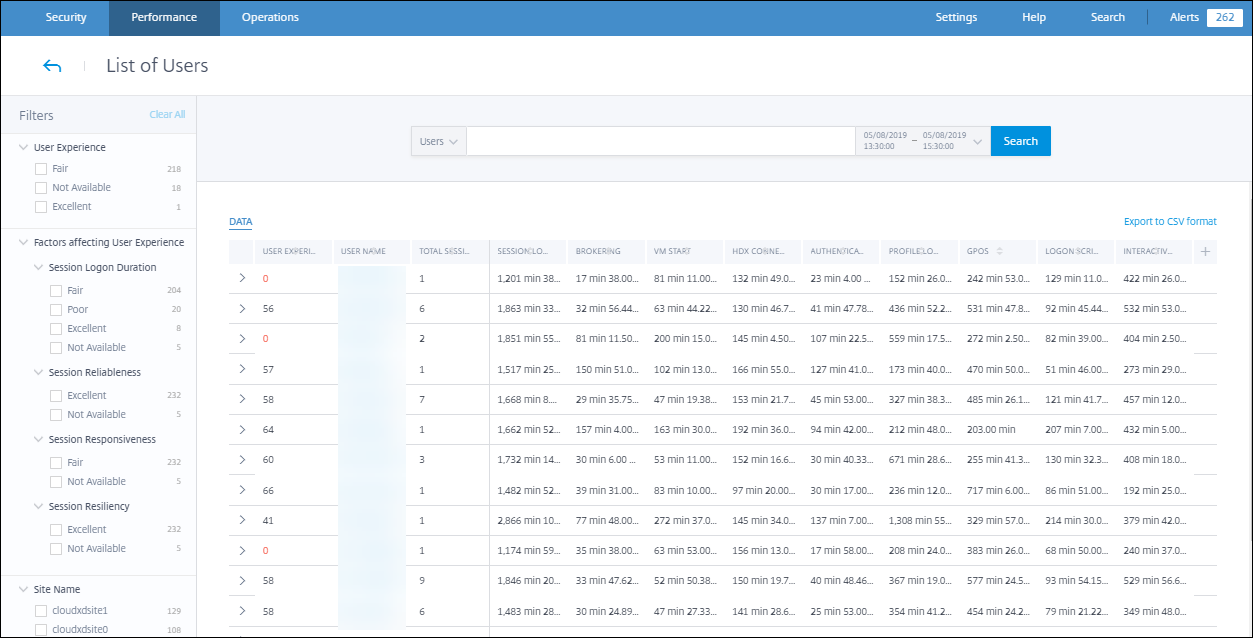
The Users based self-service page is available on clicking the user classification numbers on the User experience dashboard and drilldown pages. You can also access the Users based self-service view from the Search menu in your Citrix Analytics. In the list of services in the Search tab, select Users under the Performance section.
This view provides the important performance metrics related to users, such as,
- Total Sessions: Number of sessions successfully launched by the user.
- Launch attempts count: Number of times the user attempted to launch a session.
- Failure count: Number of sessions that failed to establish.
- User Experience: Overall user experience score calculated across all the sessions launched by the user.
- Classification of sessions: User sessions classified as excellent, fair, and poor.
- Factors and sub-factors metrics Key performance indicators that affect the user experience.
- Endpoint Country (last known) and Endpoint Country (last known): Last known location.
- Profile Load: The time taken to load the user’s profile.
- Profile Size (last known): The last measured value of profile size.
- Average Profile Size: Average profile size for the selected duration.
Self-service search for Sessions
The Sessions-based self-service is available on clicking the session classification numbers on the dashboard. You can also access the Sessions-based self-service view from the Search menu in your Citrix Analytics. In the list of services in the Search tab, select Sessions under the Performance section.
Visual Summary on Sessions self-service view
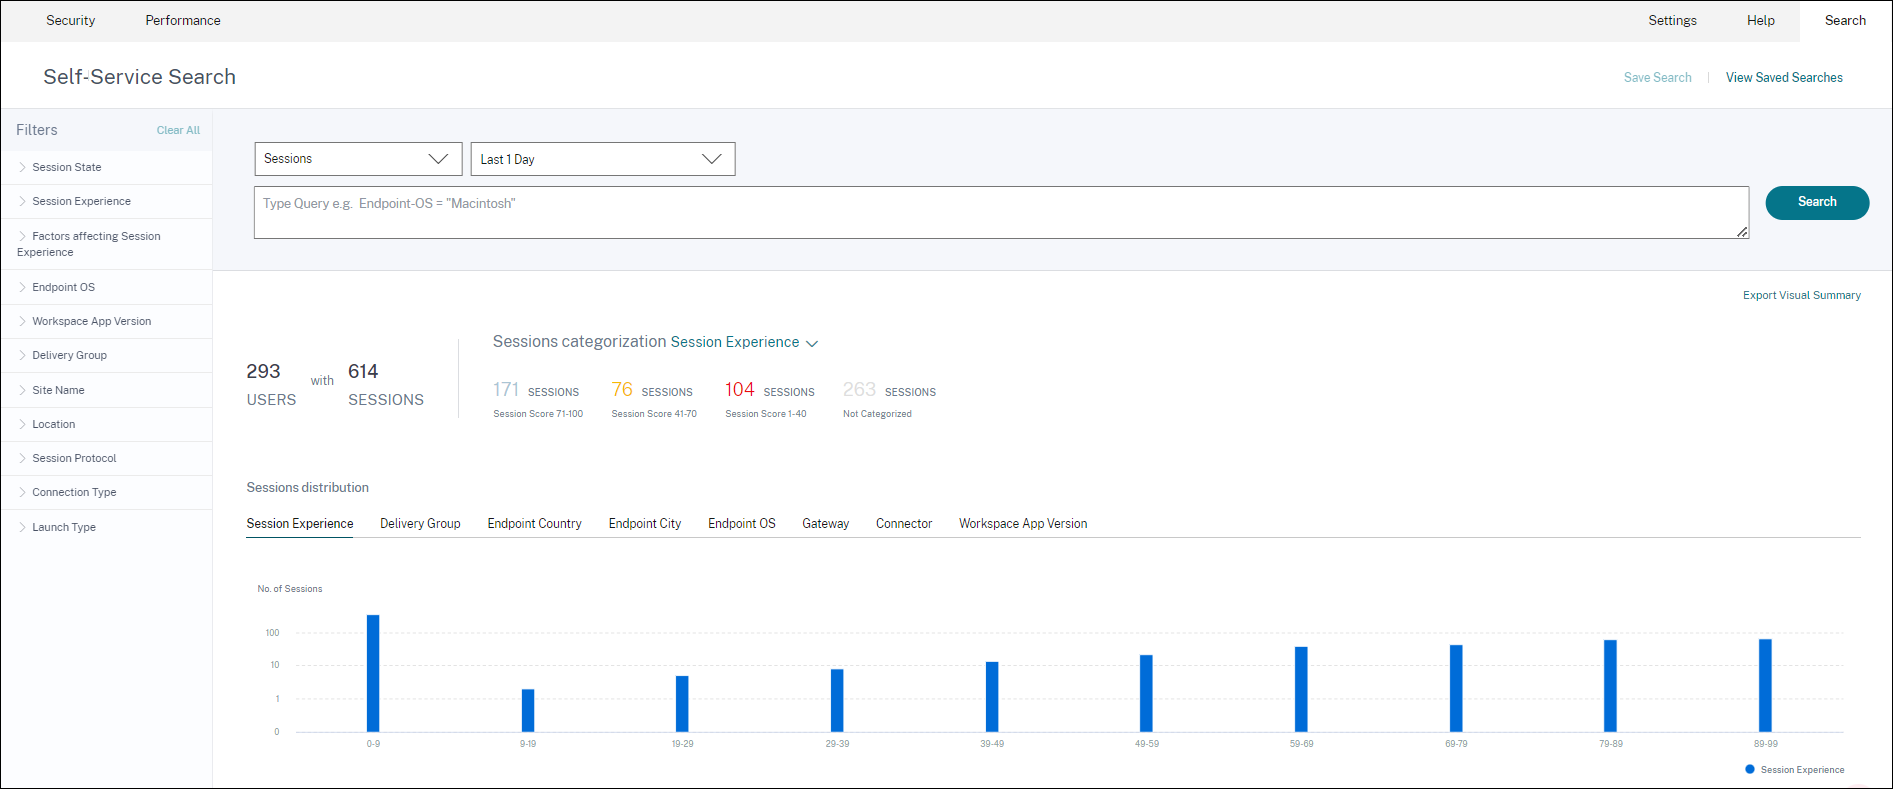
Visual Summary presents raw data in the Sessions self-service tables as charts to improve visibility into the session performance.
The Visual Summary chart displays session categorization based on chosen criteria. In addition, you can choose to view the session distribution pivoted on a specific parameter. This helps identify session performance issues related to the pivots.
Use the visualization to identify patterns in data and troubleshoot specific session performance issues.
Factors Timeline(Preview)
Factors Timeline pivot is added in the Session Distribution section of the Sessions self-service view under the Session Responsiveness category. You can use this pivot to analyze sessions based on Poor Output Bandwidth Usage, Poor Network Latency, and Poor ICARTT.
Use case - Access Visual Summary starting from the Dashboard
You can use the Visual Summary chart to troubleshoot sessions having poor Session Logon Duration or Session Responsiveness experience displayed on the User Experience dashboard.
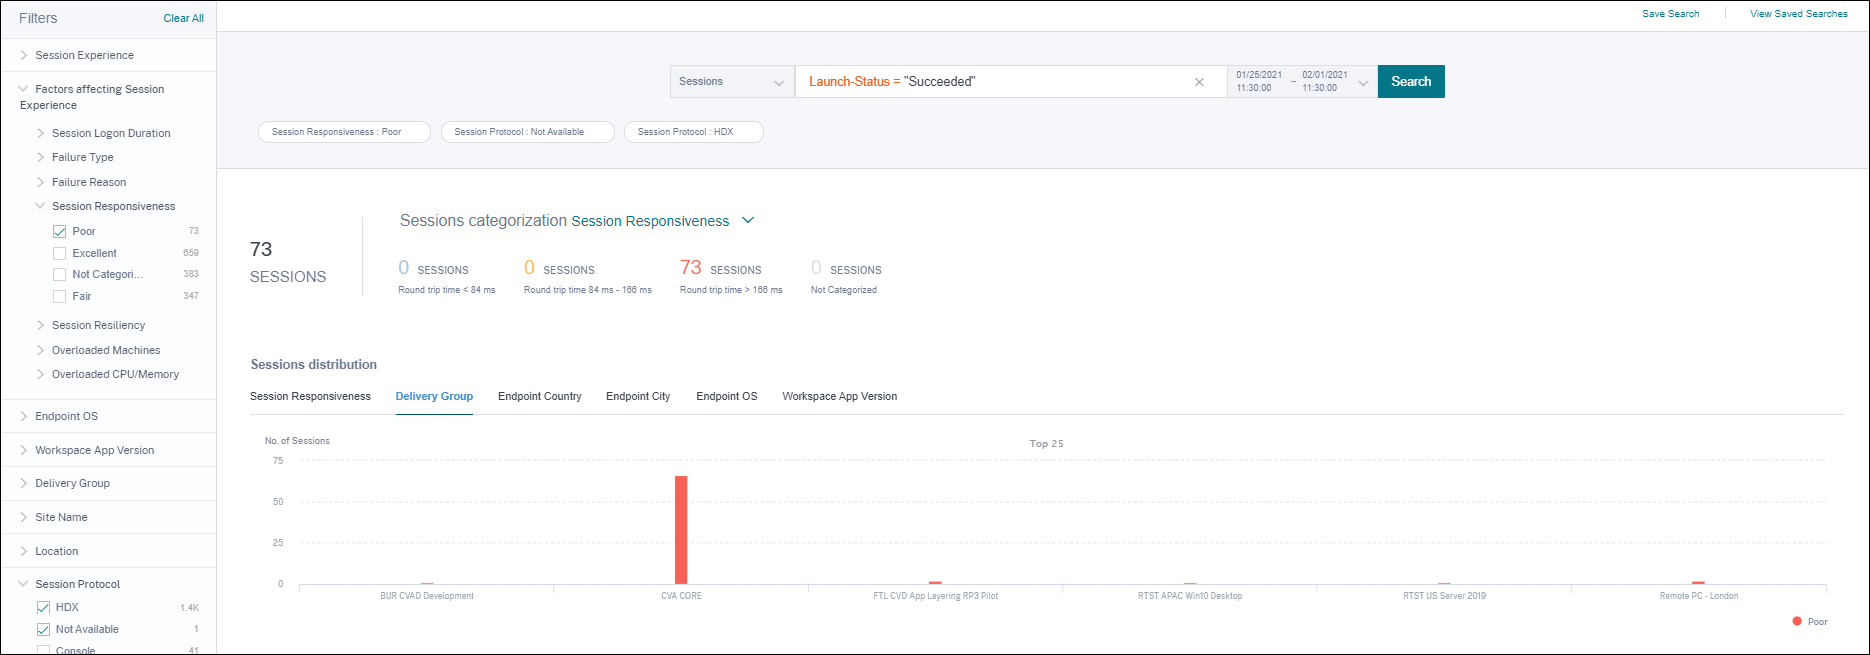
Click the poor sessions number in the Session Responsiveness chart to view the Visual Summary chart on the Sessions self-service view. A Visual Summary chart displays sessions categorized by Session Responsiveness over the selected duration. This helps identify specific time intervals where the ICA RTT has been high.
Further, choose the pivot from among Delivery Group, Endpoint Country, Endpoint City, Endpoint OS, Connector, Gateway, and Workspace version to plot the session distribution. For example, selecting the Delivery Group pivot results in sessions plotted based on Delivery Groups. Use the chart to identify if sessions of a specific Delivery Group have high ICA RTT. Performance of sessions from Delivery Groups delivering business critical applications can be monitored easily using Visual Summary.
Use case - Access Visual Summary using the Search menu
You can visualize the result of your custom search query on the Sessions self-service view. In the Search tab, select Sessions under the Performance section. Enter your search query and click Search. To further customize the visualization of the results, choose the session categorization and distribution criteria.
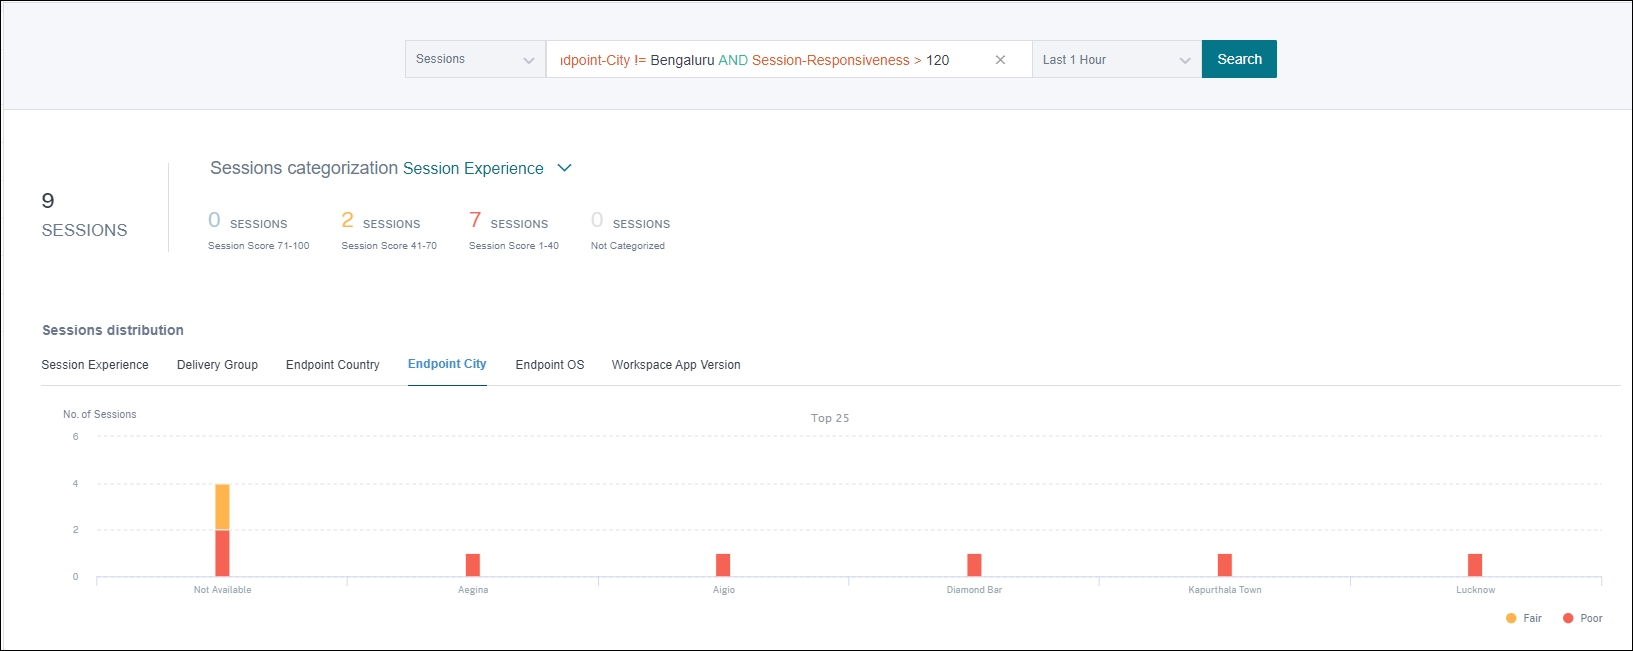
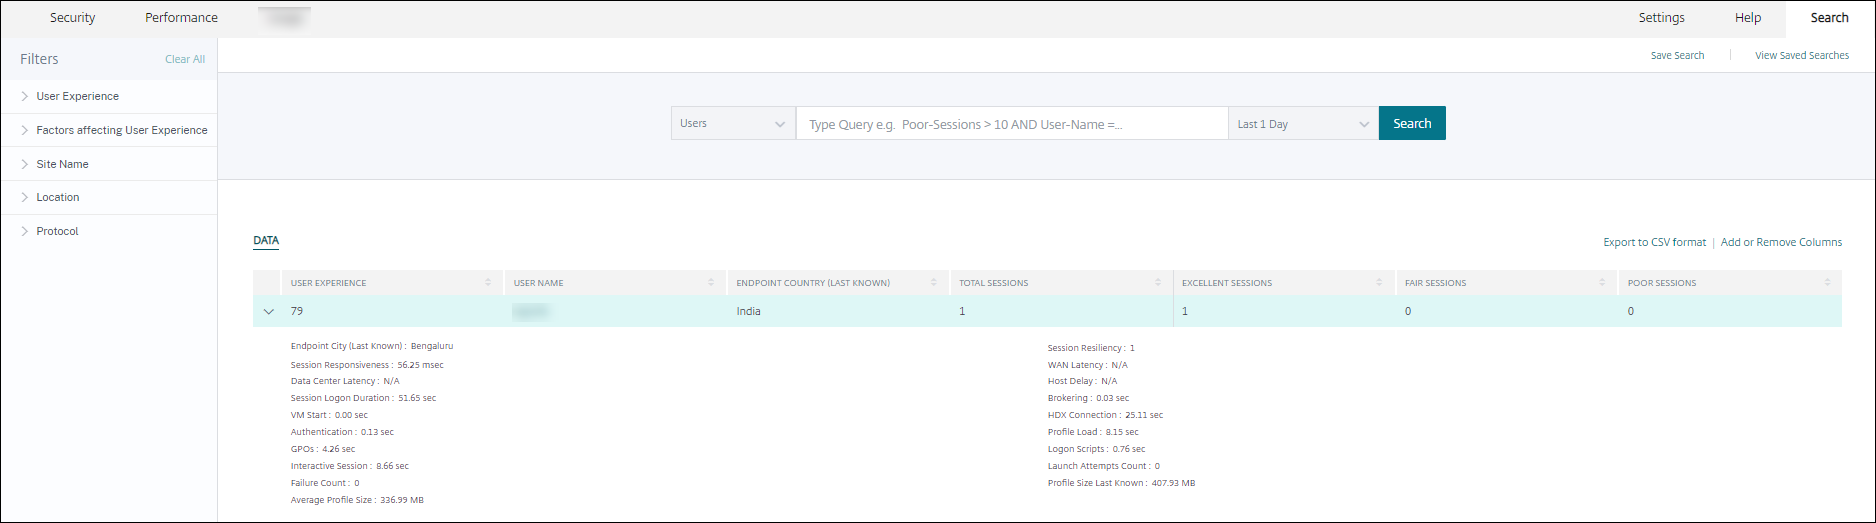
The preceding example shows a query returning sessions with poor Session Responsiveness and not located in Bengaluru. Further pivoting on the Endpoint City gives visibility into other locations from where sessions have high ICA RTT.
This feature is especially useful in reporting, you can also save and reuse the query.
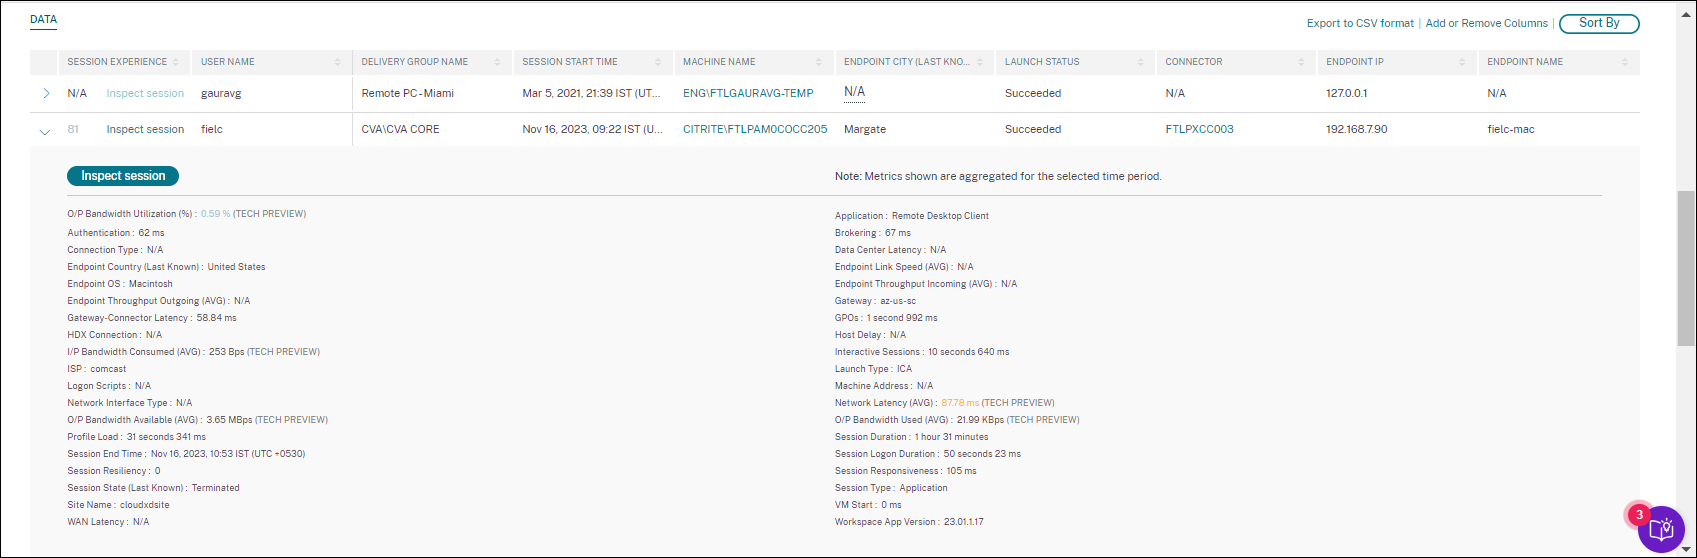
Tabular data
This Sessions self-service view provides important performance metrics related to sessions in tabular format. Expanding a row displays session metrics that are relevant for the session state. If the session was in a disconnected state during the selected time interval, session metrics related to responsiveness and bandwidth, that are not applicable for disconnected sessions are not displayed. For a failed session, the failure reason and type are displayed to help triage the reason for the session failure. Any columns added to the table that are not relevant for the session state is displayed as “–”.
 .
.
- Session Experience: Session Experience score based on the performance factors.
- Session specific metrics: Metrics such as the session start time and launch status.
- Data Center Latency: This ICARTT subfactor is the latency measured from the Citrix Gateway to the server. A high Data Center Latency indicates delays due to a slow server network.
- WAN Latency: This ICARTT subfactor is the latency measured from the virtual machine to the Gateway. A high WAN Latency indicates sluggishness in the endpoint machine network. WAN latency increases when the user is geographically farther from the Gateway.
-
Host Latency: This ICARTT subfactor measures the Server OS induced delay. A high ICA RTT with low Data Center and WAN latencies, and a high Host Latency indicates an application error on the host server.
Note:
To get the ICARTT subfactor metrics, configure L7 latency thresholding. For more information, see L7 Latency Thresholding.
- Endpoint City (last known) and Endpoint Country (last known): Last known location.
- Workspace App version and Endpoint OS
- Average Profile Size: Average profile size for the selected duration.
-
Connection Type:
internalfor direct connections from machine to endpoint,externalfor connections through gateway. - Gateway address: Gateway address for external connections.
- Machine FQDN: Machine address with port id for internal connections.
-
Launch Status: Displays the launch status of the session as
Succeeded,Failed, orUser Terminated- in case the user voluntarily closed the session. Launch Status is supported with endpoints running:- Citrix Workspace app 20.9.0 or later for Android
- Citrix Workspace app 20.8.0 or later for iOS
- Citrix Workspace app 20.8.0 or later for Windows
Launch Status is not available with endpoints running Workspace on the web.
-
Network Interface Type Displays the network interface type of the client. Possible values for Network Interface Type are:
- Ethernet
- Wi-Fi
- TokenRing
- FDDI
- PPP
- Loopback
- Slip
- Other
- UnknownType
The value of this field is N/A for endpoints running Citrix Workspace app Windows version earlier than 2105.
-
Bandwidth and Latency metrics (Preview) Displays the following values:
- Average values of the bandwidth metrics - Input Bandwidth Consumed, Output Bandwidth Available, Output Bandwidth Used,
- Percentage value of Output Bandwidth Utilization, and
- Average value of the Network Latency
These metrics are available out-of-the-box for Citrix DaaS (formerly the Citrix Virtual Apps and Desktops™ service).
- You need machines running Citrix Virtual Apps and Desktops 7 2112 or later.
- The VDA data collection for Analytics policy must be set to Allowed on machines to enable the Monitoring service to collect machine related performance metrics. For more information, see Policy for collecting data for Analytics.
- Session Duration Displays the length of the session.
-
ISP Displays the Internet Service provider serving on the endpoint. This metric is available if the endpoint is running Citrix Workspace app for Windows versions 1912 and later. For more details regarding the availability of this feature with Citrix Workspace app for other OS, see the Workspace app matrix.
-
Connector Displays the name of the connector. This column helps identify connectors through which sessions with poor responsiveness are routed. Connector is an optional column that can be added to the Sessions self-service view by clicking Add or Remove columns.
Clicking the Connector name link opens the Connector Statistics view. For more information, see the Connector Statistics article.
-
Gateway Displays the name of the Gateway for on-premises and the Gateway Point of Presence for Cloud customers. This information helps identify the gateways through which sessions with poor responsiveness are routed. It also helps identify the distribution of sessions routed from a user location through different Gateway PoPs. Gateway is an optional column that can be added to the Sessions self-service view by clicking Add or Remove columns.
The value of the Connector might be N/A for any of the following reasons:
- There was a delay in receiving Connector events.
- Cloud Connector version is earlier than 16.0.0.7.
Also, ensure that the data processing via your Cloud Connectors is on. To do this, you can check the Data processing on state on the Cloud Connectors tile from the Performance tab in Citrix Analytics > Data Sources.
-
Gateway-Connector Latency Displays the latency value from the Connector to the Gateway Point of Presence that was used to establish the session. Gateway-Connector Latency is an optional column that can be added to the Sessions self-service view by clicking Add or Remove columns.
-
Launch Type Displays if sessions are ICA based or Connection leased. This information helps find the number of sessions that were launched via Connection Lease. You can use the failure reason to troubleshoot Connection leased sessions that have failed to launch.
- Endpoint Link Speed (Avg) Link speed helps identify if the poor session experience was due to low speed.
- Endpoint Throughput Incoming (Avg) Displays the total bytes received.
-
Endpoint Throughput Outgoing (Avg) Displays the total bytes sent.
Note:
The Endpoint metrics require that the StoreFront server of your on-premises Site deployment is configured with Citrix Analytics. For more information, see Onboard Virtual Apps and Desktops sites using StoreFront.
- Endpoint IP Displays the IP address of the endpoint.
- Endpoint Name Displays the IP name of the endpoint.
-
Failure Type – Indicates the kind of failure from among the following values:
- Client Connection Failure
- Machine Failure
- No Capacity Available
- No Licenses Available
- Configuration
- Communication Failure
- Unknown error
-
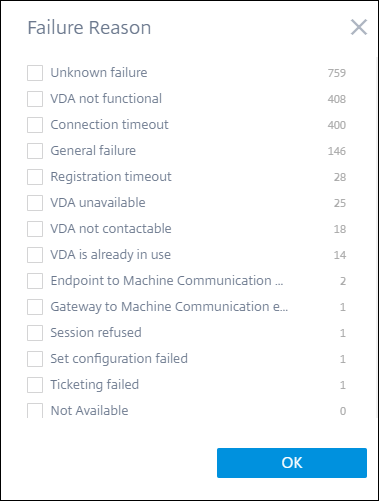
Failure Reasons – Indicates the exact reason for the failure. You can resolve the failure using the corresponding recommended steps in Citrix Director failure reasons and troubleshooting. The failure columns are especially helpful when you navigate from the failed session count on the dashboard to a filtered set of failed sessions in Sessions self-service view.
- Session Type – Indicates if the session is an application or a desktop session.
-
Session State – Indicates the state of the session from among the following values:
- Unknown
- Connected
- Disconnected
- Terminated
- PreparingSession
- Active
- Reconnecting
- NonBrokeredSession
- Other
- Pending
- Session End Time – Indicates the time at which the session ended.
Click the Inspect Session link from the Self-service view for Sessions to open the Session Details view for the session.
Tabular data on the Session-based self-service view is color coded to indicate the excellent, fair, or poor category the metrics belong to. This categorization is based on the individual threshold levels of the metrics. The thresholds are calculated dynamically, for more information, see How are Dynamic Thresholds calculated?.
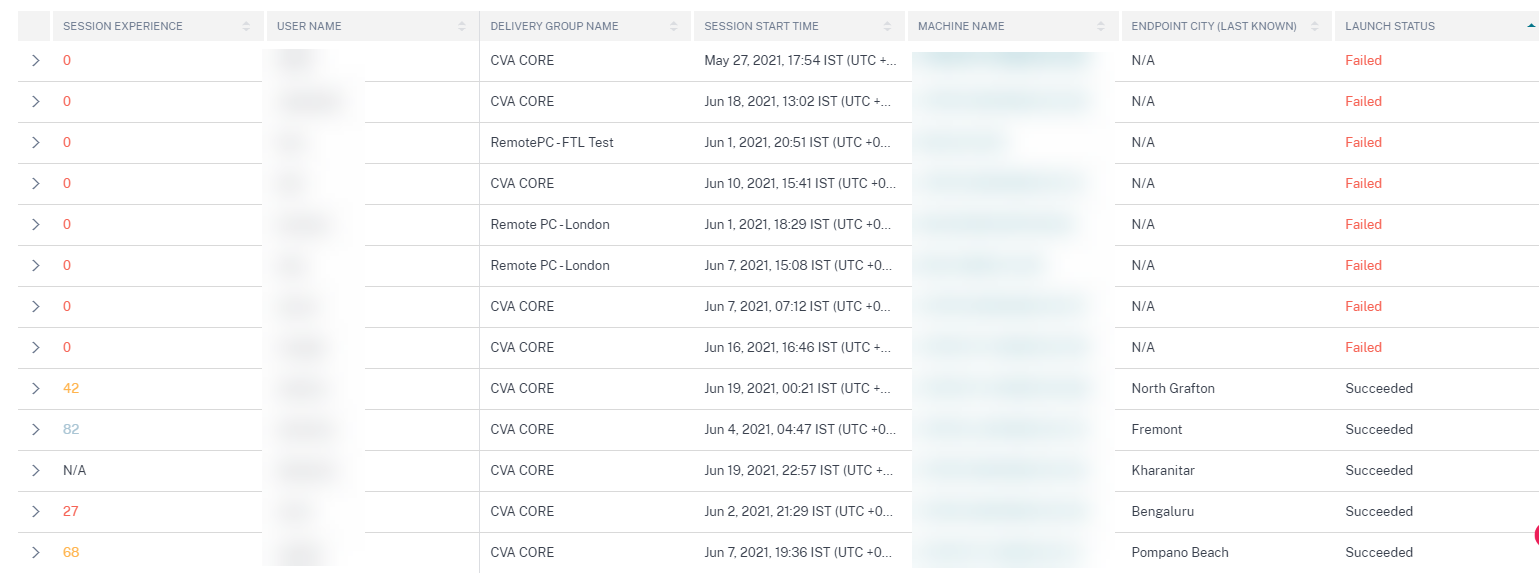
Similar color coding is applied to the metrics available on expanding the rows on the Session-based self-service view.
Color coding visually aids in focusing on and identifying factors that are contributing to poor performance. It also gives an overview of the performance across various factors for the sessions that have been filtered to be seen in the current view.
Tool tips elaborating the reason for N/A values are now in available in the Sessions self-service view for the following endpoint-related metrics:
- Workspace App Version
- Endpoint Country (Last known)
- Endpoint City (Last known)
- Endpoint Link Speed (P95)
- Endpoint Throughput Incoming (P95)
- Endpoint Throughput Outgoing (P95)
- ISP (Internet Service Provider)
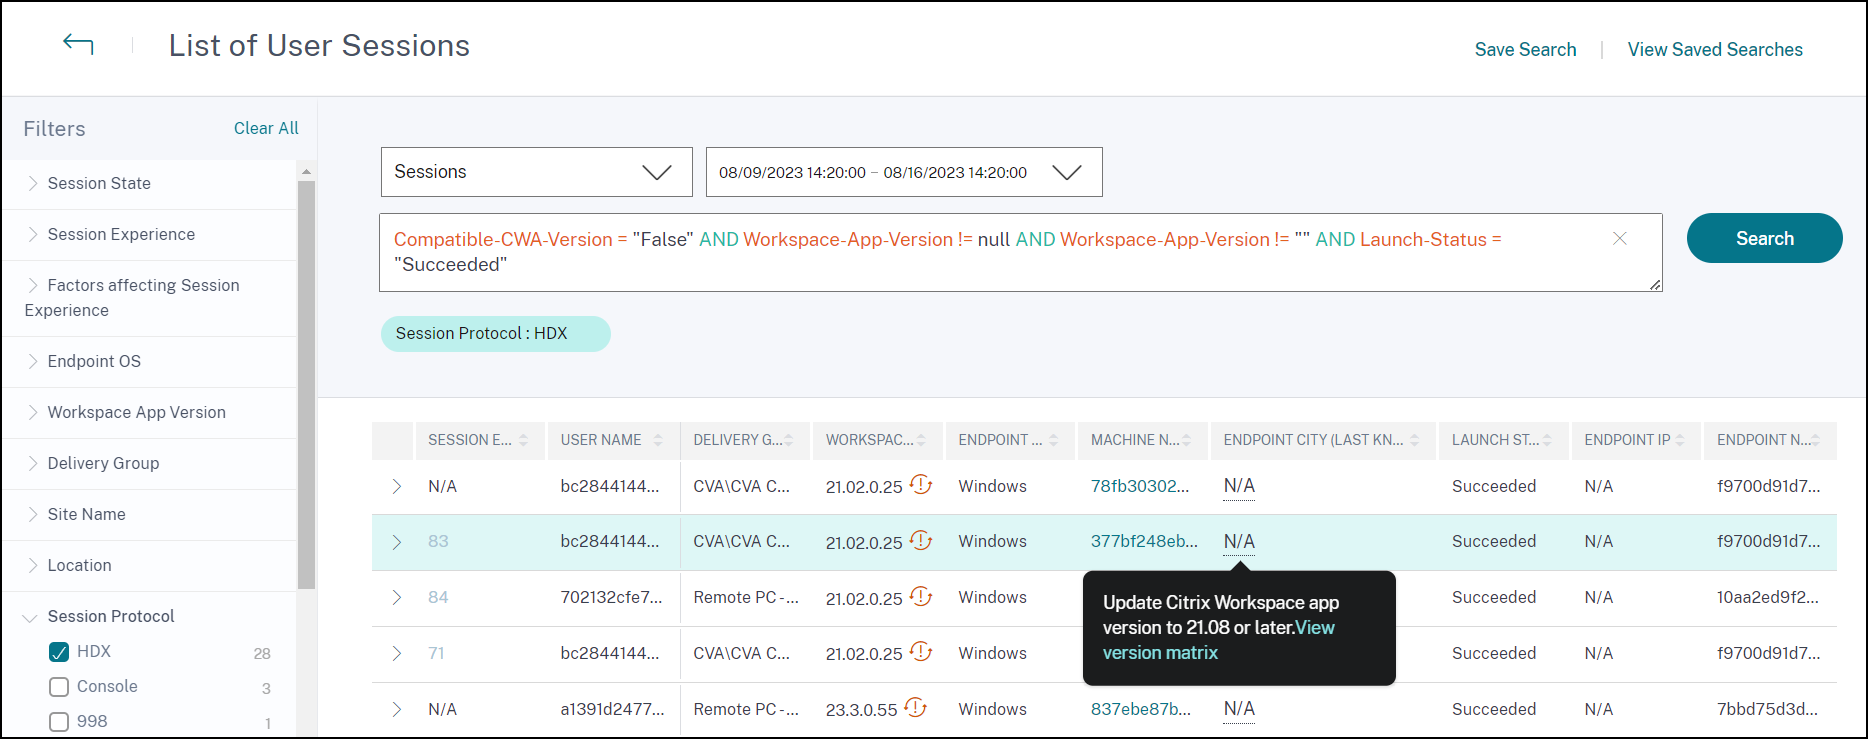
Tooltips are displayed on the N/A values of these metrics with the reasons as incorrect StoreFront onboarding, or sessions launched from endpoints that run unsupported OS platforms or incompatible Citrix Workspace app versions.
Self-service search for Machines
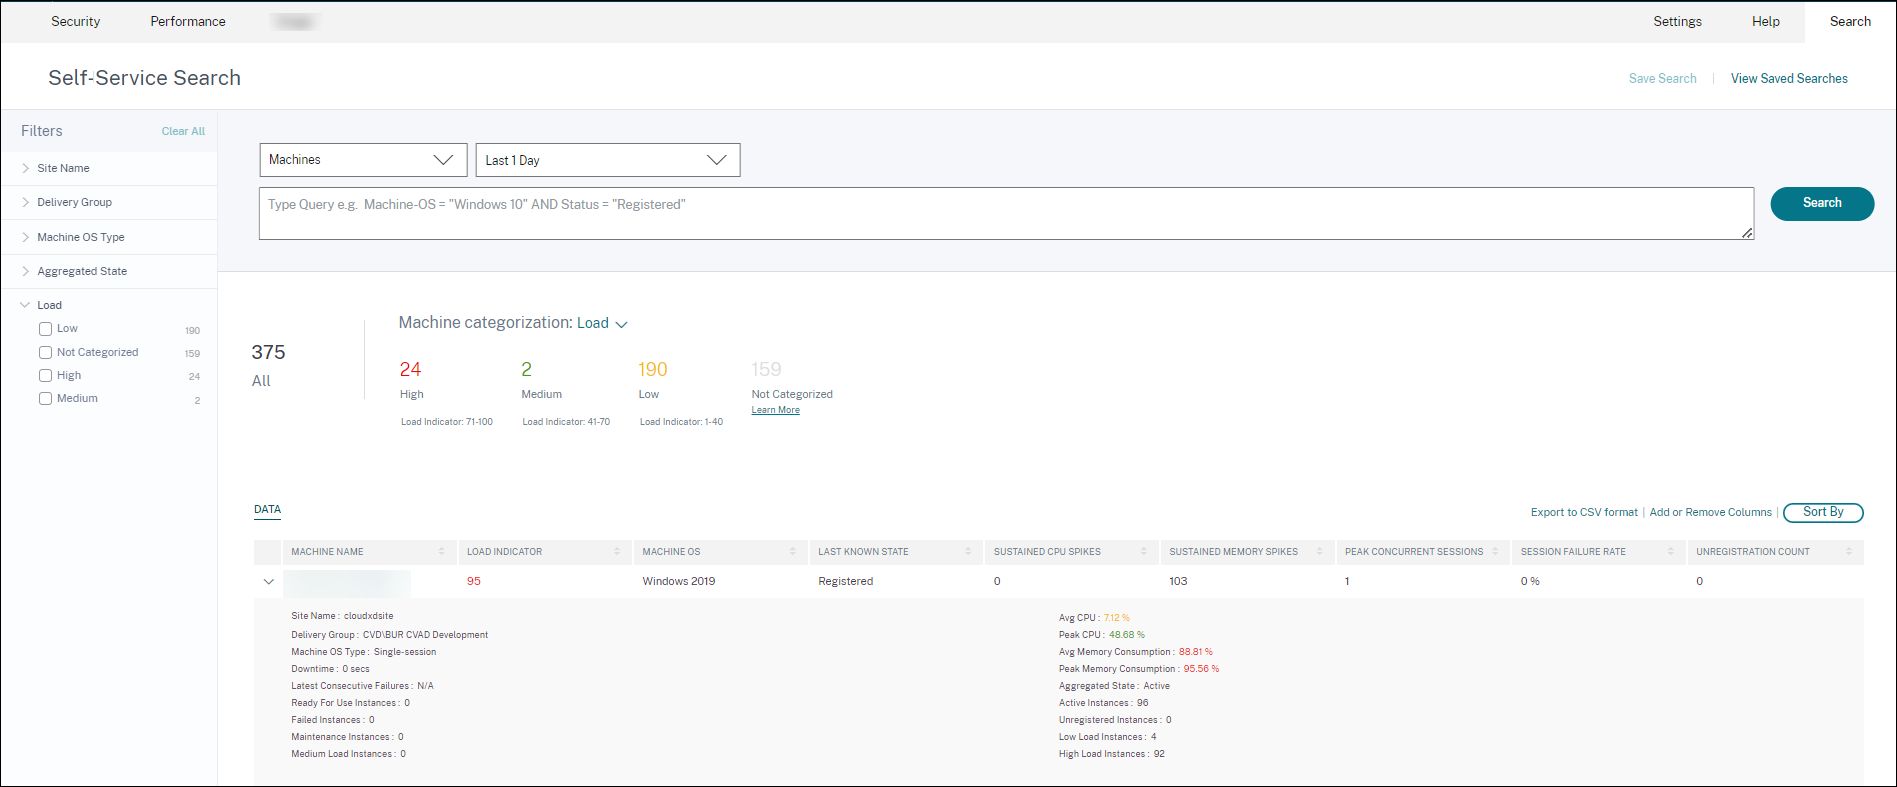
You can access the Machines based self-service view from the Search menu in your Citrix Analytics. In the list of services on the Search tab, under the Performance section, select Machines. The Machines based self-service view is also available when you drill down from black hole machines. To access the view, on the User experience dashboard, in the Failure Insights section, click the Black hole machines number.
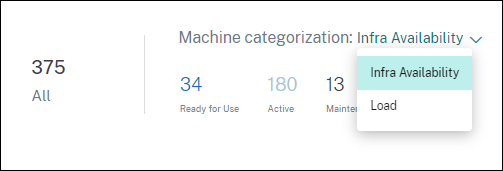
The Machines self-service view provides machine categorization based on availability and load. In the Machine categorization dropdown, select Infra Availability or Load.
 .
.
Machines are categorized as follows based on availability:
- Ready for Use - Machines in a healthy state with no active sessions.
- Active – Machines with at least one active session.
- Maintenance – Machines in Maintenance mode, no connections are accepted.
- Unregistered - Machines not registered with the Broker Service.
Machines are categorized based load using the Load Indicator of the machines. The load indicator for a machine is calculated based on the resource utilization, the overall user experience on the machine and the number of sessions hosted in the case of multi-session OS machines. The value is aggregated over the selected time period. This helps identify machines that are underutilized or overloaded. This enables proactive action to ensure optimal usage of the infrastructure and improve the overall machine performance. Machines are categorized as follows based on load:
- High(red) - Machines with Load Indicator in the range 71-100
- Medium(green) – Machines with Load Indicator in the range 41-70
- Low(amber) – Machines with Load Indicator in the range 1-40.
- Not Categorized - The machines might not be categorized if they are in shutdown, unregistered or failed state or if resource data is not available for the machine.
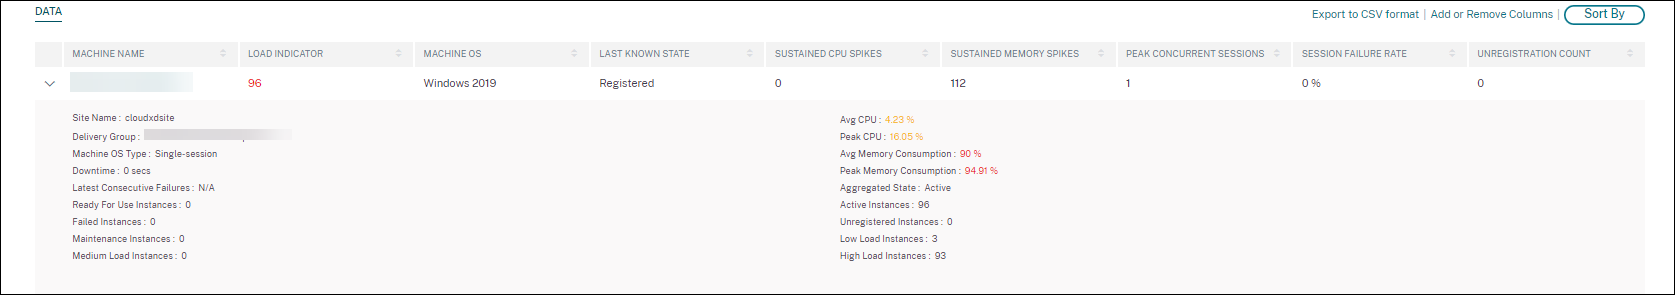
The Machines self-service view provides the important performance metrics related to machines.
 .
.
-
Status: Last known machine state -
Registered,Unregistered,Powered off, orFailed. - Sustained CPU Spikes: Number of CPU spikes in the selected time period. Each CPU spike refers to sustained CPU utilization above the threshold of 80% for 5 min or more.
- Sustained Memory Spikes: Number of memory spikes in the selected time period. Each memory spike refers to sustained memory consumption above the threshold of 80% for 5 min or more.
- Peak Concurrent Sessions: Number of sessions running concurrently on the machine.
- Unregistration Count: Number of times the machine transitioned into an unregistered state during the selected period.
-
<Aggregated State/>Instances: Aggregated state represents the least favorable state the machine has been in, from among the Ready for use, Active, Maintenance, Unregistered and Failed machine states in that order.<Aggregated State>Instances represent the number of instances (15 min intervals) the machine was in a specific Aggregated state during the selected period. The column names are available as Ready for use Instances, Active Instances, Maintenance Instances, Unregistered Instances, and Failed Instances. - Latest Consecutive Failures: Number of consecutive session failures in the last 5 min.
-
Downtime: Period in seconds during which the machine was in
Unregistered,Failed, orPowered offstate during the selected interval. - Avg CPU: Average CPU utilization in the selected time period.
- Peak CPU: Maximum CPU utilization recorded in the selected time period.
- Avg Memory Consumption: Average memory consumption in the selected time period.
- Peak Memory Consumption: Maximum memory consumption recorded in the selected time period.
- Load Indicator: Load Indicator is a score indicating the load on the machine. It is calculated based on the resource utilization, the overall user experience on the machine and the number of sessions hosted in the case of multi-session OS machines. The value is aggregated over the selected time period.
- High, Medium and Low Load Instances: Number of instances during the selected period when the machine was in High Load (Load Indicator: 71-100), Medium Load (Load Indicator: 41-70) and Low Load (Load Indicator: 1-40). These metrics help quantify and evaluate the load on the specific machine.
This view helps admins identify specific machines contributing to poor user experience and correlate the machine resource parameters with the performance factor metrics. Clicking the machine name on the Machines based self-service view opens the Machine Statistics view. For more information, see the Machine Statistics article.
Note:
The values of the metrics, Avg CPU, and Avg memory consumption is calculated only in the duration when the machine was overloaded.
Use case - Optimize Machine Usage using Machine Load metrics
- Go to Machines self-service view. Choose a suitable time period.
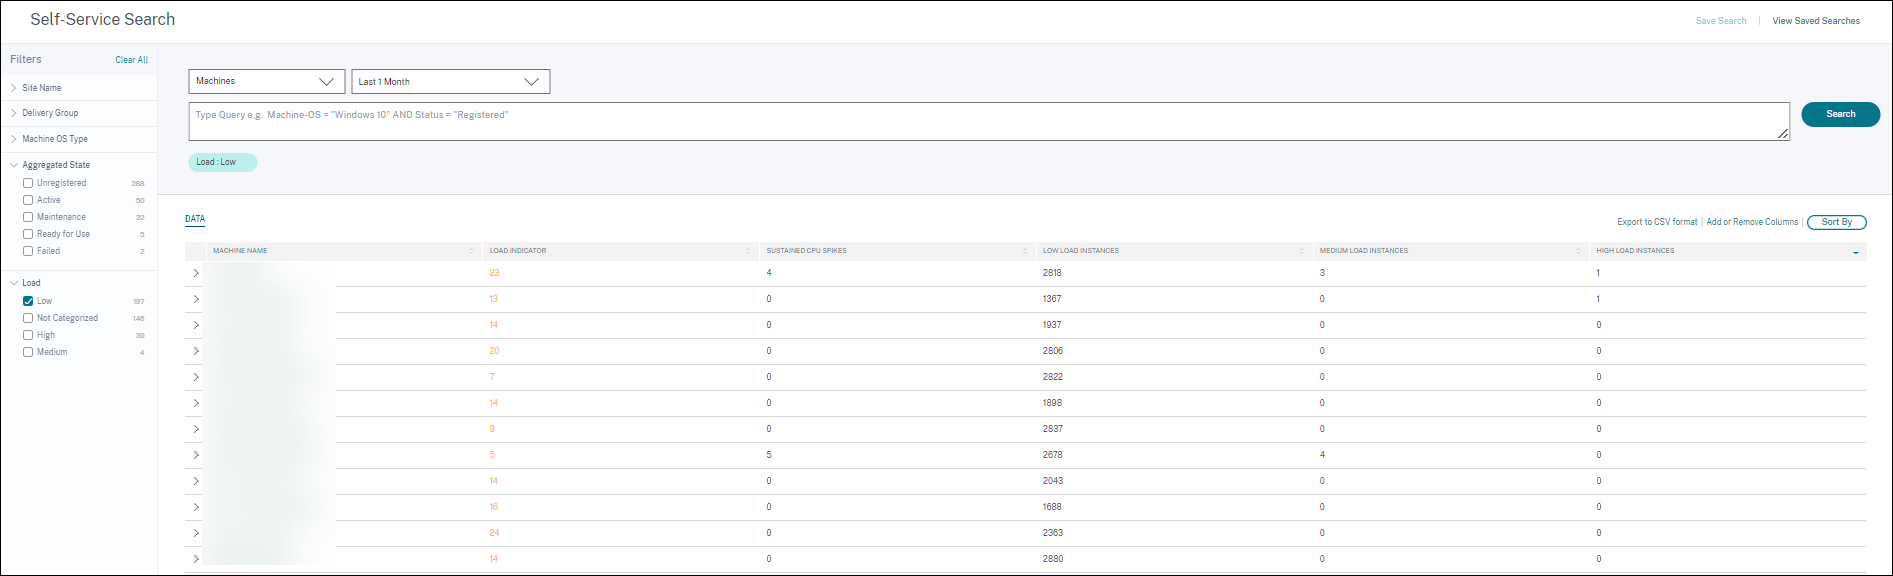
- Expand the Load facet and select the Low category. Machines with aggregated low load for the selected time period are displayed.
- Now, add the High, Medium, and Low Load Instances columns to the view.
- Sort the view on High Load Instances. The screenshot below shows the first page of the sorted view with machines that have aggregated low load during the past one week but a high number of high load instances.
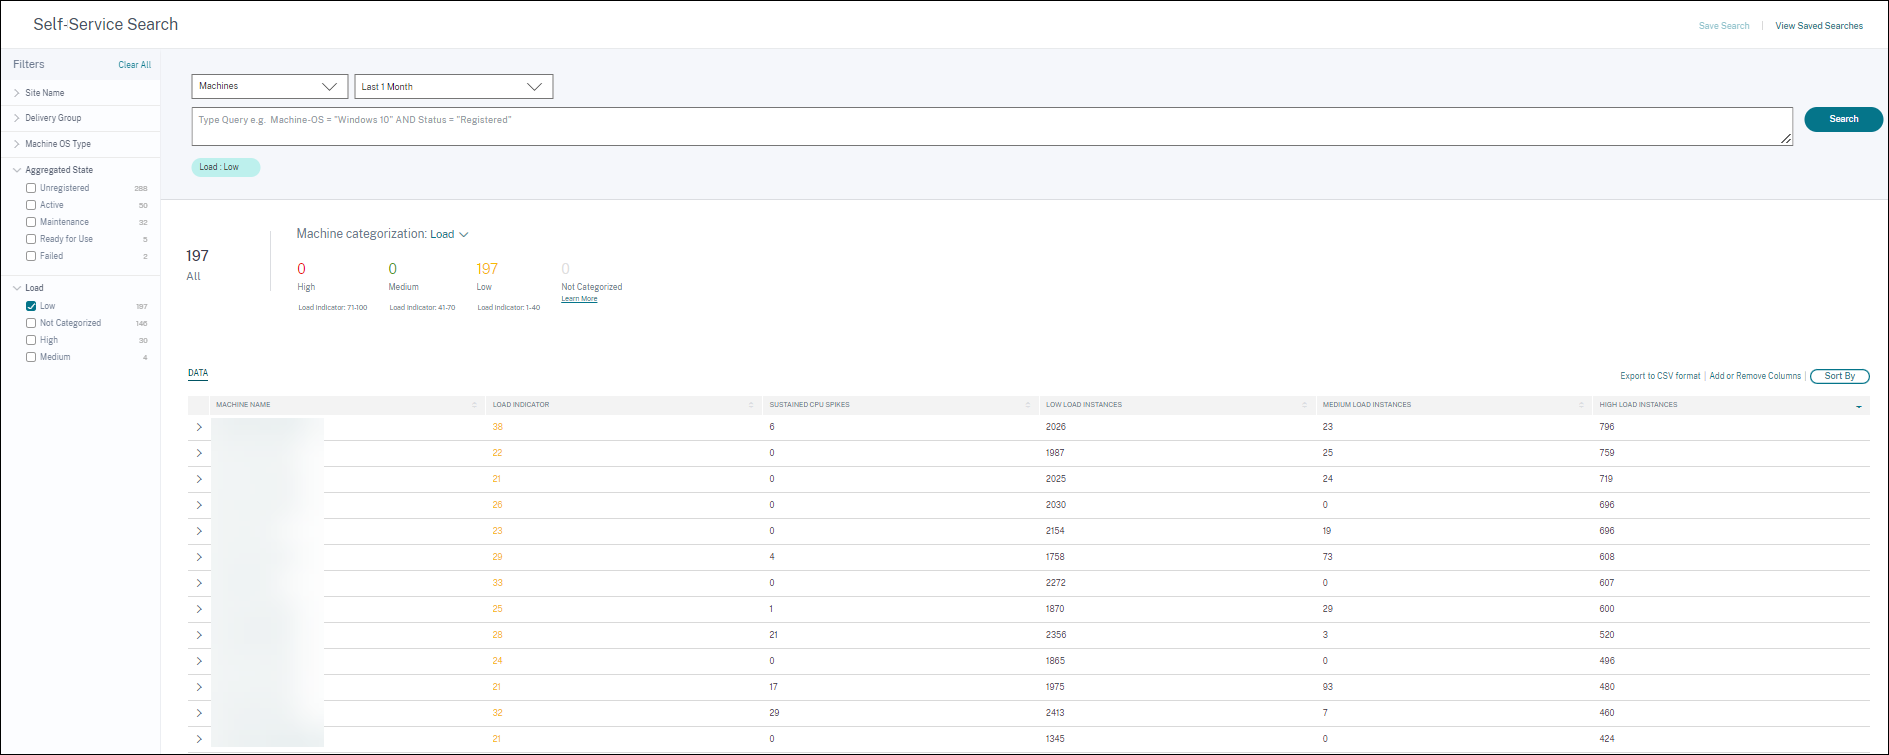 This indicates that though the overall load on these machines is low, the machines are well used. Click the machine name to see the Machine Statistics page. Analyze the usage pattern during the day to understand if more machines need to be onboarded onto the environment.
 - Scrolling to the last few machines in this list shows machines with low aggregate load and the least number of high load instances.
 Click the machine name to see the Machine Statistics page and analyze the usage pattern. Also, the name of the Catalog the machine belongs to, is available here. This helps identify the least used machines that could possibly be shut down or switched on during specific periods during the day to reduce cost.
Using the Load facet to identify the aggregated load on the machines, and the instances columns to identify the machine load pattern during the time period helps optimize the infrastructure as per usage.
Specify search query to filter events
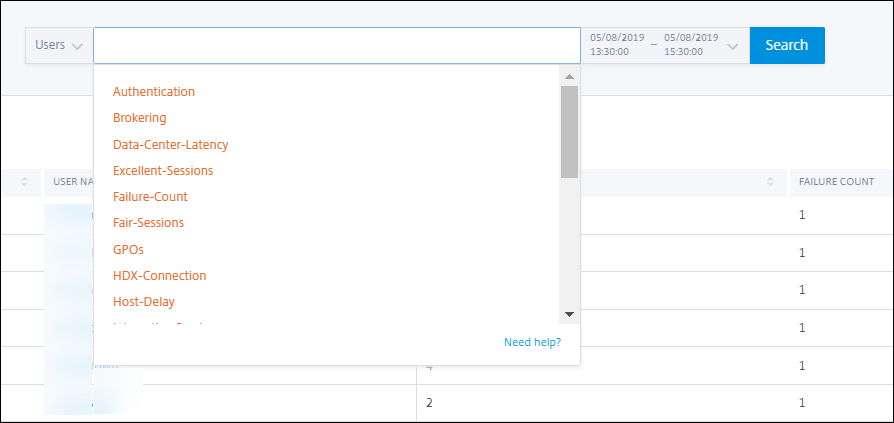
When you place your cursor in the search box, you get the list of search suggestions relevant for the Citrix Analytics for Performance. Use the search suggestions to specify your query and filter the events.
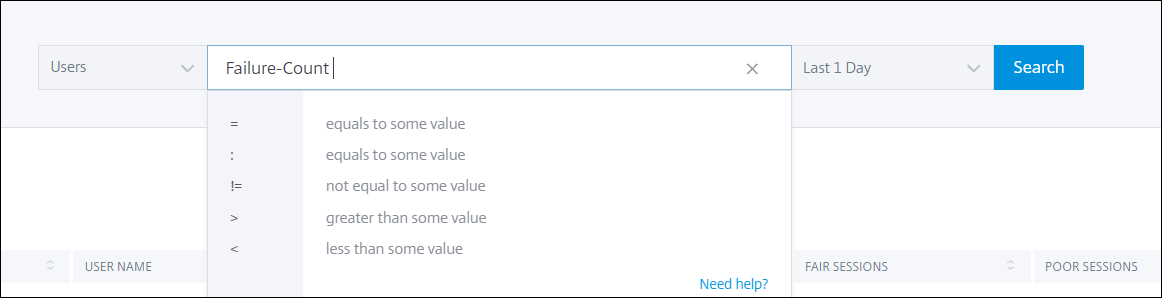
You can also use operators in your search queries to narrow the focus of your search. For more information on the valid operators, see Use search query in the search box to filter events.
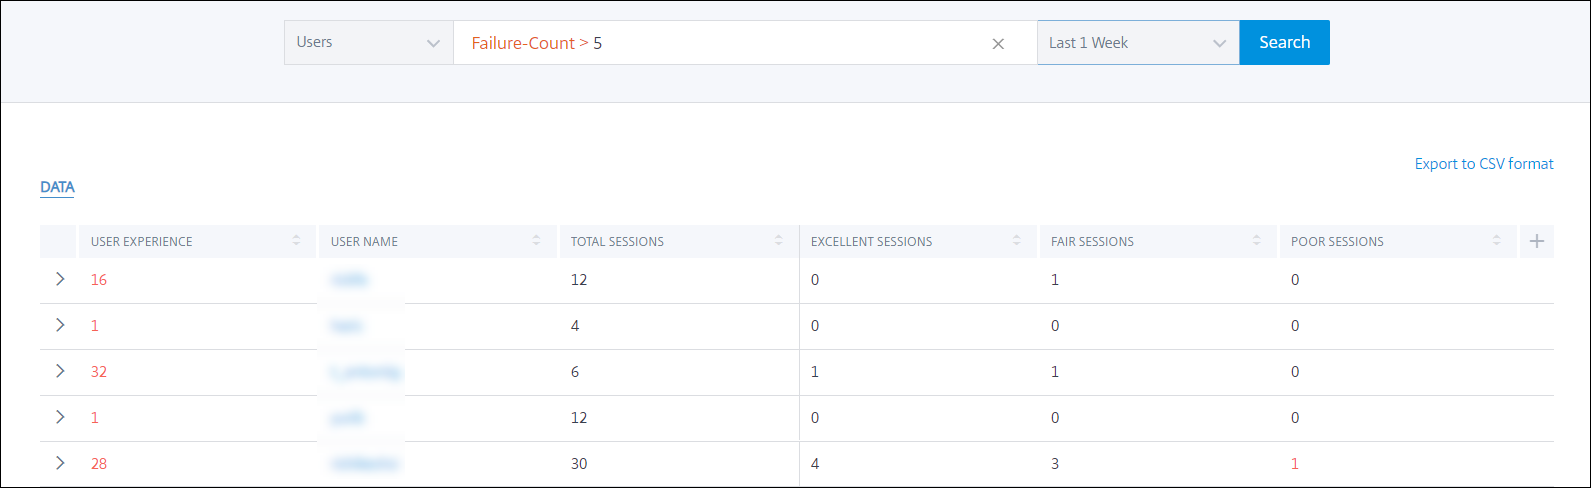
For example, you want to search events for users with Failure-count more than 5 in the past week. Specify the following query.
-
Click the search bar and select the Failure-count field.
-
Click Failure-count, select the > sign, and then specify the value “5”.
-
Click the time period drop-down list and select Last 1 week
-
Click Search to view the events based on your search query.