-
-
-
-
View diagnostic logging
-
This content has been machine translated dynamically.
Dieser Inhalt ist eine maschinelle Übersetzung, die dynamisch erstellt wurde. (Haftungsausschluss)
Cet article a été traduit automatiquement de manière dynamique. (Clause de non responsabilité)
Este artículo lo ha traducido una máquina de forma dinámica. (Aviso legal)
此内容已经过机器动态翻译。 放弃
このコンテンツは動的に機械翻訳されています。免責事項
이 콘텐츠는 동적으로 기계 번역되었습니다. 책임 부인
Este texto foi traduzido automaticamente. (Aviso legal)
Questo contenuto è stato tradotto dinamicamente con traduzione automatica.(Esclusione di responsabilità))
This article has been machine translated.
Dieser Artikel wurde maschinell übersetzt. (Haftungsausschluss)
Ce article a été traduit automatiquement. (Clause de non responsabilité)
Este artículo ha sido traducido automáticamente. (Aviso legal)
この記事は機械翻訳されています.免責事項
이 기사는 기계 번역되었습니다.책임 부인
Este artigo foi traduzido automaticamente.(Aviso legal)
这篇文章已经过机器翻译.放弃
Questo articolo è stato tradotto automaticamente.(Esclusione di responsabilità))
Translation failed!
View diagnostic logging
Overview
Various diagnostic logs including message queue quota exceedance can be detected on the VDAs and sent to the Session Recording server for display in the Session Recording web player.
Message queue quota exceedance
In any of the scenarios outlined below, there’s a chance of exceeding the maximum size of the Microsoft Message Queuing (MSMQ) directory on a VDA, resulting in packet drops or pushback.
- On the VDA side, the incoming rate of Message Queuing messages exceeds the outgoing rate.
- The network connection between the VDA and the Session Recording server is poor and thus messages are stuck in the queue on the VDA side.
- The queue quota on the Session Recording server side is used up and messages are stuck in the queue on the VDA side.
View diagnostic logging
-
Open the Session Recording web player, and click Diagnostic Logging in the left navigation. The Diagnostic Logging page appears.
For example:

All VDAs with diagnostic logs are presented and sorted by their total log counts. You can also view the time the latest log is generated on each VDA and click Refresh to check for more incoming logs.
-
Click a target VDA to view its diagnostic logs.
By default, logs are grouped by type. For example:

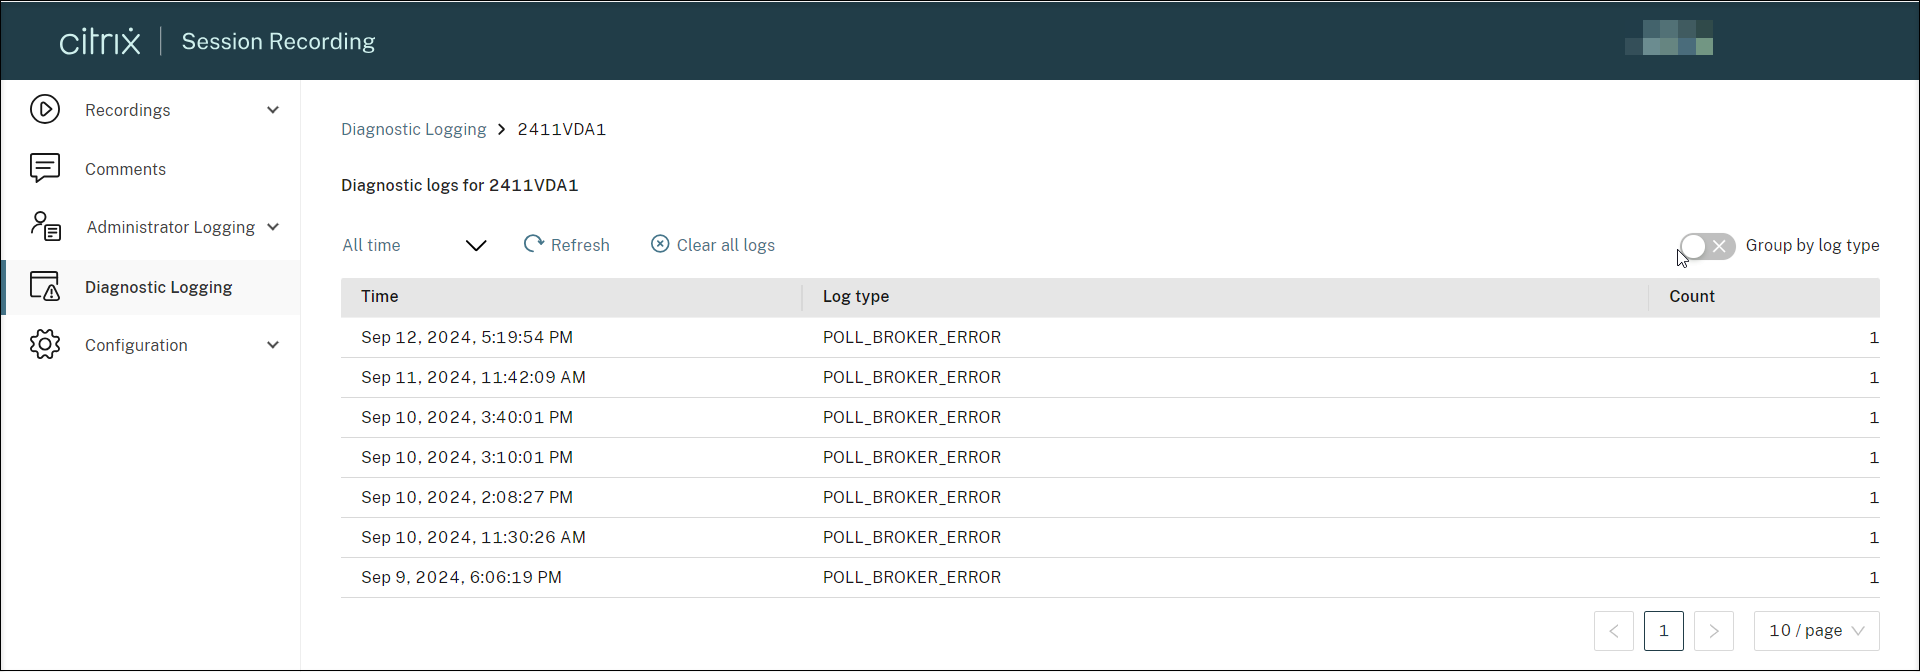
You can disable log grouping by type and list all logs in chronological order instead.
For example:

-
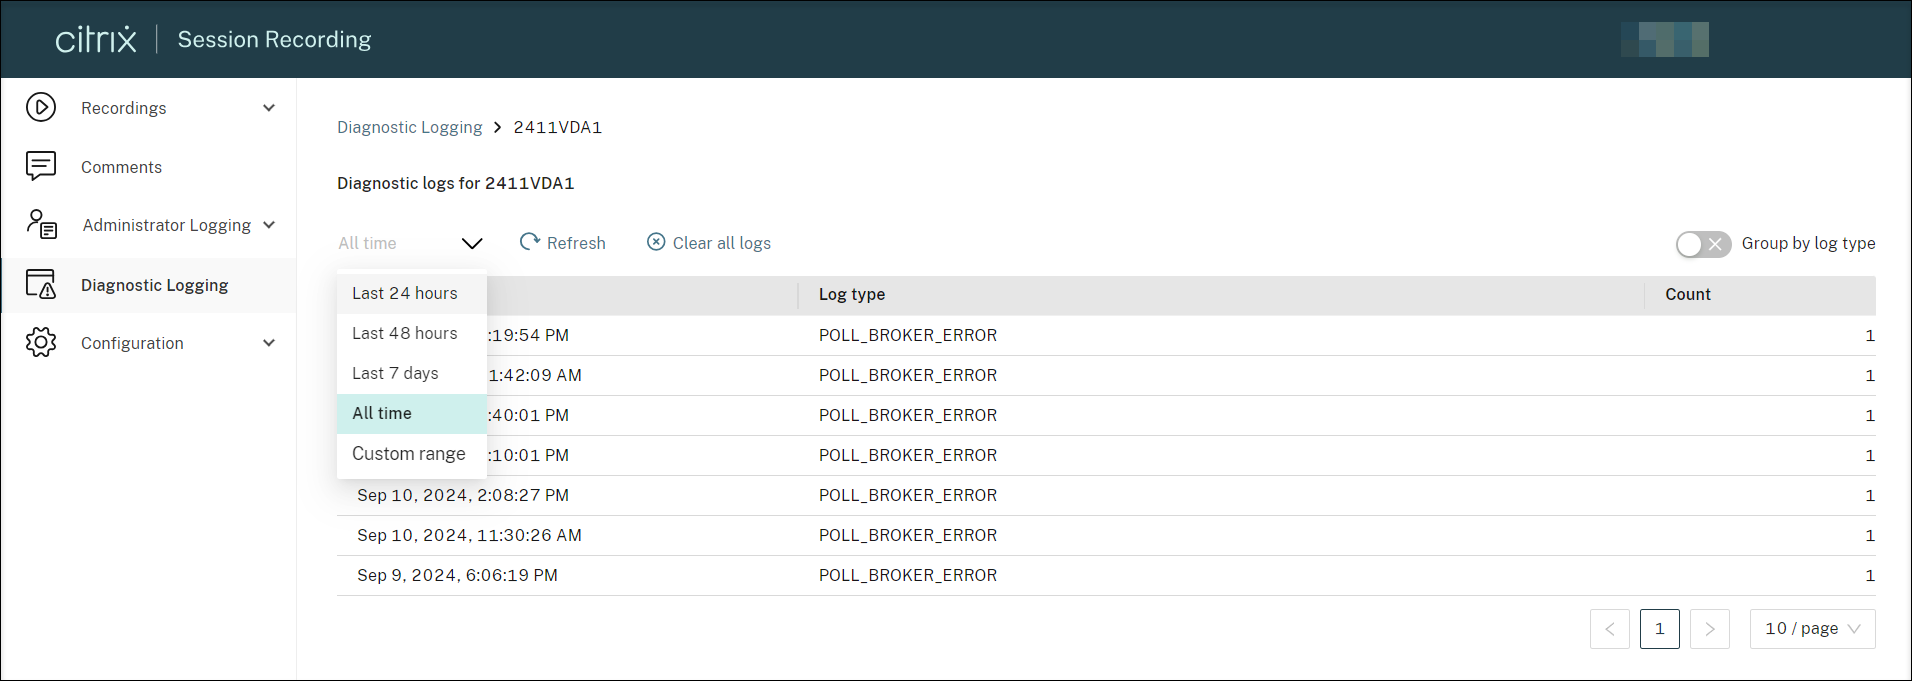
Use the time filter to select and view logs generated during the specified time frame.

-
To check for any incoming logs, click Clear all logs to hide the currently displayed logs, and then click Refresh.
Configure diagnostic logging
Diagnostic logging is enabled by default. You can disable and re-enable the feature by using the following registry value on the target VDA:
HKEY_LOCAL_MACHINE\SOFTWARE\Citrix\SmartAuditor\Agent\DiagnosticLoggingEnabled
Value data: 1 = enabled, 0 = disabled
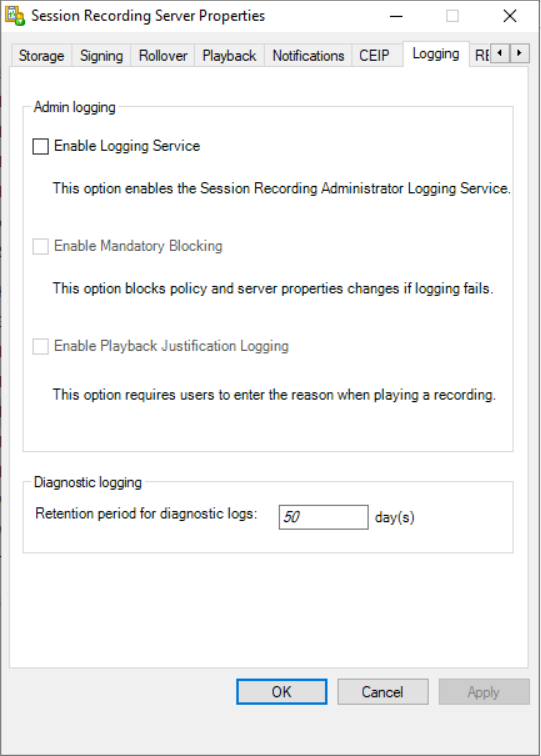
You can also set how long these logs can be retained on the Session Recording database. To do so, go to the Logging tab of Session Recording Server Properties and configure the Retention period for diagnostic logs. The default value is 30 days.

Share
Share
This Preview product documentation is Citrix Confidential.
You agree to hold this documentation confidential pursuant to the terms of your Citrix Beta/Tech Preview Agreement.
The development, release and timing of any features or functionality described in the Preview documentation remains at our sole discretion and are subject to change without notice or consultation.
The documentation is for informational purposes only and is not a commitment, promise or legal obligation to deliver any material, code or functionality and should not be relied upon in making Citrix product purchase decisions.
If you do not agree, select I DO NOT AGREE to exit.