Tech Brief: Analytics
Organizations’ IT environments are becoming more complex as they begin to adopt SaaS, cloud, and mobile applications. Administrators need the visibility into their environment not only to protect it from malicious users, but also to improve the user experience proactively. Citrix Analytics pulls together the entire Citrix portfolio to provide visibility into the status and context of individual users. Unlike some of the other monitoring tools that Citrix provides, Citrix Analytics gives you proactive and prescriptive insights into your environment to resolve issues before they become a problem. Citrix Analytics is driven through machine-learning to provide you with the necessary insights without information overload.
Overview
Citrix Analytics generates actionable insights, enabling administrators to proactively handle user and application security threats, improve app performance, and support continuous operations. Citrix Analytics is available as a cloud service delivered through Citrix Cloud. Citrix Analytics can be broken up into three categories: Security, Performance, and Usage. Citrix Analytics for Security allows you to monitor and identify inconsistent or suspicious activity within your environment. Usage Analytics gives you visibility to how users interact with various Citrix products. Citrix Analytics for Performance™ provides user-centric experience scores, application, and infrastructure performance scores through advanced analytics.
Citrix Analytics for Security™
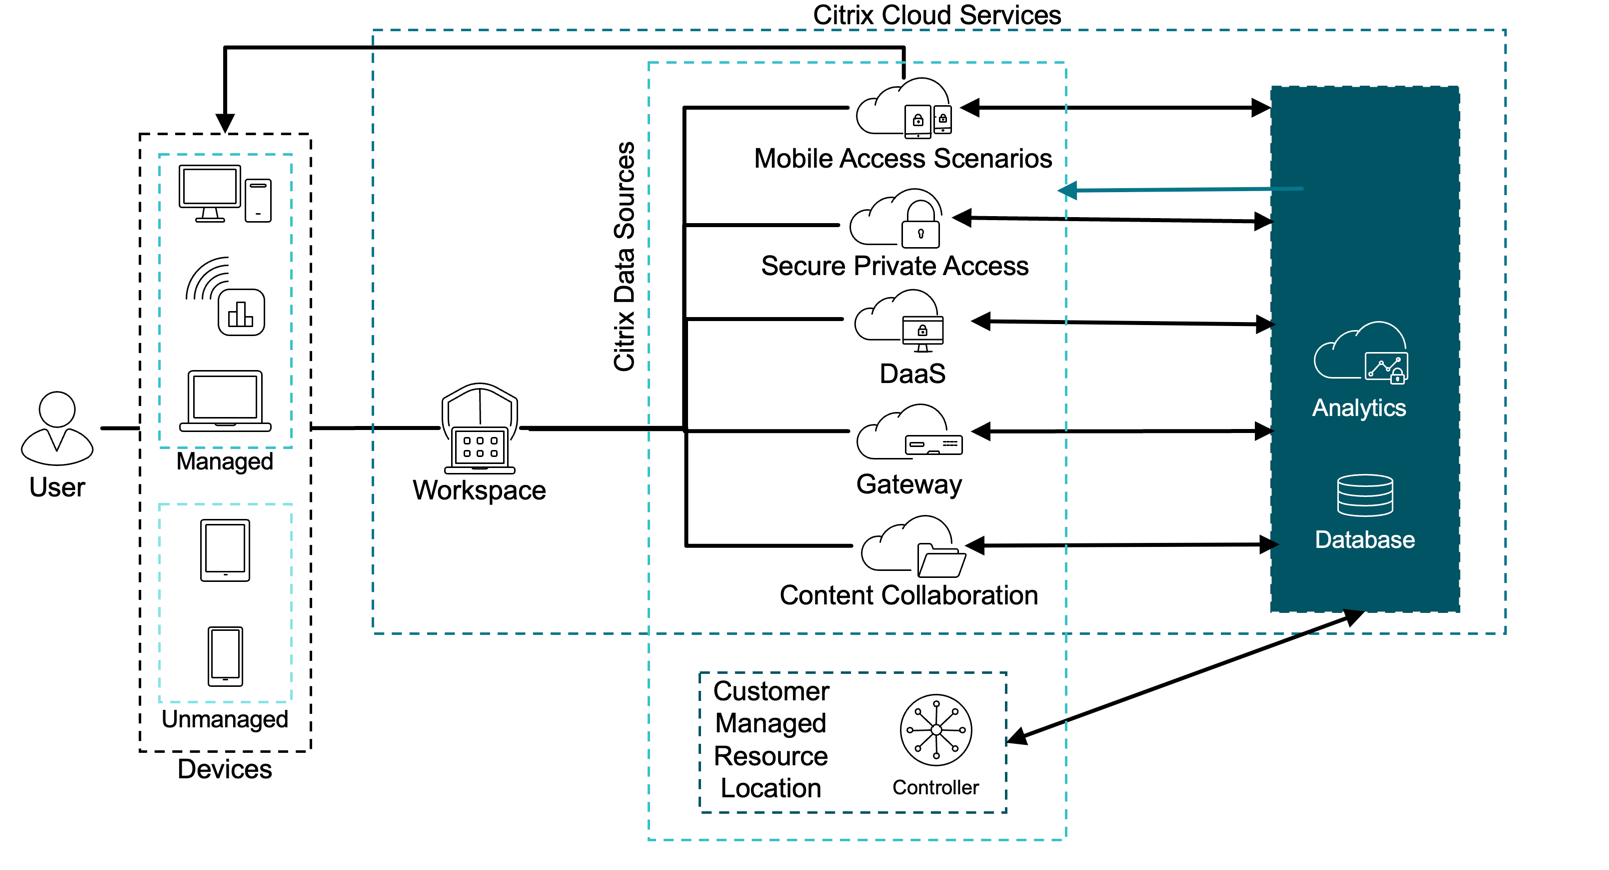
Citrix Analytics for Security collects data across Citrix and third-party products and generates actionable insights.
Citrix data sources
The following table lists various Citrix data sources supported by Citrix Analytics for Security.
| Data Source | Deployment Type | Required Agents | Product Component and version |
|---|---|---|---|
| Citrix Endpoint Management | Service | N/A | Citrix Endpoint Management |
| Gateway | On-premises | Application Delivery Management agent | Citrix Gateway 12.0.56.16 or later |
| Citrix Identity provider | Service | N/A | Citrix Identity and Access Management |
| Citrix Secure Private Access | Service | N/A | Citrix Secure Private Access |
| Citrix Remote Browser Isolation | Service | N/A | Citrix Remote Browser Isolation |
| Citrix DaaS | Service | N/A | Citrix Workspace app for Windows 1907 or later, Citrix Workspace app for Mac 1910.2 or later, Citrix Workspace app for HTML5 2007 or later, Citrix Workspace app for Chrome-Latest version available in Chrome Web Store, Citrix Workspace app for Android-Latest version available in Google Play, Citrix Workspace app for iOS-Latest version available in Apple App Store, Citrix Workspace app for Linux 2006 or later. |
| Citrix Virtual Apps and Desktops | On-premises | Virtual Apps and Desktops agent | Citrix Virtual Apps and Desktops 7 1808, Citrix XenApp and XenDesktop 7.16 and later |
| Agent is required for advanced features such as Actions. | Citrix Workspace app for Windows 1907 or later, Citrix Workspace app for Mac 1910.2 or later, Citrix Workspace app for HTML5 2007 or later, Citrix Workspace app for Chrome-Latest version available in Chrome Web Store, Citrix Workspace app for Android-Latest version available in Google Play, Citrix Workspace app for iOS-Latest version available in Apple App Store, Citrix Workspace app for Linux 2006 or later | ||
| Citrix Director 7.16 or later | |||
| For Workspace users: Virtual Apps and Desktops on-premises Sites must be added to Workspace using Site Aggregation. | |||
| For StoreFront users: StoreFront deployment version must be StoreFront 1906 or later. StoreFront must be accessed using one of the clients: Citrix Receiver™ for websites in HTML5-compatible browsers, Citrix Workspace™ app 1907 for Windows or later, Citrix Workspace app 2006 for Linux or later, Citrix Workspace app 2006 for Mac or later. | |||
| LTSR support: For Citrix Virtual Apps and Desktops™ 7 1912 LTSR, the supported StoreFront version is 1912. |
External data sources
The following table lists the external data sources (third-party products) that are supported by Citrix Analytics for Security.
| Data Source | Deployment Type | Required Agents |
|---|---|---|
| Microsoft Graph Security | Service | N/A |
| Microsoft Active Directory | On-premises | Citrix Cloud Connector™ |
Citrix Analytics for Security detects anomalous user behavior through its machine learning μ-service. It assigns users a risk score, a value that indicates the aggregate level of risk a user poses through its risk scoring μ-service. This score is a dynamic value that is based on User Behavior Analytics (UBA). Administrators can create policies to automate processes and apply actions based on risk indicators. Citrix Analytics for Security retains data for 13 months. If the administrator turns off data processing for a specific data source, the data that was already captured remains stored for 13 months. More information on what specific logs per data source are collected here.
Citrix Analytics for Security receives the information in the following manner. For the Citrix Secure Private Access™ service, Citrix Endpoint Management, and Citrix Gateway service (cloud) it receives its information directly from the control plane of the specific data source. For NetScaler Gateway on-premises, it receives the data from the Application Delivery Management agent. For Citrix DaaS and Citrix Virtual Apps and Desktops it receives its information through Citrix Workspace app. To get active directory data, Citrix Analytics communicates with the Citrix Cloud Connectors. For Microsoft Graph security, we can get information from Azure AD identity protection and Windows Defender ATP through graph APIs.
To use Citrix Analytics for Security, you must have a Citrix Cloud account. Go to https://citrix.cloud.com and sign in with your existing Citrix Cloud account. An in-depth guide on how to get started can be found here.
Users Dashboard
The users dashboard allows you to get a holistic view of any users that are considered risky within your organization. The users are categorized between high, medium, and low risk users.
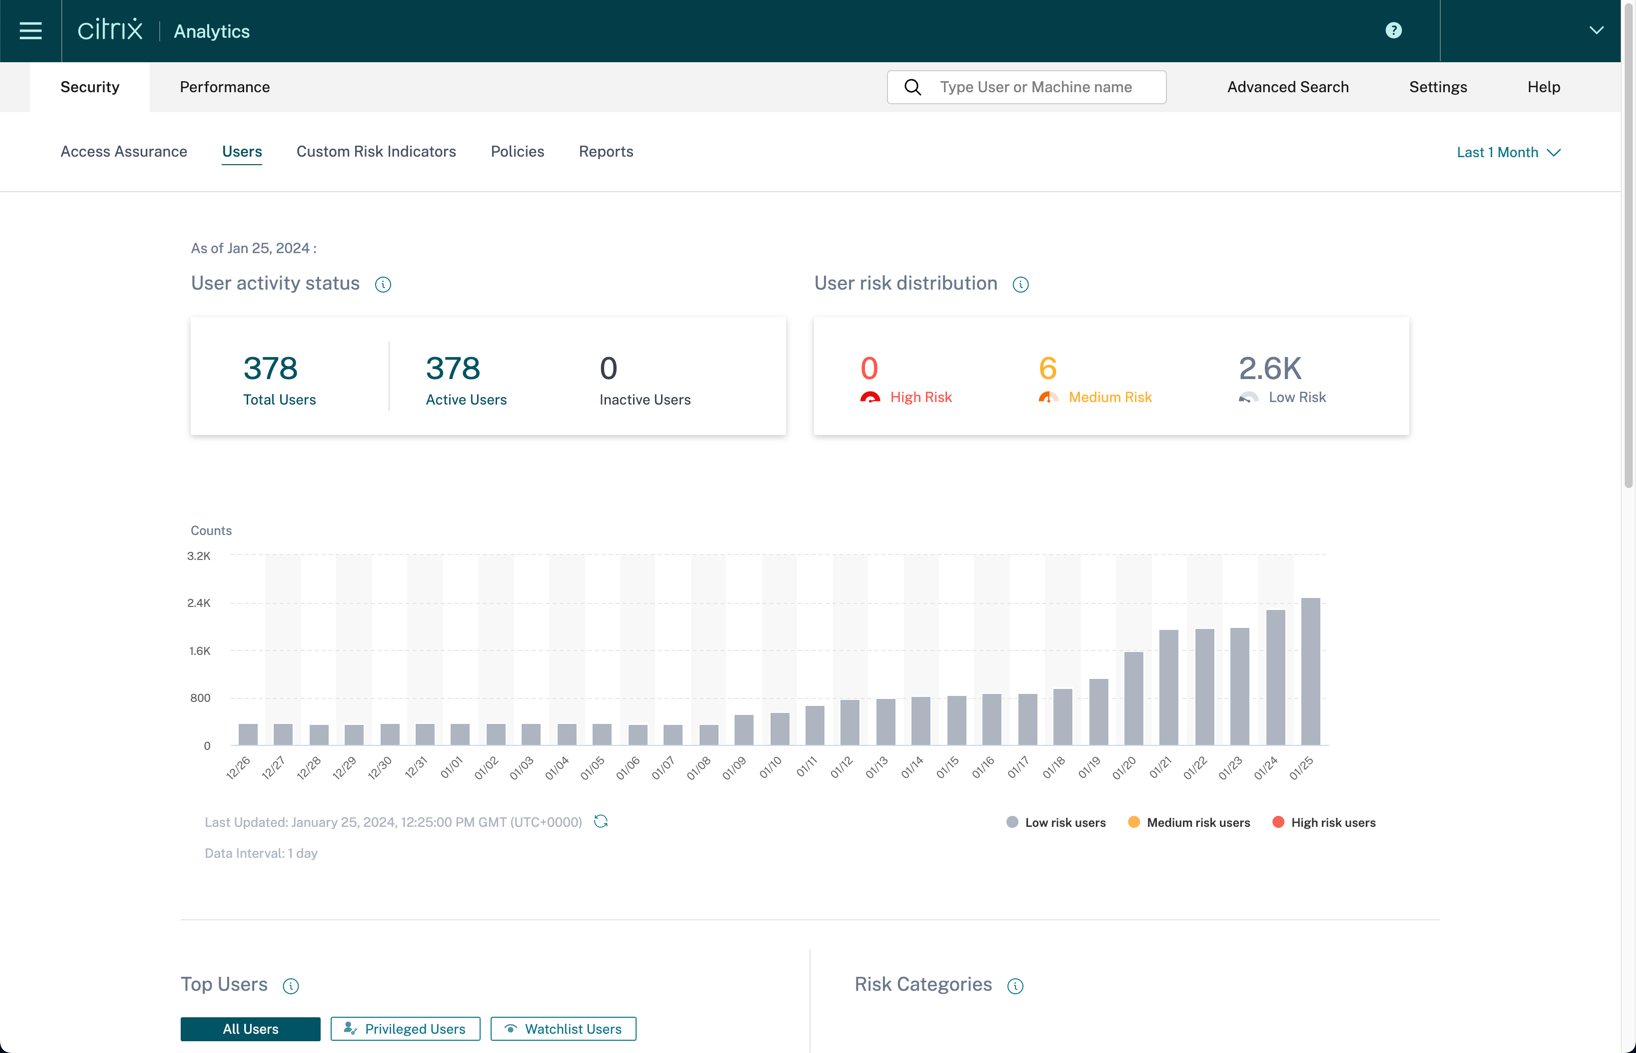
Administrators can change views to show users with the highest score for all users, privileged users, and watchlist users. Also, it shows the risk categories, essentially giving you a comprehensive list of risk exposure and what requires immediate attention. More information on the user dashboard can be found here.
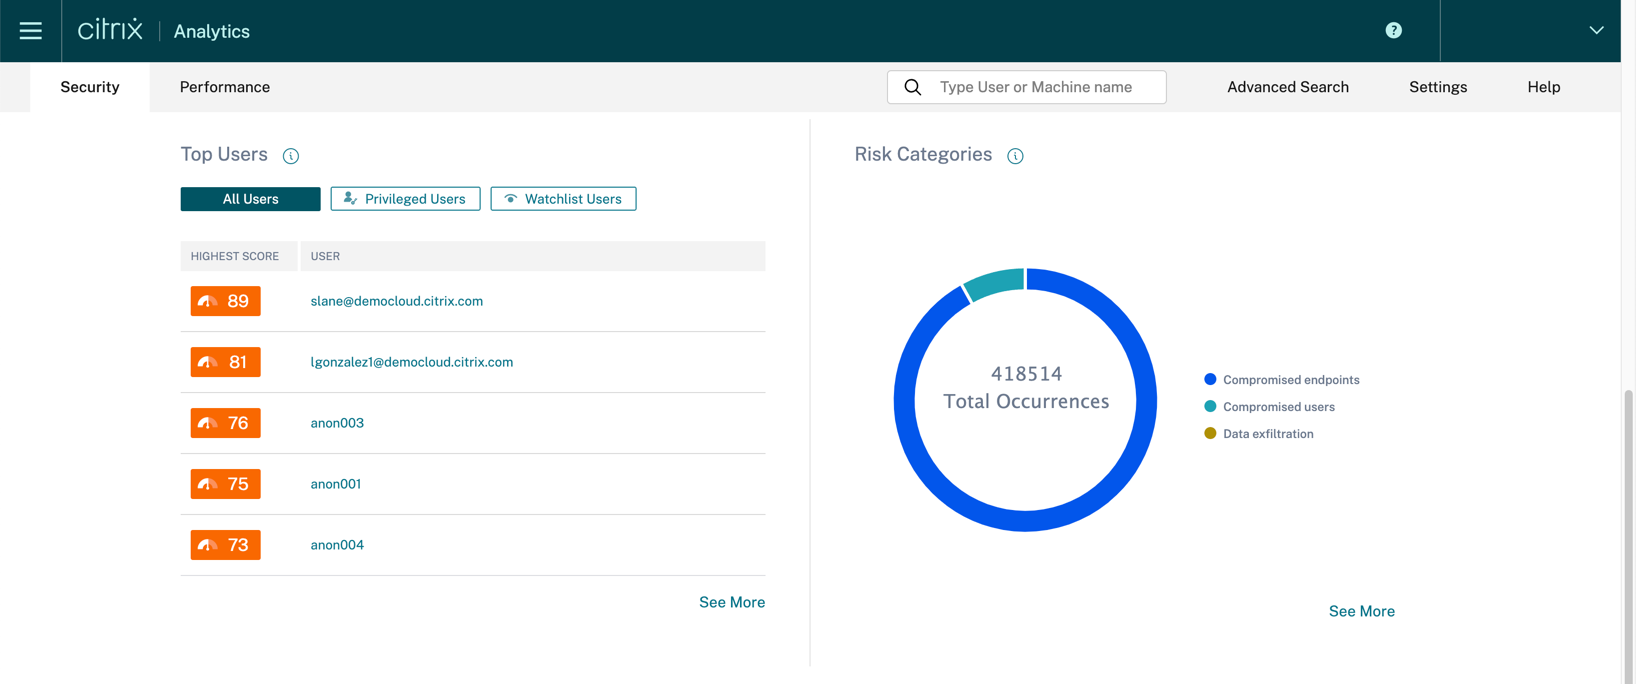
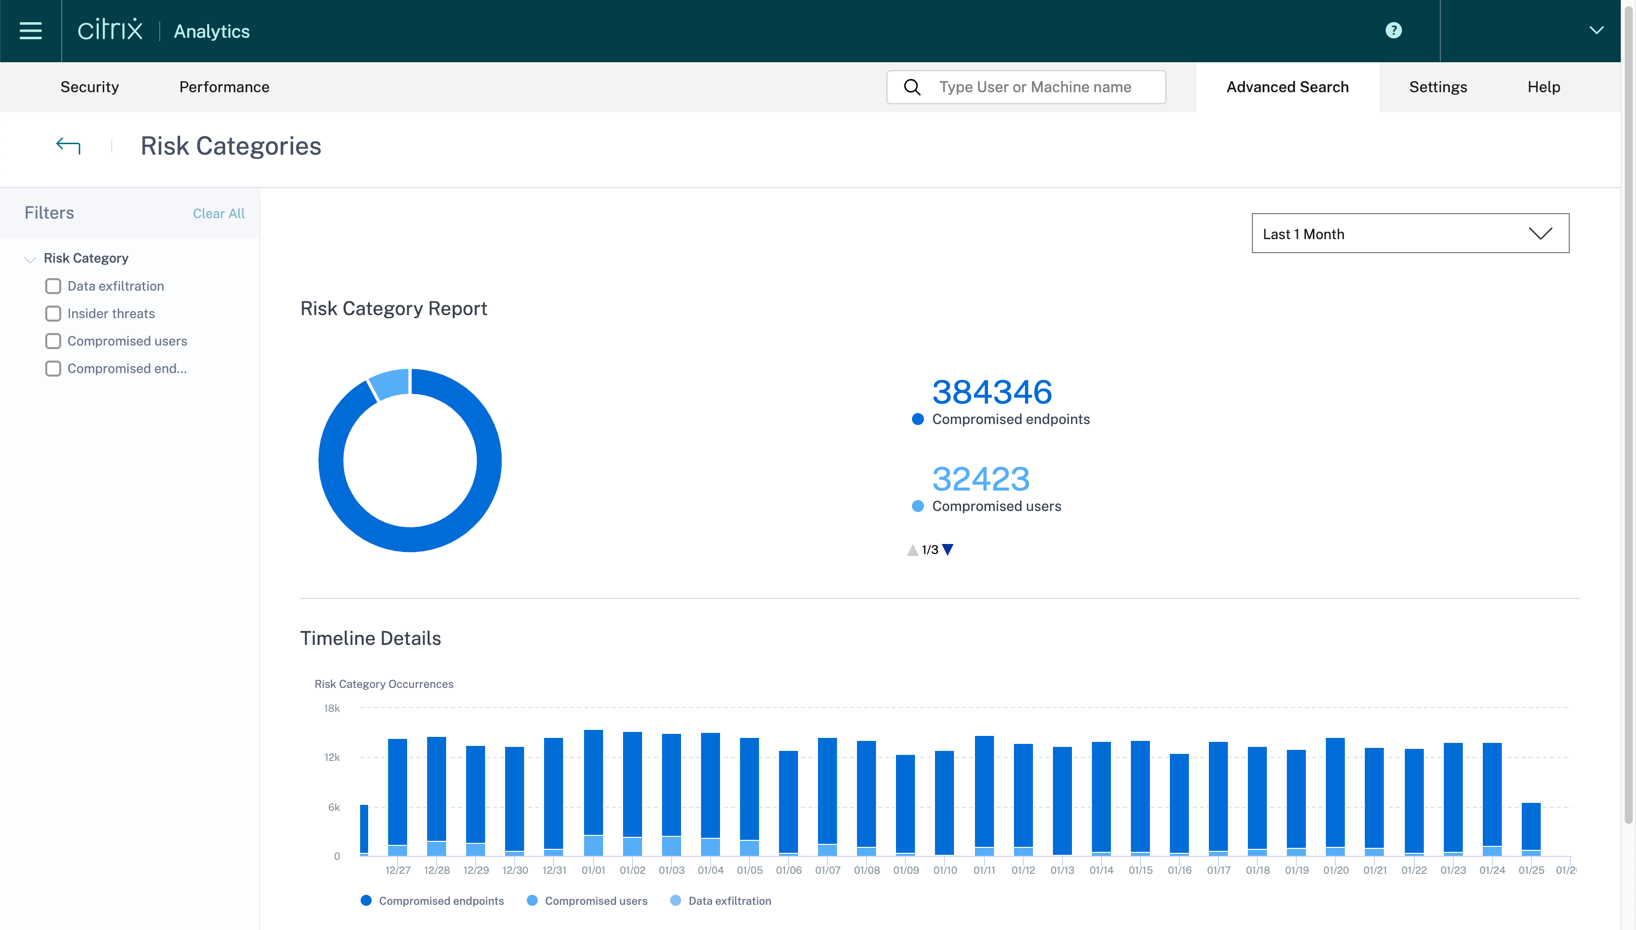
With all these dashboards, you can click and get more granular information. For example, if you click see more under the Risk Categories, you get a summary of risk indicator occurrences under each category.
Also, if under the risky users dashboard, you click a specific user—it will redirect you to the User Risk Timeline. This timeline allows you to gain deeper insights into what actions the user has done that are risky. You will also see if any automated actions were taken against that specific user. By clicking each event, you can get additional information as to when an event happened and where the source of that event is. Within the user risk dashboard, you can find user information such as AD information (phone, email, title) and information on what application, devices, and locations they are using. More information on the risk timeline can be found here.

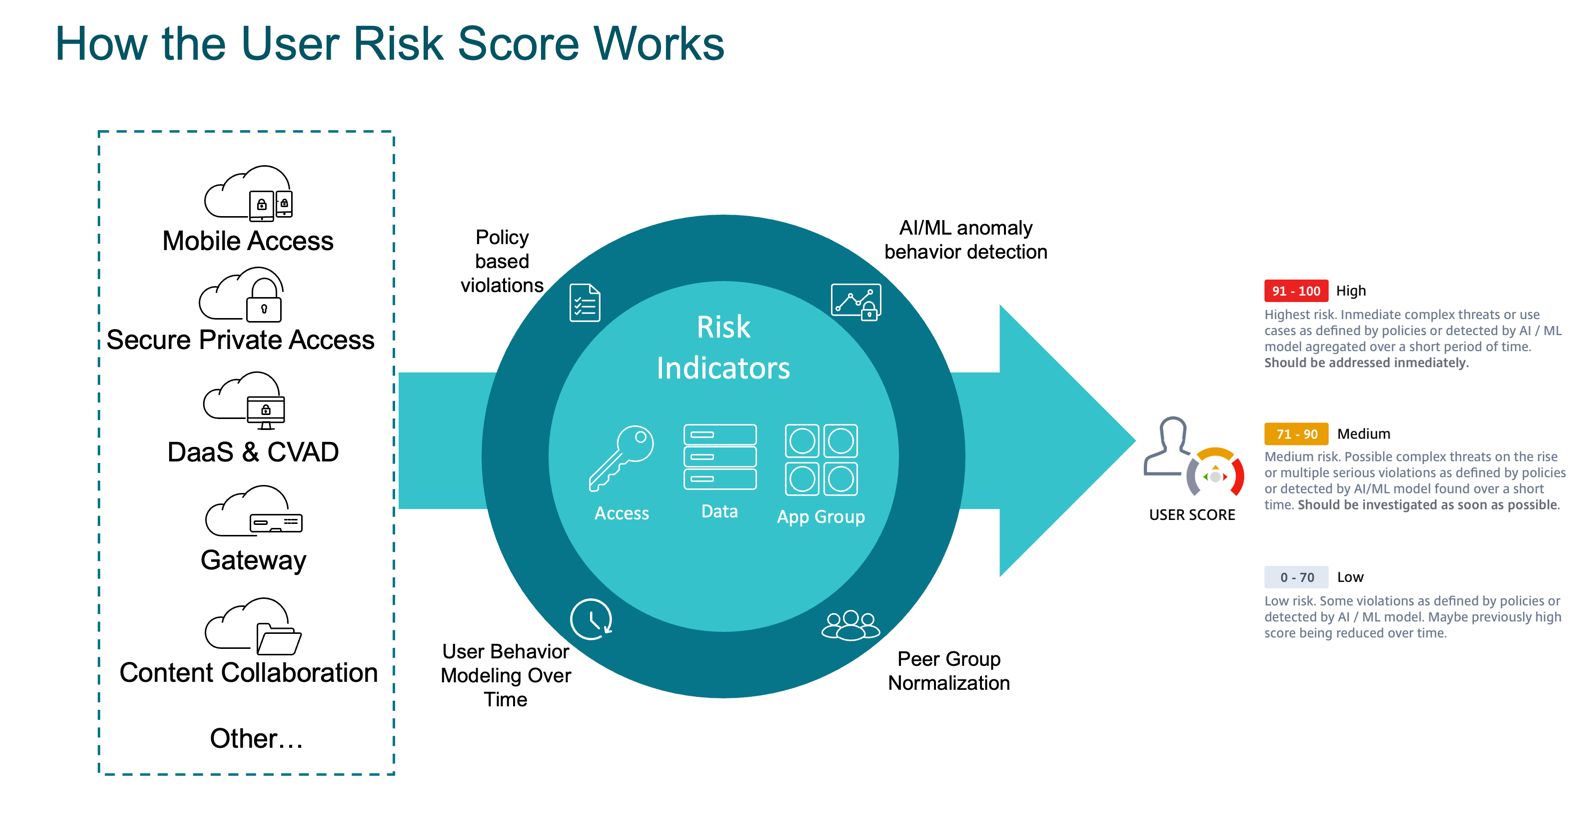
The risk scores are calculated through policy-based violations (set by administrators), user behavior modeling over time, AI/ML anomaly behavior detection, and peer group normalization. The risk scores are values that indicate the aggregate level of risk a user poses. The risk indicators are user activities that look suspicious or can pose a security threat to your organization. There are default risk indicators that are used by the system, but an administrator can create custom risk indicators as well.
Policies and Actions
Policies are defined so once a condition is met, the action is run. A policy contains one or more conditions, and a single action. There are default policies available—these policies have pre-defined conditions and have a corresponding action. These default policies can be used as is or modified based on your requirements. The default policies are the following:
- Session-start-outside-geofence
- First time access from device
-
Potential data exfiltration
Actions are the responses to the suspicious events that prevent future anomalous events from occurring. Actions can be invoked at will by the Citrix Analytics administrator or automatically by the system based on rules defined by the administrator. Currently the following actions are available:
- Global
- Request End User response
- Add to watchlist
- Notify administrator(s)
- Notify End User
- Remove from watchlist
- Gateway
- Log off active sessions
- Lock user account
- Unlock user account
- Apps and Desktops
- Log off active sessions
- Start session recording
Currently the following conditions are available when creating a policy:
- Risk score
- Risk score
- Citrix Gateway
- EPA scan failure
- Impossible travel
- Excessive authorization failures
- Logon from suspicious IP
- Suspicious logon
- Unusual authentication failure
- Citrix Secure Private Access
- Attempt to Access Blacklisted URL
- Excessive data download
- Unusual upload volume
- Apps and Desktops
- Potential data exfiltration
- Impossible travel
- Suspicious logon
- Citrix Endpoint Management™
- Device with blacklisted apps detected
- Jailbroken / rooted device detected
- Unmanaged device detected
More information on how to set up policies and actions can be found here.
Access Assurance Location Dashboard
The Access Assurance dashboard provides an overview of the locations and networks from where your users are accessing virtual apps or virtual desktops. Citrix Analytics for Security receives these user logon events from Citrix Workspace app installed on the users’ devices.
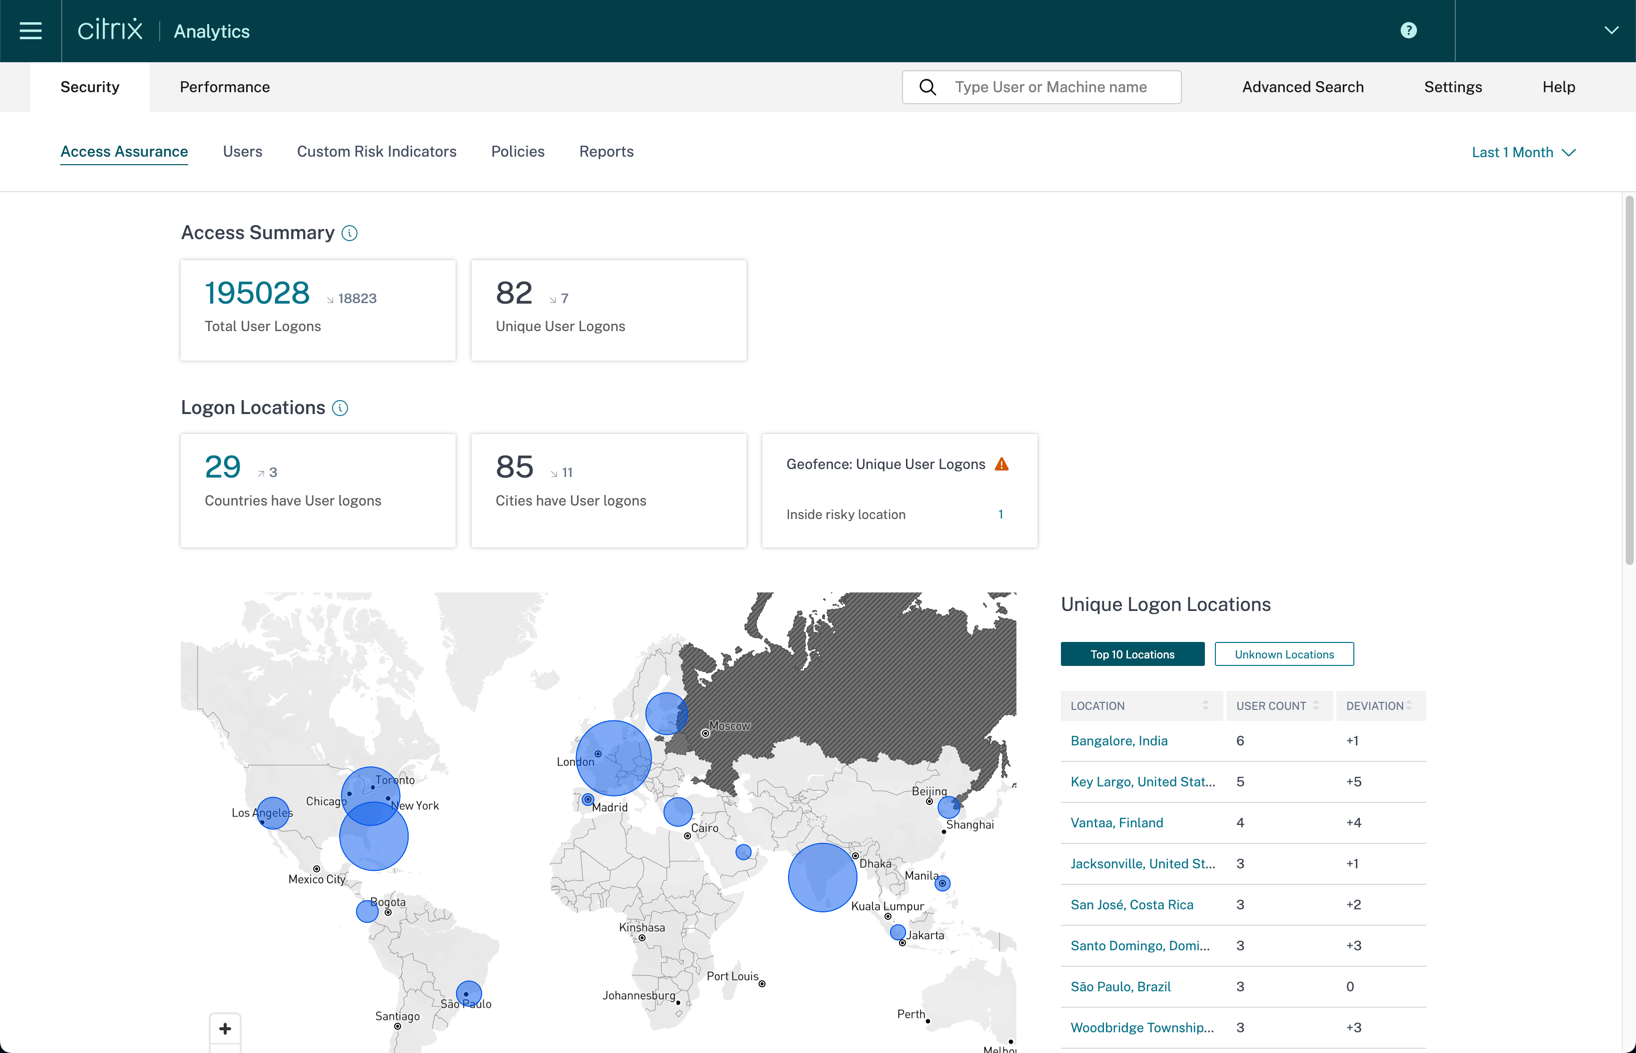
The Access Assurance Location dashboard provides an overview of the locations from where your users are accessing virtual apps or virtual desktops. Citrix Analytics for Security receives these user logon events from Citrix Workspace app installed on the users’ devices. The location information is provided at the city and the country level and does not represent a precise geolocation. The Access Summary dashboard provides the following information for a selected period:
- Total number of user logons across the locations (worldwide).
- Total number of unique user logons across the locations (worldwide).
- Total number of cities from where the users have logged on.
- Total number of countries and the unique user logons in the geofencing areas.
- Top 10 locations with unique user logons.
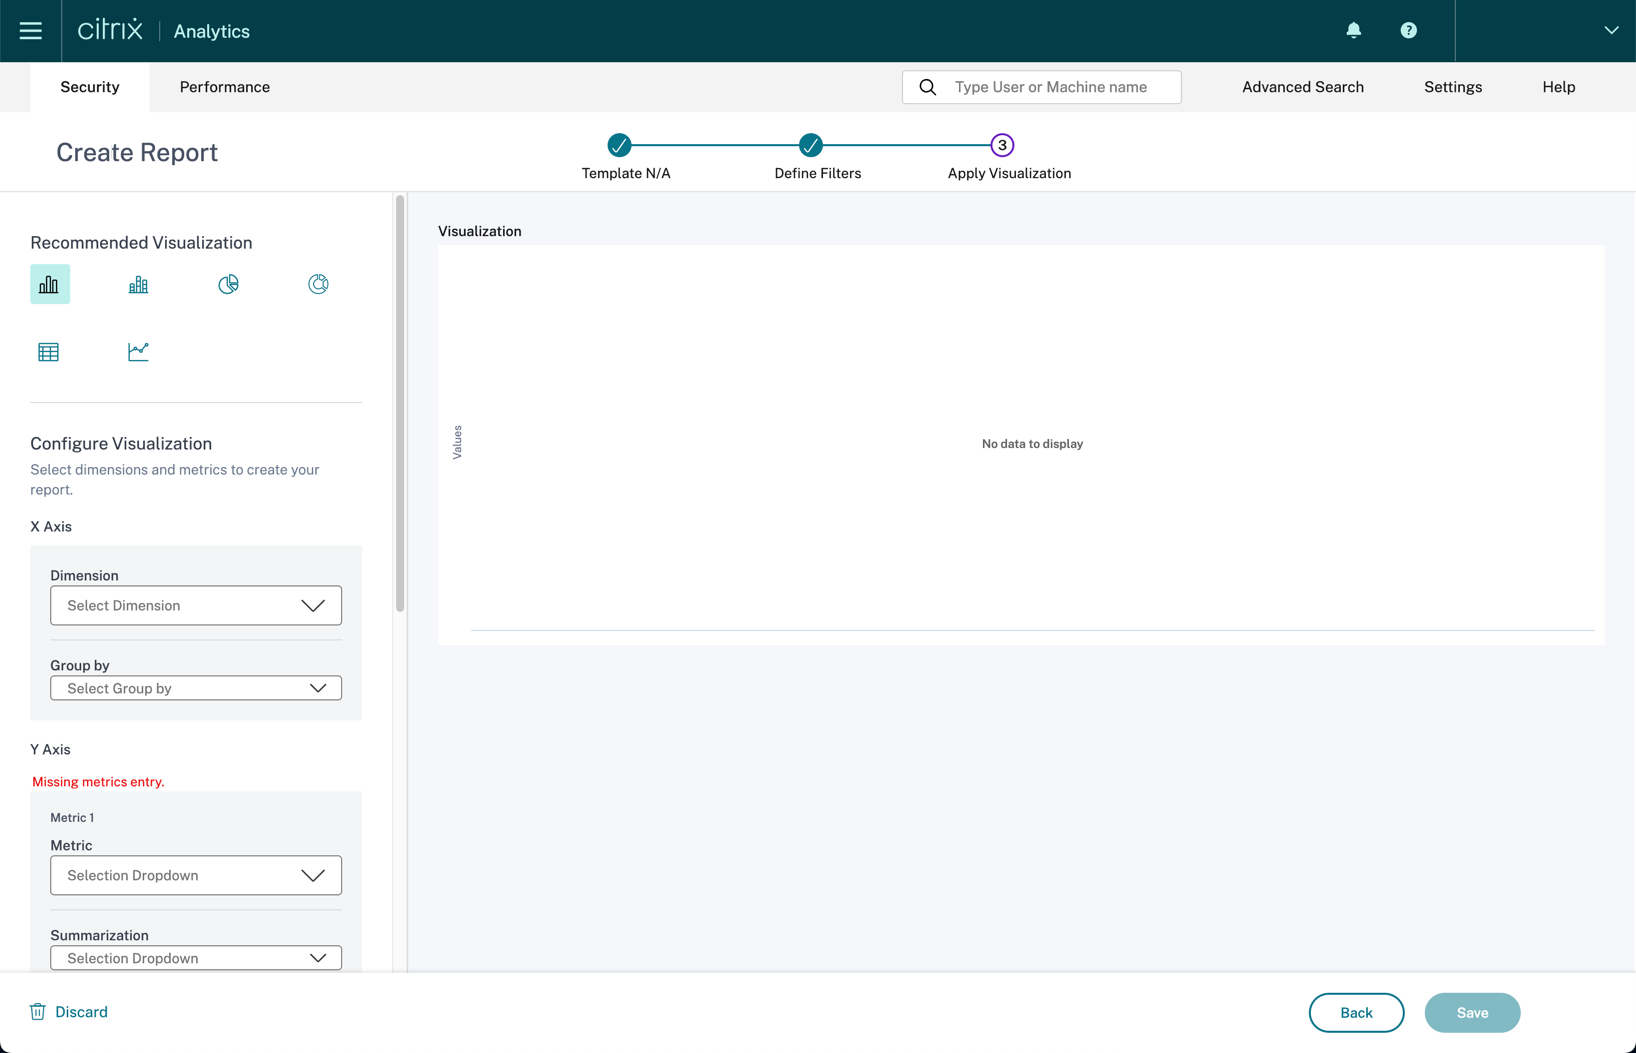
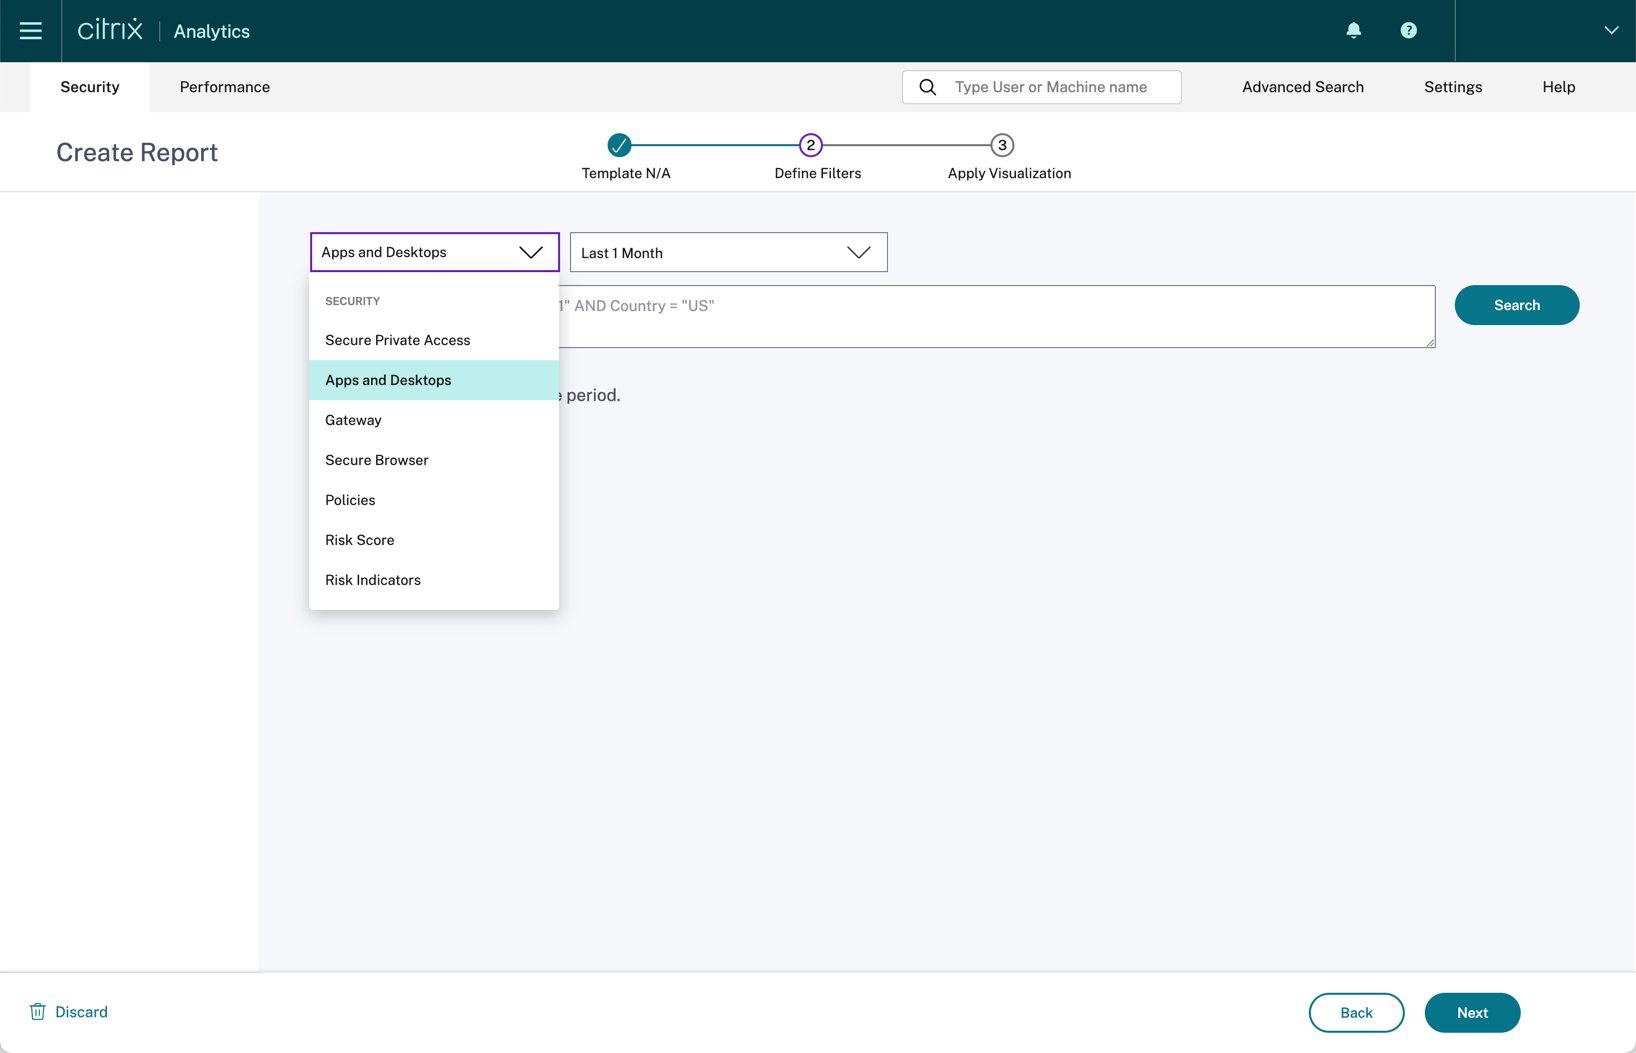
Reporting
Administrators can create custom reports from the events received in your data sources. Currently, the supported data sources for custom reports include Secure Private Access, Apps and Desktops, Gateway, Secure Browser, Policies, Risk Score, Risk Indicators. More information on how to create custom reports can be found here.
Citrix Analytics for Performance
Citrix Analytics for Performance quantifies user experience and gives customers end-to-end visibility on what the root cause for end user experience is. It also provides multi-site aggregation and reporting so customers who have multiple sites can consume data from a single pane of glass instead of having to log into multiple Director consoles. Finally, it provides the infrastructure performance score to give administrators a cohesive view of their infrastructure health.
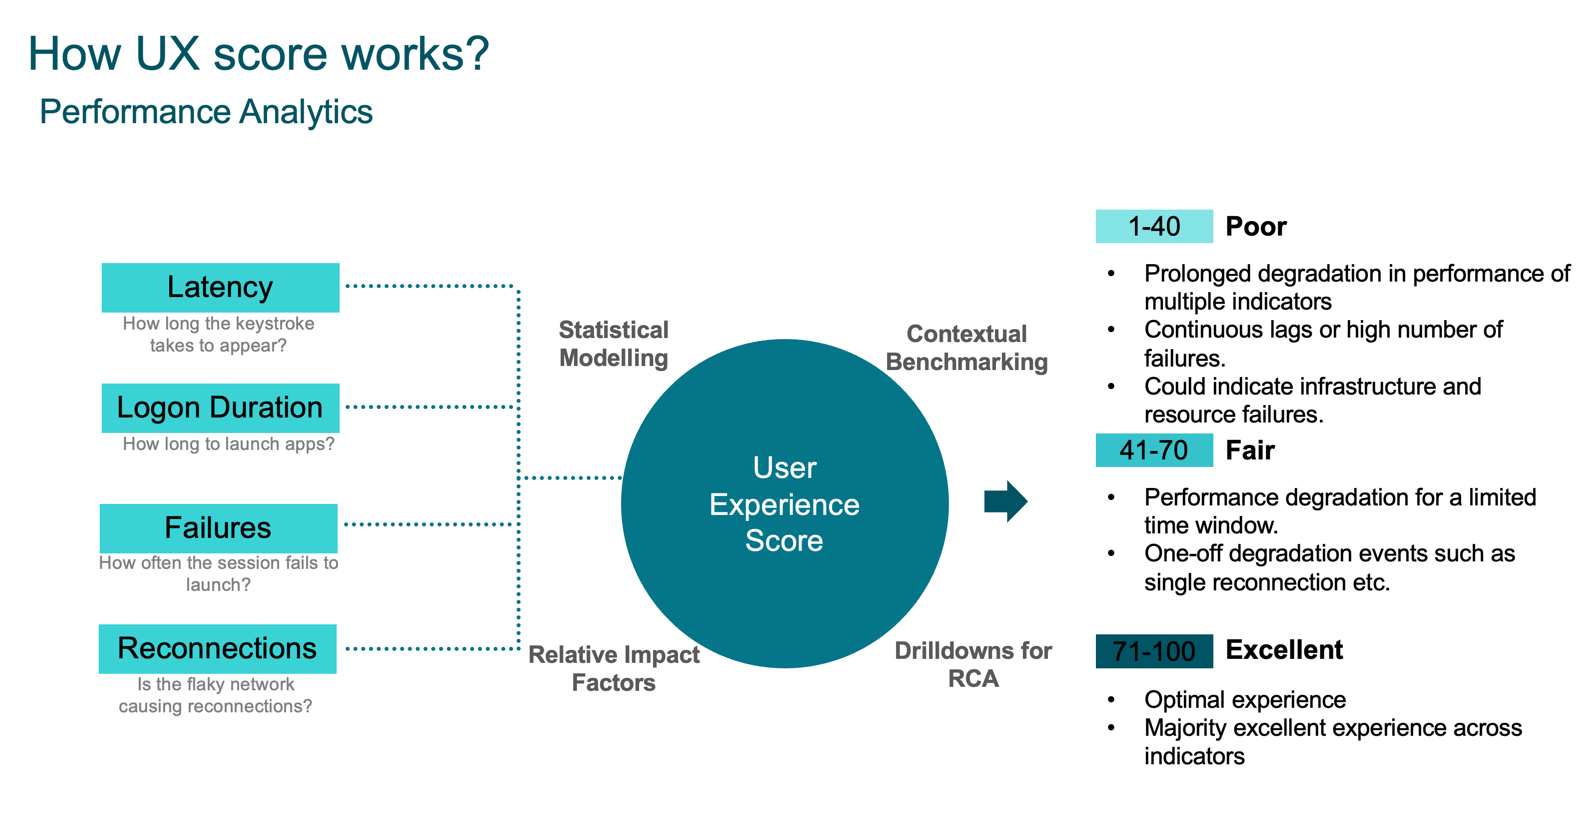
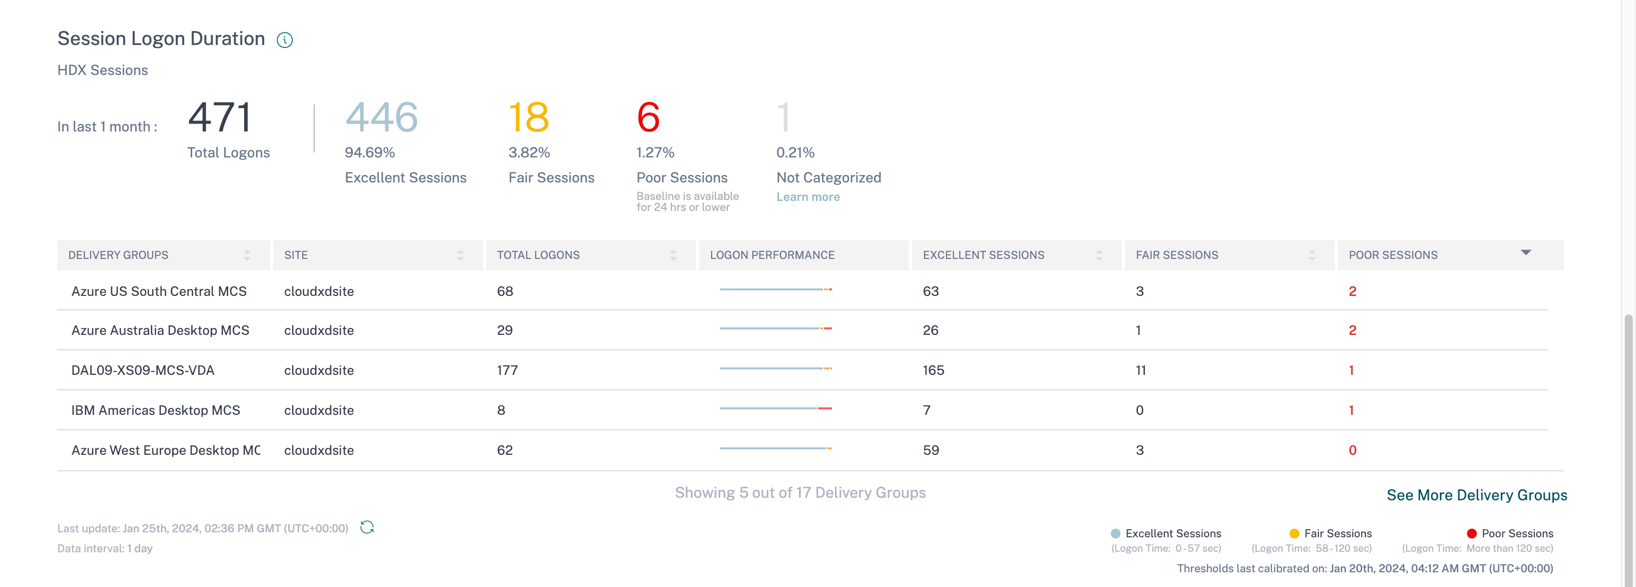
The user experience score is calculated by considering different factors affecting the end user experience such as: session resiliency, session availability, session logon duration, and session responsiveness. Administrators are then able to divide deeper and look at subfactors to be able to determine the exact root cause of the problem. For example, sub-factors for session logon duration include GPOs, Profile Load, Interactive Session, Brokering, VM Start, HDX Connection, Authentication, and Logon Scripts. Dynamic thresholds are used to benchmark the Session Logon Duration and the Session Responsiveness factors and subfactors. These calculations are done on a per customer basis and calculated based on the past 30 days. The thresholds are recalibrated every seven days to reflect changes made in the environment. More information on how the user experience score is calculated can be found here.
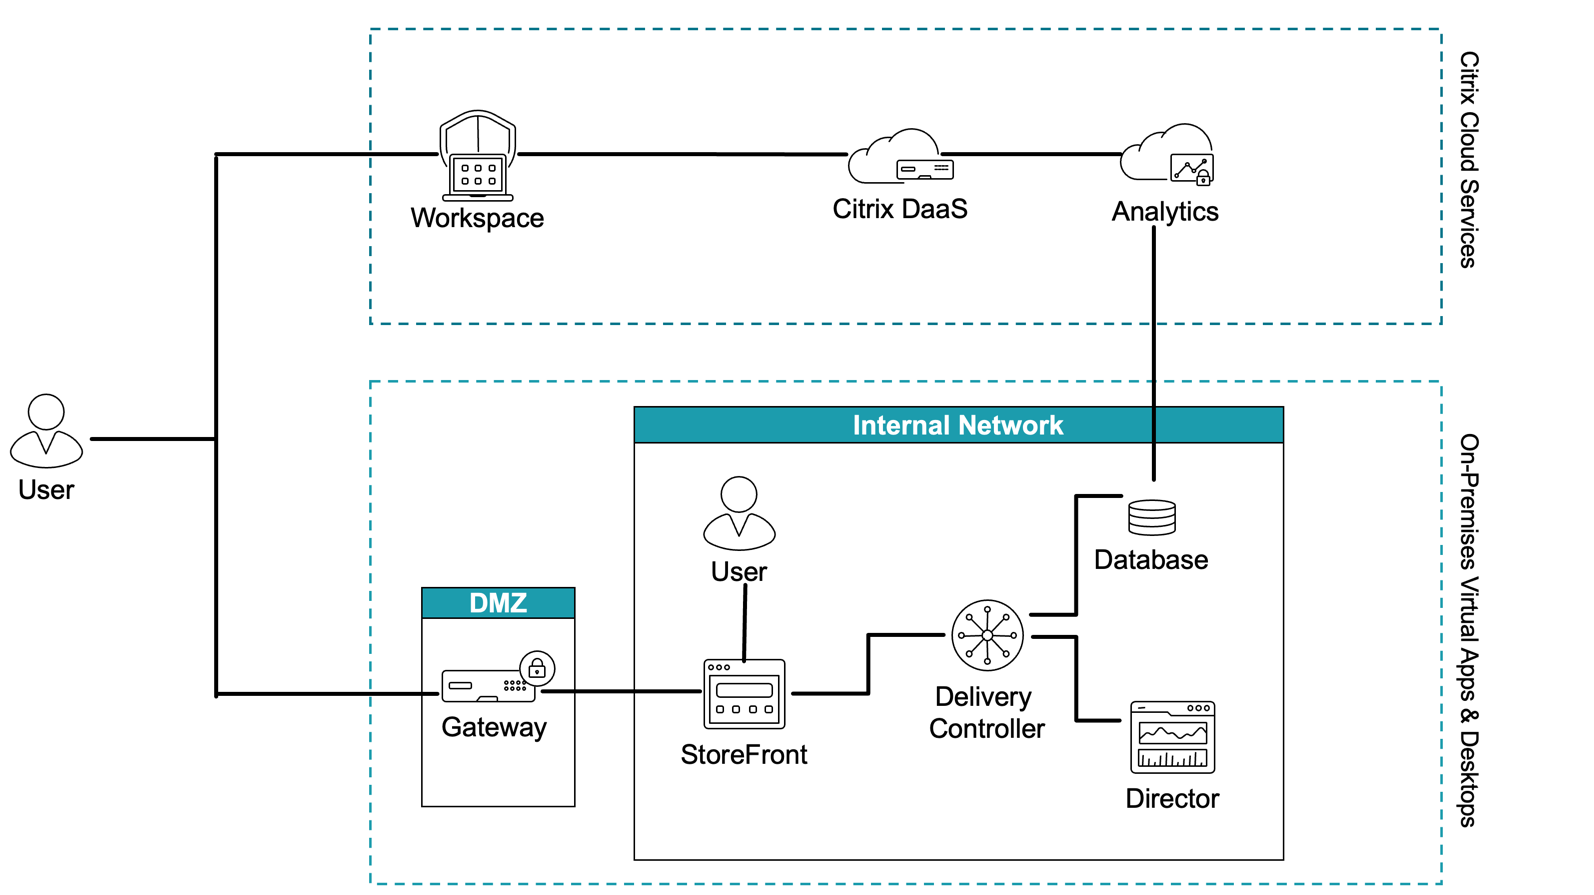
Citrix Analytics for Performance can be used for both on-premises and cloud customers and does not require customers to be on Citrix Workspace. Citrix Analytics gets data directly from the Citrix Director’s monitoring data base. The data is pushed securely from Citrix Director to Citrix Analytics through https port 443. Citrix Analytics for Performance also captures HDX data from Gateway. For an on-premises NetScaler Gateway, a customer is required to use the ADM service. For the Citrix Gateway service, HDX data is sent directly to Citrix Analytics. There is no data going from Citrix Cloud™ to your on-premises environment. Data communication is outbound which means that no ports need to be open or any inbound traffic allowed. For the customers using Citrix DaaS, Citrix Analytics gets data directly from the Director platform, all of which is hosted within the Citrix Cloud.
User Experience Score Dashboard
The User Experience Score dashboard gives a holistic view of which users are experiencing “excellent”, “fair”, or “poor” experience. Citrix Analytics for Performance has multi-site aggregation to give you a holistic view of all your environments (cloud or on-premises). Multi-site aggregation gives the administrator the flexibility to look at their environment holistically or filter out per a specific site.
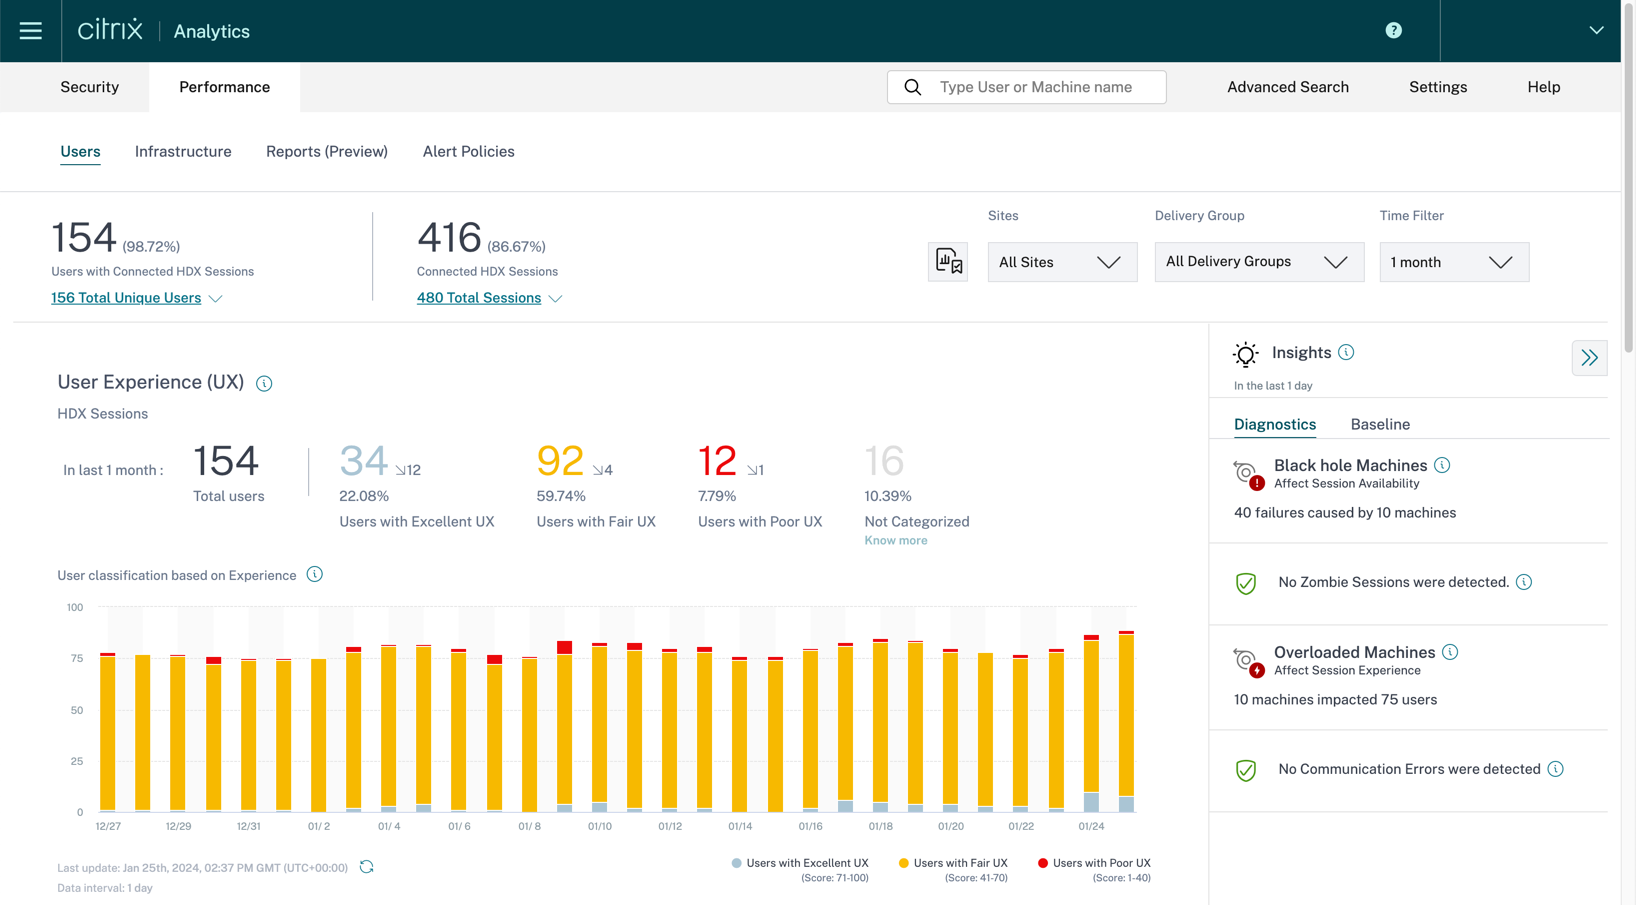
Citrix Analytics administrators can drill down to see which factors are causing the user to get that specific end user experience score. Citrix Analytics for Performance provides administrators insights into possible root causes of what can be causing the user experience issue. More information on the user experience subfactors can be found here.
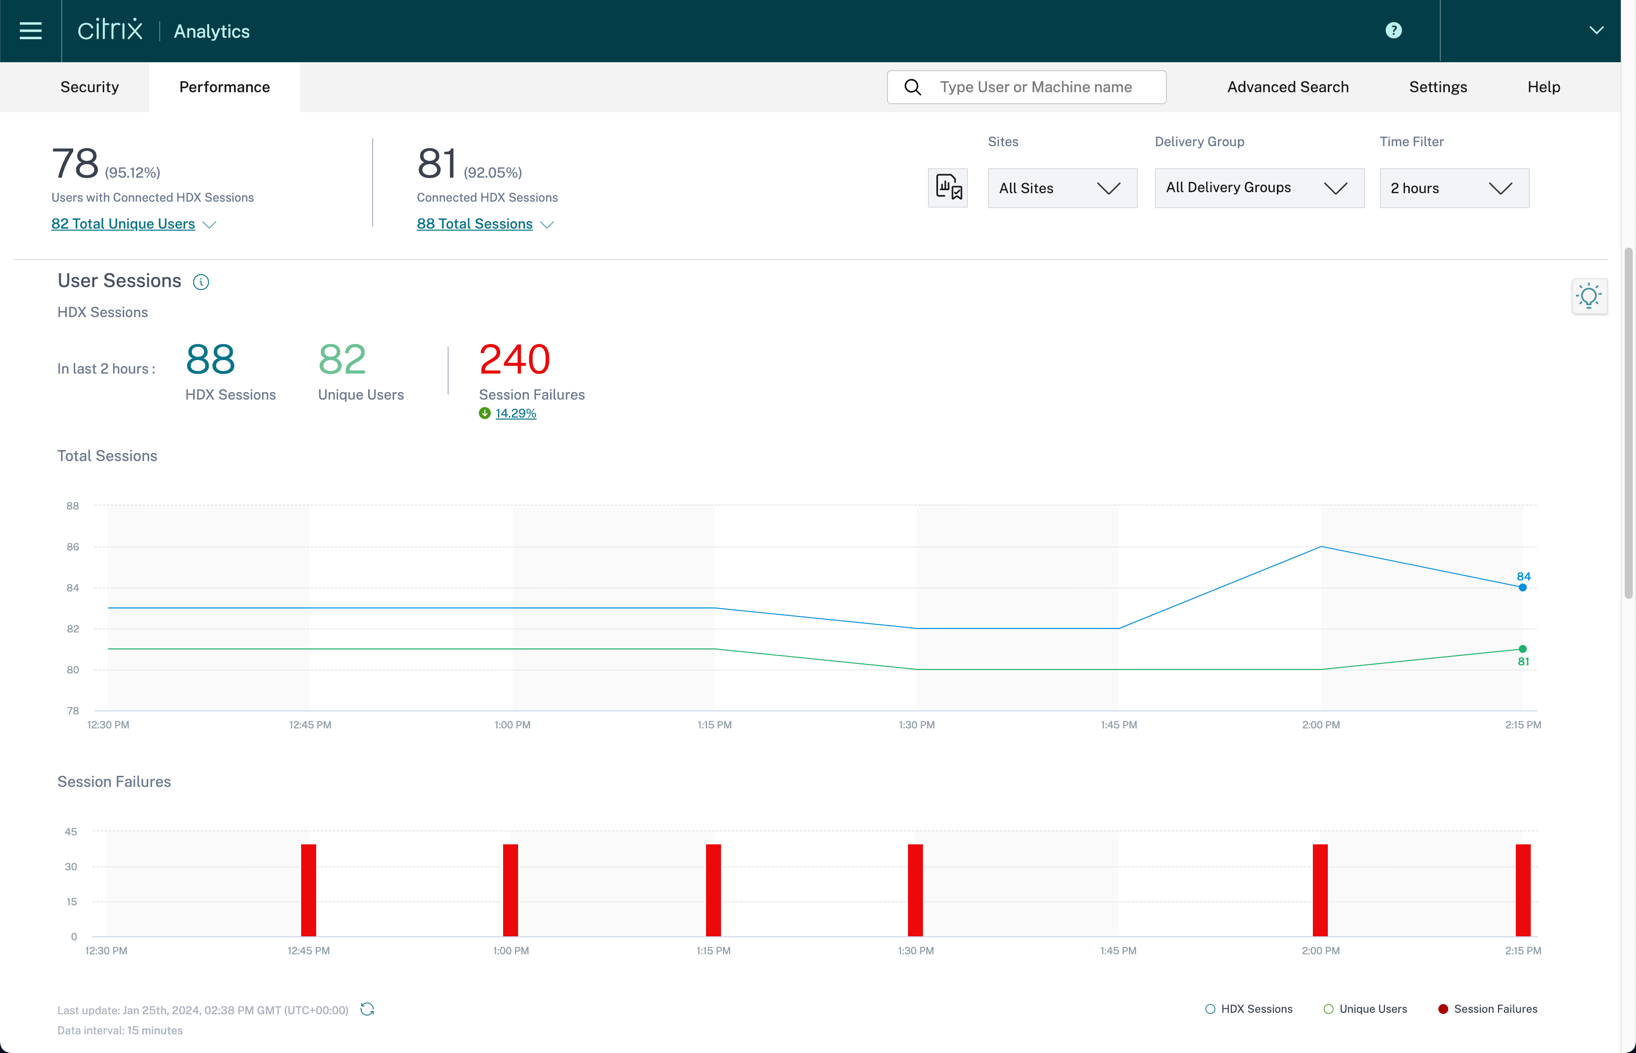
Also, within this User Experience dashboard, the administrators can see the User Session trends which show the total HDX™ sessions vs the total unique users and the number of session failures. The total sessions indicate the total number of user sessions when an app or a desktop is launched from the Workspace App. The total unique users are the number of unique users who have launched a session or have an active session during the specified period.
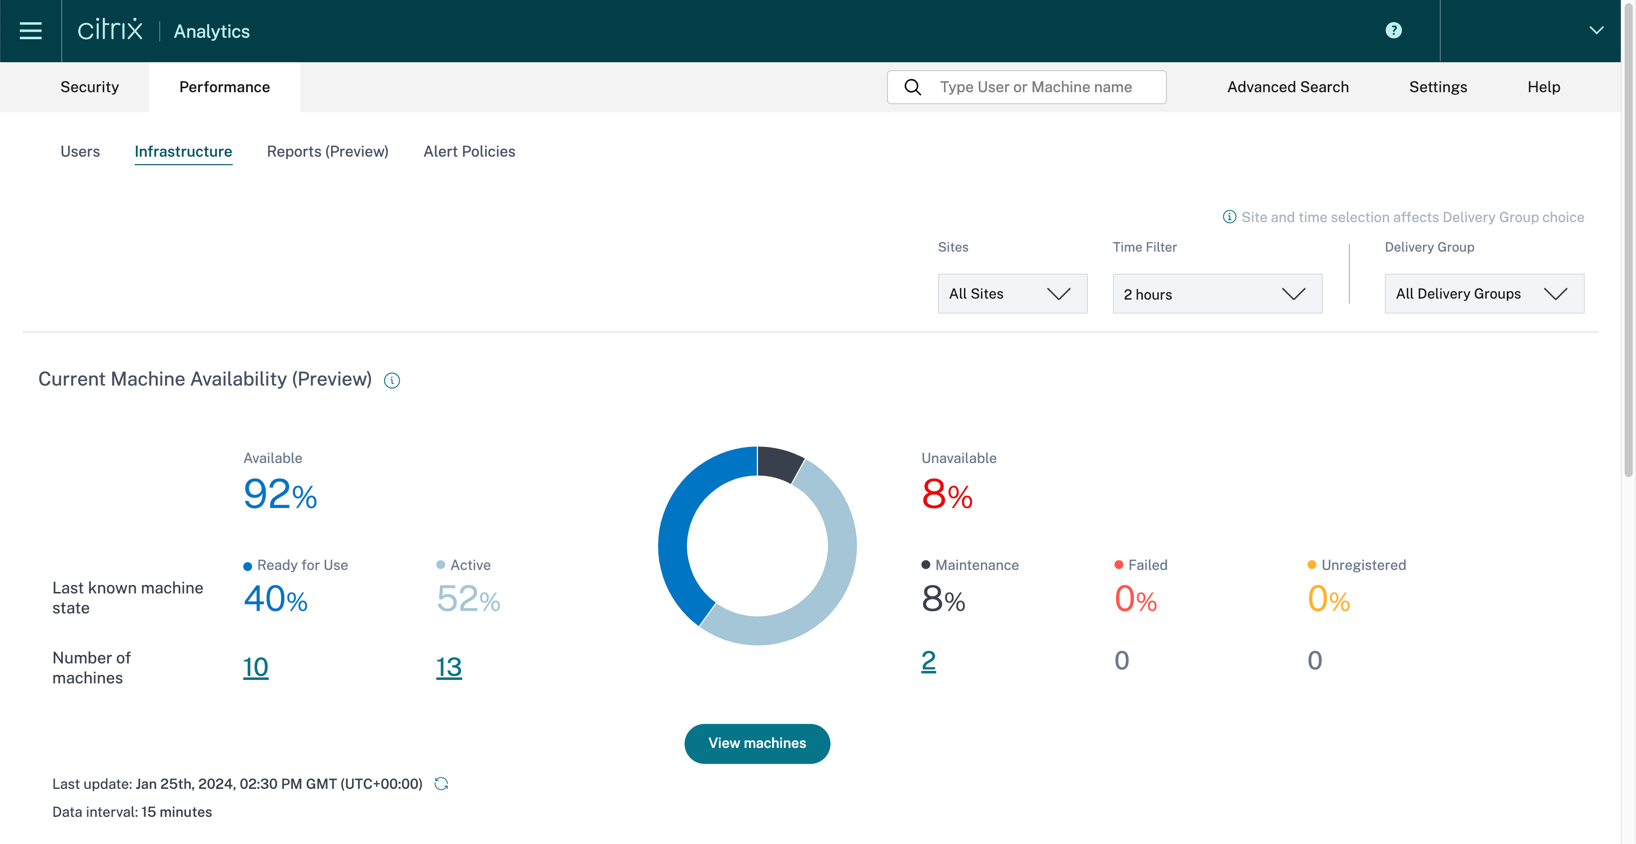
Infrastructure Dashboard
The infrastructure dashboard provides administrators with an overview of their environment’s infrastructure health. The dashboard provides the VDA information across all sites. For multi-session OS VDAs, administrators can see which VDAs are in an unusable state based on the load evaluator index. For single-session OS VDAs, administrators can see the number of VDAs that are in use and available. More information on the metrics available in the Infrastructure dashboard can be found here.
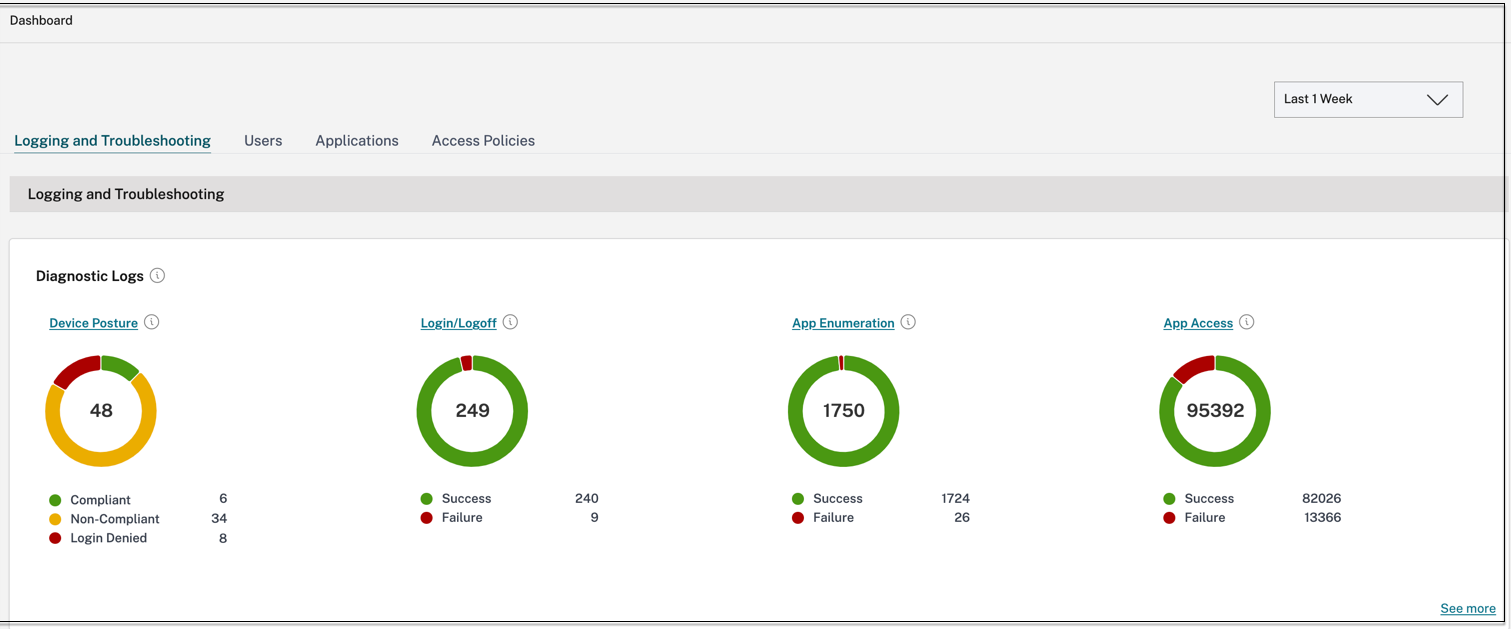
Secure Private Access Service Dashboard
The Secure Private Access service dashboard displays the diagnostics and usage data of the SaaS, Web, TCP, and UDP apps. The dashboard provides admins full visibility into their apps, users, connectors health status, and bandwidth usage in a single place for consumption.
The metrics are broadly classified into the following categories.
- Logging and Troubleshooting
- Diagnostic logs: Logs related to authentication, application launch, app enumeration, and device posture checks.
- Users
- Active users: Total number of unique users accessing the applications (SaaS, Web, and TCP) for the selected time interval.
- Uploads: Total volume data uploaded through the Secure Private Access service for the selected time interval.
- Downloads: Total volume of data downloaded through the Secure Private Access service for the selected time interval.
- Applications:
- Applications: Total number of applications (independent of the time interval) configured currently.
- Application launch count: Total number of applications (app sessions) launched by each user for the selected time interval.
- Domains configured: Total number of domains configured for the selected time interval.
- Applications discovered: Total number of unique, individual domains that have been accessed but are not associated with any apps
- Access policies
- Access policies: Total number of access policies (independent of the time interval) configured currently.
More information on the metrics available in the Secure Private Access service dashboard can be found here.