Citrix Analytics 适用于 SIEM 的数据导出格式
Citrix Analytics for Security™ 允许您与安全信息和事件管理 (SIEM) 服务集成。此集成使 Citrix Analytics for Security 能够将数据发送到您的 SIEM 服务,并帮助您深入了解组织的安全性风险状况。
目前,您可以将 Citrix Analytics for Security 与以下 SIEM 服务集成:
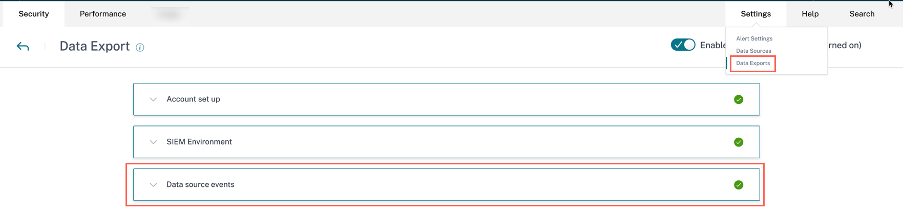
数据导出选项现已在设置下全局可用。要查看数据源事件,请导航到设置 > 数据导出 > 数据源事件。
Citrix Analytics for Security 发送到 SIEM 服务的风险洞察数据分为两种类型:
- 风险洞察事件(默认导出)
-
数据源事件(可选导出)
适用于 SIEM 的风险洞察数据
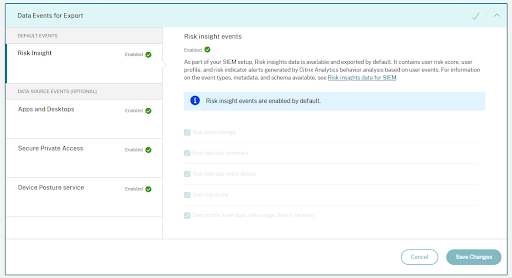
完成帐户配置和 SIEM 设置后,默认数据集(风险洞察事件)将开始流入您的 SIEM 部署。风险洞察数据集包括用户风险评分事件、用户配置文件事件和风险指标警报。这些由 Citrix Analytics 机器学习算法和用户行为分析通过利用用户事件生成。
用户的风险洞察数据集包括以下内容:
- 风险评分变化:指示用户风险评分的变化。当用户的风险评分变化等于或大于 3 且此变化以任何速率增加或下降超过 10% 时,数据将发送到 SIEM 服务。
- 风险指标摘要:为用户触发的风险指标的详细信息。
- 风险指标事件详细信息:与风险指标关联的用户事件。Citrix Analytics 会将每个风险指标事件最多 1000 个事件详细信息发送到您的 SIEM 服务。这些事件按发生的时间顺序发送。
- 用户风险评分事件:用户的当前风险评分。Citrix Analytics for Security 每 12 小时将此数据发送到 SIEM 服务。
-
用户配置文件:用户配置文件数据可分为:
- 用户应用程序:用户已启动和使用的应用程序。Citrix Analytics for Security 从 Citrix Virtual Apps™ 检索此数据,并每 12 小时将其发送到 SIEM 服务。
- 用户设备:与用户关联的设备。Citrix Analytics for Security 从 Citrix Virtual Apps 和 Citrix Endpoint Management™ 检索此数据,并每 12 小时将其发送到 SIEM 服务。
- 用户位置:上次检测到用户的城市。Citrix Analytics for Security 从 Citrix Virtual Apps and Desktops™ 和 Citrix DaaS(以前称为 Citrix Virtual Apps and Desktops 服务)检索此数据。Citrix Analytics for Security 每 12 小时将此信息发送到您的 SIEM 服务。
- 用户客户端 IP:用户设备的客户端 IP 地址。Citrix Analytics for Security 从 Citrix Virtual Apps and Desktops 和 Citrix DaaS™(以前称为 Citrix Virtual Apps and Desktops 服务)检索此数据,并每 12 小时将此信息发送到您的 SIEM 服务。
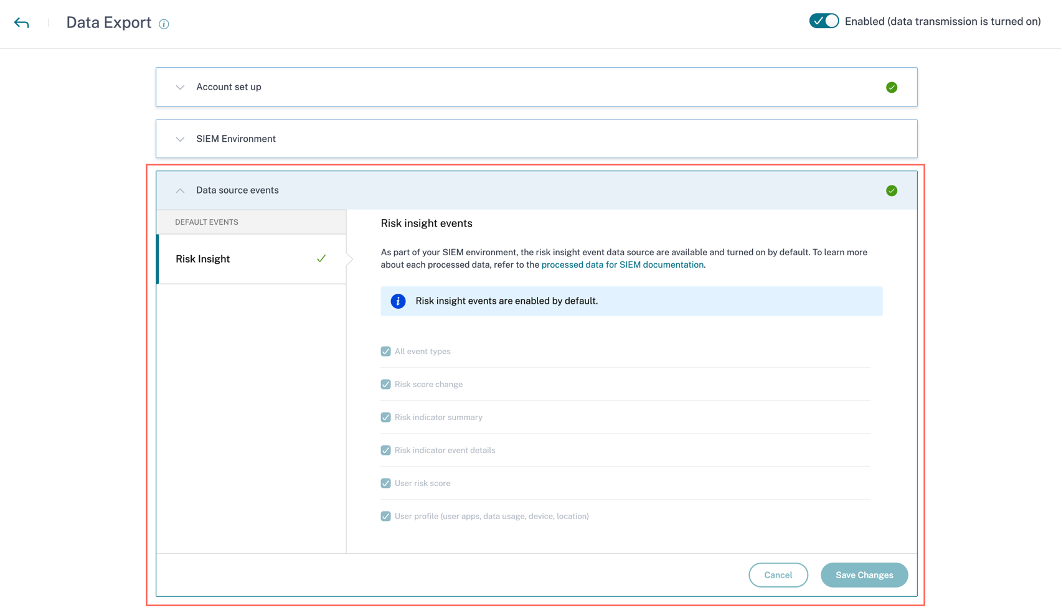
如果您只能查看但无法配置数据源事件首选项,则您没有必要的管理员权限。 要了解更多信息,请参阅管理 Security Analytics 的管理员角色。
在以下示例中,“保存更改”按钮处于禁用状态。风险洞察事件默认启用。
风险洞察事件的架构详细信息
以下部分描述了 Citrix Analytics for Security 生成的已处理数据的架构。
注意
以下架构示例中显示的字段值仅用于表示目的。实际字段值因用户配置文件、用户事件和风险指标而异。
下表描述了所有用户配置文件数据、用户风险评分和风险评分变化架构中通用的字段名称。
| 字段名称 | 描述 |
|---|---|
entity_id |
与实体关联的身份。在此示例中,实体是用户。 |
entity_type |
处于风险中的实体。在此示例中,实体是用户。 |
event_type |
发送到 SIEM 服务的数据类型。例如:用户位置、用户数据使用情况或用户设备访问信息。 |
tenant_id |
客户的唯一身份。 |
timestamp |
最近用户活动的日期和时间。 |
version |
已处理数据的架构版本。当前架构版本为 2。 |
用户配置文件数据架构
用户位置架构
{
  "tenant_id": "demo_tenant", "entity_id": "demo_user", "entity_type": "user", "timestamp": "2021-02-10T15:00:00Z", "event_type": "userProfileLocation", "country": "India", "city": "Bengaluru", "cnt": 4, "version": 2
  }
<!--NeedCopy-->
用户位置的字段描述
| 字段名称 | 描述 |
|---|---|
event_type |
发送到 SIEM 服务的数据类型。在此示例中,事件类型是用户位置。 |
country |
用户登录的国家/地区。 |
city |
用户登录的城市。 |
cnt |
在过去 12 小时内访问该位置的次数。 |
用户客户端 IP 架构
{
  "client_ip": "149.147.136.10",
  "cnt": 3,
  "entity_id": "r2_up_user_1",
  "entity_type": "user",
  "event_type": "userProfileClientIps",
  "tenant_id": "xaxddaily1",
  "timestamp": "2023-09-18T10:45:00Z",
  "version": 2
}
<!--NeedCopy-->
客户端 IP 的字段描述
| 字段名称 | 描述 |
|---|---|
client_ip |
用户设备的 IP 地址。 |
cnt |
在过去 12 小时内用户访问设备的次数。 |
entity_id |
与实体关联的身份。在此示例中,实体是用户。 |
entity_type |
处于风险中的实体。在此示例中,事件类型是用户的客户端 IP。 |
event_type |
发送到 SIEM 服务的数据类型。例如:用户位置、用户数据使用情况或用户设备访问信息。 |
tenant_id |
客户的唯一身份。 |
timestamp |
最近用户活动的日期和时间。 |
version |
已处理数据的架构版本。当前架构版本为 2。 |
用户数据使用情况架构
{
  "data_usage_bytes": 87555255, "deleted_file_cnt": 0, "downloaded_bytes": 87555255, "downloaded_file_cnt": 5, "entity_id": "demo@demo.com", "entity_type": "user", "event_type": "userProfileUsage", "shared_file_cnt": 0, "tenant_id": "demo_tenant", "timestamp": "2021-02-10T21:00:00Z", "uploaded_bytes": 0, "uploaded_file_cnt": 0, "version": 2
  }
<!--NeedCopy-->
用户数据使用情况的字段描述
| 字段名称 | 描述 |
|---|---|
data_usage_bytes |
用户使用的数据量(以字节为单位)。它是用户下载和上传总量的聚合。 |
deleted_file_cnt |
用户删除的文件数。 |
downloaded_bytes |
用户下载的数据量。 |
downloaded_file_count |
用户下载的文件数。 |
event_type |
发送到 SIEM 服务的数据类型。在此示例中,事件类型是用户使用情况配置文件。 |
shared_file_count |
用户共享的文件数。 |
uploaded_bytes |
用户上传的数据量。 |
uploaded_file_cnt |
用户上传的文件数。 |
用户设备架构
{
  "cnt": 2, "device": "user1612978536 (Windows)", "entity_id": "demo", "entity_type": "user", "event_type": "userProfileDevice", "tenant_id": "demo_tenant", "timestamp": "2021-02-10T21:00:00Z", "version": 2
  }
<!--NeedCopy-->
用户设备的字段描述。
| 字段名称 | 描述 |
|---|---|
cnt |
在过去 12 小时内访问设备的次数。 |
device |
设备名称。 |
event_type |
发送到 SIEM 服务的数据类型。在此示例中,事件类型是用户设备访问信息。 |
用户应用程序架构
{
  "tenant_id": "demo_tenant", "entity_id": "demo", "entity_type": "user", "timestamp": "2021-02-10T21:00:00Z", "event_type": "userProfileApp", "version": 2, "session_domain": "99e38d488136f62f828d4823edd120b4f32d724396a7410e6dd1b0", "user_samaccountname": "testnameeikragz779", "app": "Chromeeikragz779", "cnt": 189
  }
<!--NeedCopy-->
用户应用程序的字段描述。
| 字段名称 | 描述 |
|---|---|
event_type |
发送到 SIEM 服务的数据类型。在此示例中,事件类型是用户设备访问信息。 |
session_domain |
用户登录的会话 ID。 |
user_samaccountname |
适用于 Windows NT 4.0、Windows 95、Windows 98 和 LAN Manager 等早期 Windows 版本的客户端和服务器的登录名称。此名称用于登录 Citrix StoreFront 和远程 Windows 计算机。 |
app |
用户访问的应用程序名称。 |
cnt |
在过去 12 小时内访问应用程序的次数。 |
用户风险评分架构
{
  "cur_riskscore": 7, "entity_
<!--NeedCopy-->