-
Getting Started with NetScaler
-
NetScaler cloud native solution
-
Use NetScaler ADM to Troubleshoot NetScaler cloud native Networking
-
Deploy a NetScaler VPX instance
-
Optimize NetScaler VPX performance on VMware ESX, Linux KVM, and Citrix Hypervisors
-
Apply NetScaler VPX configurations at the first boot of the NetScaler appliance in cloud
-
Configure simultaneous multithreading for NetScaler VPX on public clouds
-
Install a NetScaler VPX instance on Microsoft Hyper-V servers
-
Install a NetScaler VPX instance on Linux-KVM platform
-
Prerequisites for installing NetScaler VPX virtual appliances on Linux-KVM platform
-
Provisioning the NetScaler virtual appliance by using OpenStack
-
Provisioning the NetScaler virtual appliance by using the Virtual Machine Manager
-
Configuring NetScaler virtual appliances to use SR-IOV network interface
-
Configure a NetScaler VPX on KVM hypervisor to use Intel QAT for SSL acceleration in SR-IOV mode
-
Configuring NetScaler virtual appliances to use PCI Passthrough network interface
-
Provisioning the NetScaler virtual appliance by using the virsh Program
-
Provisioning the NetScaler virtual appliance with SR-IOV on OpenStack
-
Configuring a NetScaler VPX instance on KVM to use OVS DPDK-Based host interfaces
-
-
Deploy a NetScaler VPX instance on AWS
-
Deploy a VPX high-availability pair with elastic IP addresses across different AWS zones
-
Deploy a VPX high-availability pair with private IP addresses across different AWS zones
-
Protect AWS API Gateway using the NetScaler Web Application Firewall
-
Configure a NetScaler VPX instance to use SR-IOV network interface
-
Configure a NetScaler VPX instance to use Enhanced Networking with AWS ENA
-
Deploy a NetScaler VPX instance on Microsoft Azure
-
Network architecture for NetScaler VPX instances on Microsoft Azure
-
Configure multiple IP addresses for a NetScaler VPX standalone instance
-
Configure a high-availability setup with multiple IP addresses and NICs
-
Configure a high-availability setup with multiple IP addresses and NICs by using PowerShell commands
-
Deploy a NetScaler high-availability pair on Azure with ALB in the floating IP-disabled mode
-
Configure a NetScaler VPX instance to use Azure accelerated networking
-
Configure HA-INC nodes by using the NetScaler high availability template with Azure ILB
-
Configure a high-availability setup with Azure external and internal load balancers simultaneously
-
Configure a NetScaler VPX standalone instance on Azure VMware solution
-
Configure a NetScaler VPX high availability setup on Azure VMware solution
-
Configure address pools (IIP) for a NetScaler Gateway appliance
-
Deploy a NetScaler VPX instance on Google Cloud Platform
-
Deploy a VPX high-availability pair on Google Cloud Platform
-
Deploy a VPX high-availability pair with external static IP address on Google Cloud Platform
-
Deploy a single NIC VPX high-availability pair with private IP address on Google Cloud Platform
-
Deploy a VPX high-availability pair with private IP addresses on Google Cloud Platform
-
Install a NetScaler VPX instance on Google Cloud VMware Engine
-
-
Solutions for Telecom Service Providers
-
Load Balance Control-Plane Traffic that is based on Diameter, SIP, and SMPP Protocols
-
Provide Subscriber Load Distribution Using GSLB Across Core-Networks of a Telecom Service Provider
-
Authentication, authorization, and auditing application traffic
-
Basic components of authentication, authorization, and auditing configuration
-
Web Application Firewall protection for VPN virtual servers and authentication virtual servers
-
On-premises NetScaler Gateway as an identity provider to Citrix Cloud
-
Authentication, authorization, and auditing configuration for commonly used protocols
-
Troubleshoot authentication and authorization related issues
-
-
-
-
-
-
Configure DNS resource records
-
Configure NetScaler as a non-validating security aware stub-resolver
-
Jumbo frames support for DNS to handle responses of large sizes
-
Caching of EDNS0 client subnet data when the NetScaler appliance is in proxy mode
-
Use case - configure the automatic DNSSEC key management feature
-
Use Case - configure the automatic DNSSEC key management on GSLB deployment
-
-
-
Persistence and persistent connections
-
Advanced load balancing settings
-
Gradually stepping up the load on a new service with virtual server–level slow start
-
Protect applications on protected servers against traffic surges
-
Retrieve location details from user IP address using geolocation database
-
Use source IP address of the client when connecting to the server
-
Use client source IP address for backend communication in a v4-v6 load balancing configuration
-
Set a limit on number of requests per connection to the server
-
Configure automatic state transition based on percentage health of bound services
-
-
Use case 2: Configure rule based persistence based on a name-value pair in a TCP byte stream
-
Use case 3: Configure load balancing in direct server return mode
-
Use case 6: Configure load balancing in DSR mode for IPv6 networks by using the TOS field
-
Use case 7: Configure load balancing in DSR mode by using IP Over IP
-
Use case 10: Load balancing of intrusion detection system servers
-
Use case 11: Isolating network traffic using listen policies
-
Use case 12: Configure Citrix Virtual Desktops for load balancing
-
Use case 13: Configure Citrix Virtual Apps and Desktops for load balancing
-
Use case 14: ShareFile wizard for load balancing Citrix ShareFile
-
Use case 15: Configure layer 4 load balancing on the NetScaler appliance
-
-
-
-
Authentication and authorization for System Users
-
-
Configuring a CloudBridge Connector Tunnel between two Datacenters
-
Configuring CloudBridge Connector between Datacenter and AWS Cloud
-
Configuring a CloudBridge Connector Tunnel Between a Datacenter and Azure Cloud
-
Configuring CloudBridge Connector Tunnel between Datacenter and SoftLayer Enterprise Cloud
-
Configuring a CloudBridge Connector Tunnel Between a NetScaler Appliance and Cisco IOS Device
-
CloudBridge Connector Tunnel Diagnostics and Troubleshooting
This content has been machine translated dynamically.
Dieser Inhalt ist eine maschinelle Übersetzung, die dynamisch erstellt wurde. (Haftungsausschluss)
Cet article a été traduit automatiquement de manière dynamique. (Clause de non responsabilité)
Este artículo lo ha traducido una máquina de forma dinámica. (Aviso legal)
此内容已经过机器动态翻译。 放弃
このコンテンツは動的に機械翻訳されています。免責事項
이 콘텐츠는 동적으로 기계 번역되었습니다. 책임 부인
Este texto foi traduzido automaticamente. (Aviso legal)
Questo contenuto è stato tradotto dinamicamente con traduzione automatica.(Esclusione di responsabilità))
This article has been machine translated.
Dieser Artikel wurde maschinell übersetzt. (Haftungsausschluss)
Ce article a été traduit automatiquement. (Clause de non responsabilité)
Este artículo ha sido traducido automáticamente. (Aviso legal)
この記事は機械翻訳されています.免責事項
이 기사는 기계 번역되었습니다.책임 부인
Este artigo foi traduzido automaticamente.(Aviso legal)
这篇文章已经过机器翻译.放弃
Questo articolo è stato tradotto automaticamente.(Esclusione di responsabilità))
Translation failed!
Use NetScaler Console to troubleshoot NetScaler cloud native networking
Overview
This document provides information about how you can use NetScaler Console to deliver and monitor Kubernetes microservice applications. You also dive into using the CLI, service graphs, and tracing to allow the platform and SRE teams to troubleshoot.
Application performance and latency overview
TLS encryption
TLS is an encryption protocol designed to secure Internet communications. A TLS handshake is the process that begins a communication session that uses TLS encryption. During a TLS handshake, the two communicating sides exchange messages to acknowledge each other, verify each other, establish the encryption algorithms they use, and agree on session keys. TLS handshakes are a foundational part of how HTTPS works.
TLS vs SSL handshakes
SSL (Secure Sockets Layer), was the original encryption protocol developed for HTTP. TLS (Transport Layer Security) replaced SSL some time ago. SSL handshakes are now called TLS handshakes, although the “SSL” name is still in wide use.
When does a TLS handshake occur?
A TLS handshake takes place whenever a user navigates to a website over HTTPS and the browser first begins to query the website’s origin server. A TLS handshake also happens whenever any other communications use HTTPS, including API calls and DNS over HTTPS queries.
TLS handshakes occur after a TCP connection has been opened via a TCP handshake.
What happens during a TLS handshake?
- During a TLS handshake, the client and server together do the following:
- Specify which version of TLS (TLS 1.0, 1.2, 1.3, and so forth) they use.
- Decide on which cipher suites (see the following section) they use.
- Authenticate the identity of the server via the server’s public key and the SSL certificate authority’s digital signature.
- Generate session keys to use symmetric encryption after the handshake is complete.
What are the steps of a TLS handshake?
- TLS handshakes are a series of datagrams, or messages, exchanged by a client and a server. A TLS handshake involves multiple steps, as the client and server exchange the information necessary for completing the handshake and making further conversation possible.
The exact steps within a TLS handshake vary depending upon the kind of key exchange algorithm used and the cipher suites supported by both sides. The RSA key exchange algorithm is used most often. It goes as follows:
- The ‘client hello’ message: The client initiates the handshake by sending a “hello” message to the server. The message includes which TLS version the client supports, the cipher suites supported, and a string of random bytes known as the “client random.”
- The ‘server hello’ message: In reply to the client hello message, the server sends a message containing the server’s SSL certificate, the server’s chosen cipher suite, and the “server random,” another random string of bytes that’s generated by the server.
- Authentication: The client verifies the server’s SSL certificate with the certificate authority that issued it. This confirms that the server is who it says it is, and that the client is interacting with the actual owner of the domain.
- The premaster secret: The client sends one more random string of bytes, the “premaster secret.” The premaster secret is encrypted with the public key and can only be decrypted with the private key by the server. (The client gets the public key from the server’s SSL certificate.)
- Private key used: The server decrypts the premaster secret.
- Session keys created: Both client and server generate session keys from the client random, the server random, and the premaster secret. They should arrive at the same results.
- Client is ready: The client sends a “finished” message that is encrypted with a session key.
- Server is ready: The server sends a “finished” message encrypted with a session key.
- Secure symmetric encryption achieved: The handshake is completed, and communication continues using the session keys.
All TLS handshakes use asymmetric encryption (the public and private key), but not all use the private key in the process of generating session keys. For instance, an ephemeral Diffie-Hellman handshake proceeds as follows:
- Client hello: The client sends a client hello message with the protocol version, the client random, and a list of cipher suites.
- Server hello: The server replies with its SSL certificate, its selected cipher suite, and the server random. In contrast to the RSA handshake described in the previous section, in this message the server also includes the following (step 3).
- Server’s digital signature: The server uses its private key to encrypt the client random, the server random, and its DH parameter*. This encrypted data functions as the server’s digital signature, establishing that the server has the private key that matches with the public key from the SSL certificate.
- Digital signature confirmed: The client decrypts the server’s digital signature with the public key, verifying that the server controls the private key and is who it says it is. Client DH parameter: The client sends its DH parameter to the server.
- Client and server calculate the premaster secret: Instead of the client generating the premaster secret and sending it to the server, as in an RSA handshake, the client and the server use the DH parameters they exchanged to calculate a matching premaster secret separately.
- Session keys created: Now, the client and server calculate session keys from the premaster secret, client random, and server random, just like in an RSA handshake.
- Client is ready: Same as an RSA handshake
- Server is ready
- Secure symmetric encryption achieved
*DH parameter: DH stands for Diffie-Hellman. The Diffie-Hellman algorithm uses exponential calculations to arrive at the same premaster secret. The server and client each provide a parameter for the calculation, and when combined they result in a different calculation on each side, with results that are equal.
To read more about the contrast between ephemeral Diffie-Hellman handshakes and other kinds of handshakes, and how they achieve forward secrecy, see this TLS Protocol Documentation.
What is a cipher suite?
- A cipher suite is a set of encryption algorithms for use in establishing a secure communications connection. (An encryption algorithm is a set of mathematical operations performed on data for making the data appear random.) There are various cipher suites in wide use, and an essential part of the TLS handshake is agreeing upon which cipher suite is used for that handshake.
To get started, see Reference: TLS Protocol Documentation.
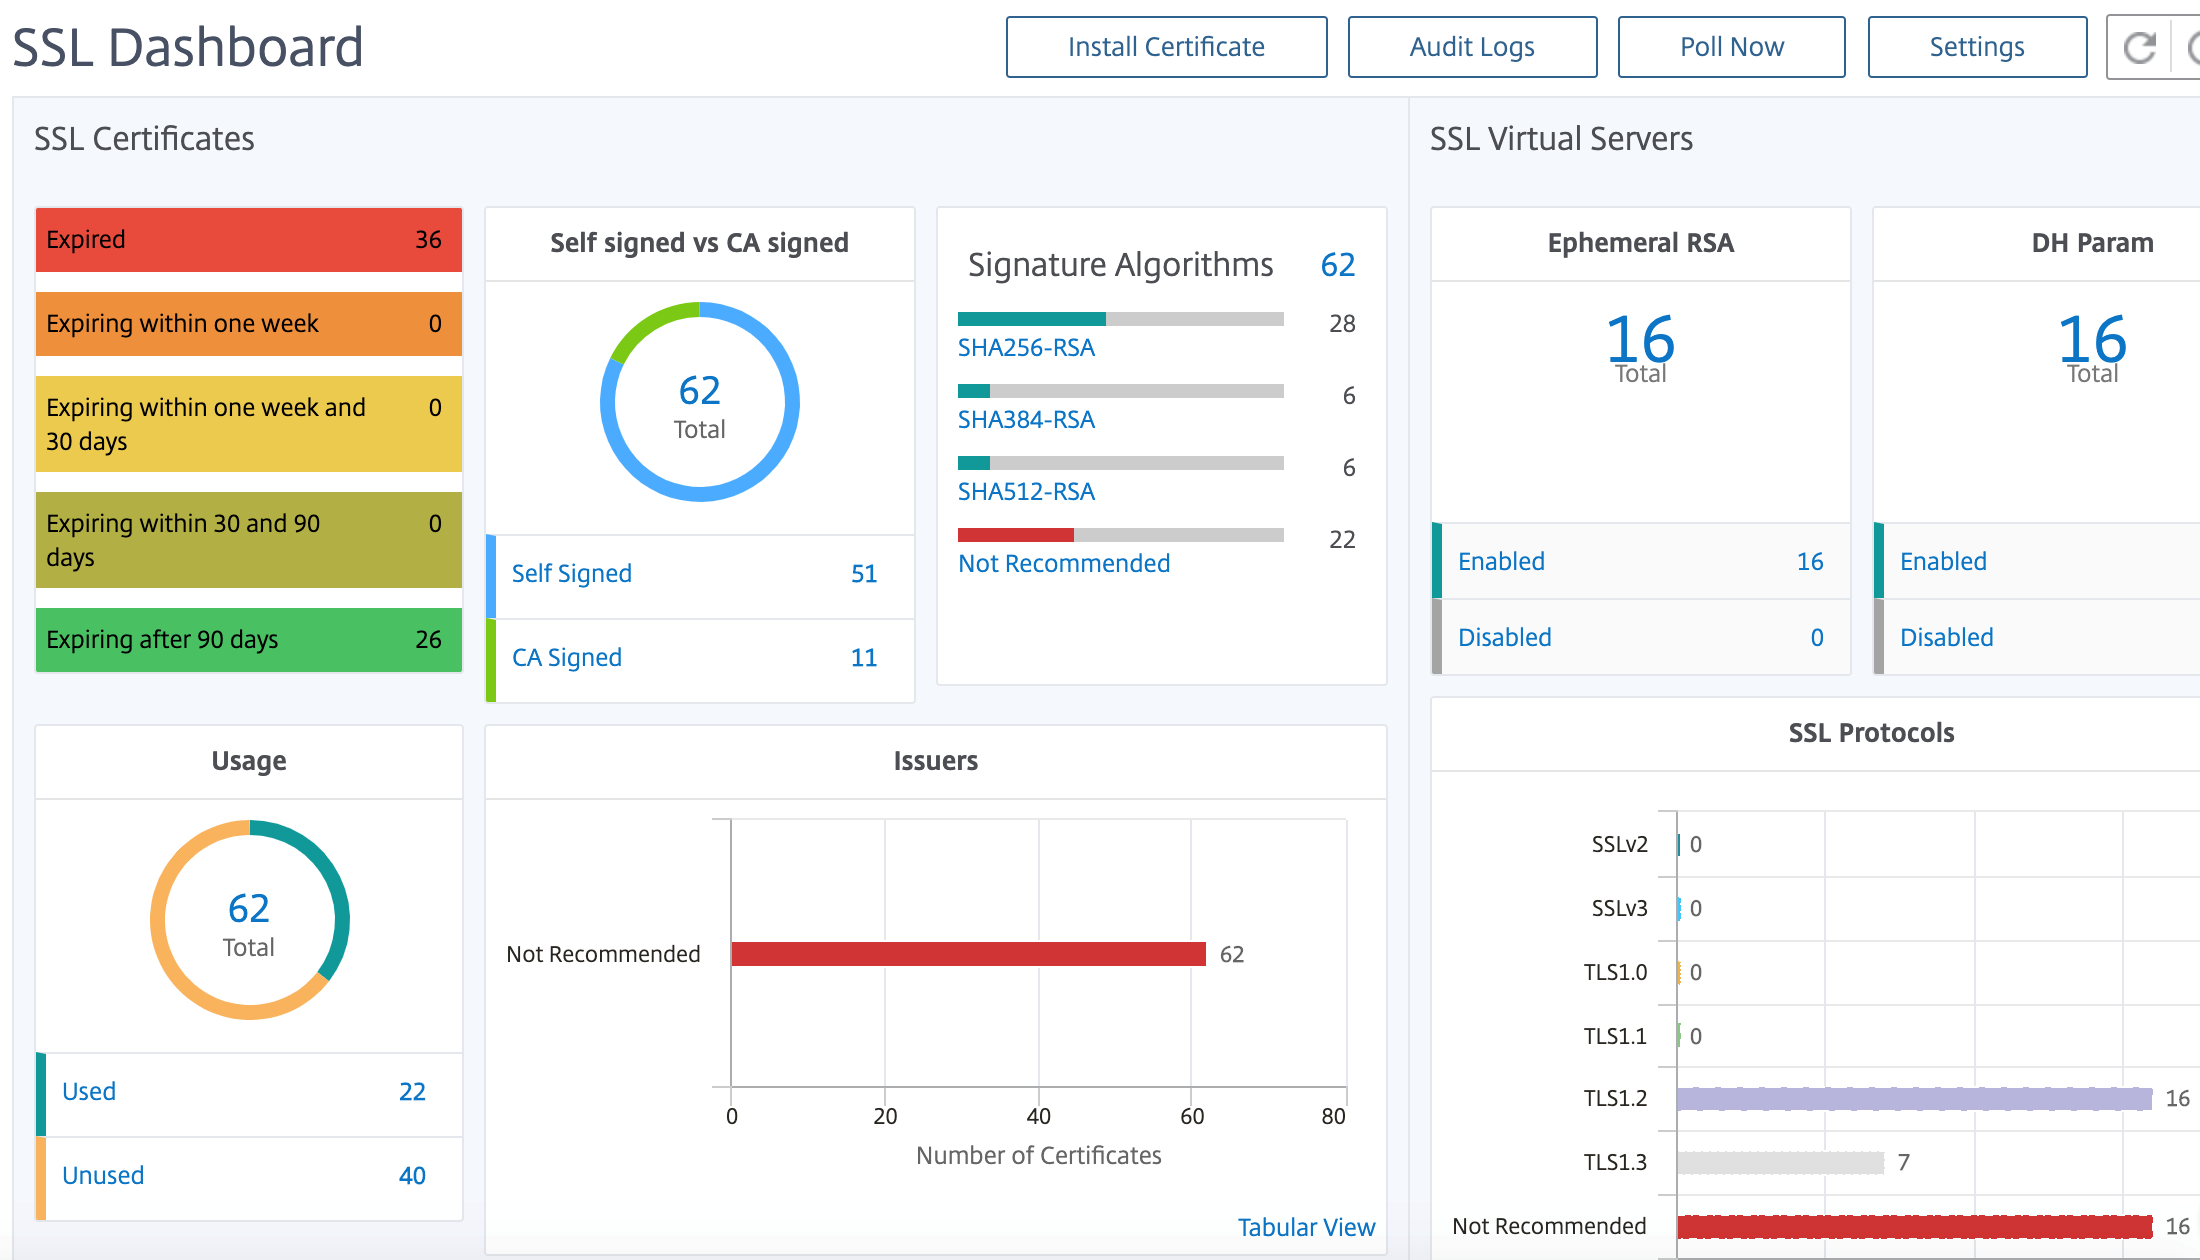
NetScaler Application Delivery Management SSL dashboard
NetScaler Application Delivery Management (ADM) now streamlines every aspect of certificate management for you. Through a single console, you can establish automated policies to ensure the right issuer, key strength, and correct algorithms, while keeping close tabs on certificates that are unused or soon to expire. To begin using NetScaler Console SSL dashboard and its functionalities, you must understand what an SSL certificate is and how you can use NetScaler Console to track your SSL certificates.
A Secure Socket Layer (SSL) certificate, which is a part of any SSL transaction, is a digital data form (X509) that identifies a company (domain) or an individual. The certificate has a public key component that is visible to any client that wants to initiate a secure transaction with the server. The corresponding private key, which resides securely on the Citrix Application Delivery Controller (ADC) appliance, is used to complete asymmetric key (or public key) encryption and decryption.
You can obtain an SSL certificate and key in either of the following ways:
- From an authorized certificate authority (CA)
- By generating a new SSL certificate and key on the NetScaler appliance
NetScaler Console provides a centralized view of SSL certificates installed across all managed NetScaler instances. On the SSL Dashboard, you can view graphs that help you track certificate issuers, key strengths, signature algorithms, expired or unused certificates and so on. You can also see the distribution of SSL protocols that are running on your virtual servers and the keys that are enabled on them.
You can also set up notifications to inform you when certificates are about to expire and include information about which NetScaler instances use those certificates.
You can link a NetScaler instance’s certificates to a CA certificate. However, make sure that the certificates that you link to the same CA certificate have the same source and the same issuer. After you have linked the certificates to a CA certificate, you can unlink them.
To get started, see the SSL Dashboard Documentation.
Third party integrations
Application latency is measured in milliseconds, and it can indicate one of two things depending on the metric used. The more common way of measuring latency is called “round-trip time” (or RTT). RTT calculates the time it takes for a data packet to travel from one point to another on the network, and for a response to be sent back to the source. The other measurement is called “time to first byte” (or TTFB), which records the time it takes from the moment a packet departs a point on the network to the moment it arrives at its destination. RTT is more commonly used to measure latency because it can be run from a single point on the network and does not require data collection software to be installed on the destination point (as TTFB does).
By monitoring your Application bandwidth usage and performance in real time, the ADM service makes it easy to identify issues and to preemptively address potential problems before they manifest and affect users on your network. This flow-based solution tracks usage by interface, application, and conversation, giving you detailed information about activity across your network.
Using Splunk tools
Infrastructure and application performance are interdependent. To see the full picture, SignalFx provides seamless correlation between cloud infrastructure and the microservices running on top of it. If your application acts out because of memory leakage, a noisy neighbor container or any other infrastructure-related issue, SignalFx lets you know. To complete the picture, in-context access to Splunk logs and events enable deeper troubleshooting and root cause analysis.
For more information on SignalFx Microservices APM and troubleshooting with Splunk, view Splunk for DevOps information.
MongoDB support
MongoDB stores data in flexible, JSON-like documents. Meaning fields can vary from document to document and data structure can be changed over time.
The document model maps to the objects in your application code, making data easy to work with.
On-demand queries, indexing, and real time aggregation provide powerful ways to access and analyze your data.
MongoDB is a distributed database at its core, so high availability, horizontal scaling, and geographic distribution are built in and easy to use.
MongoDB is designed to meet the demands of modern apps with a technology foundation that enables you through:
- The document data model – presenting you the best way to work with data.
- A distributed systems design – allowing you to intelligently put data where you want it.
- A unified experience that gives you the freedom to run anywhere – allowing you to future-proof your work and eliminate vendor lock-in.
With these capabilities, you can build an Intelligent Operational Data Platform, underpinned by MongoDB. For more information, see MongoDB Documentation.
How to load balance Ingress traffic to TCP or UDP based application
In a Kubernetes environment, an Ingress is an object that allows access to the Kubernetes services from outside the Kubernetes cluster. Standard Kubernetes Ingress resources assume that all the traffic is HTTP-based and does not cater to non-HTTP based protocols such as, TCP, TCP-SSL, and UDP. Hence, critical applications based on L7 protocols such as DNS, FTP, LDAP, cannot be exposed using standard Kubernetes Ingress.
The standard Kubernetes solution is to create a service of type LoadBalancer. See Service Type LoadBalancer in NetScaler for more information.
The second option is to annotate the ingress object. NetScaler Ingress Controller enables you to load balance TCP or UDP based Ingress traffic. It provides the following annotations that you can use in your Kubernetes Ingress resource definition to load balance the TCP or UDP based Ingress traffic:
- ingress.citrix.com/insecure-service-type: The annotation enables L4 load balancing with TCP, UDP, or ANY as protocol for NetScaler.
- ingress.citrix.com/insecure-port: The annotation configures the TCP port. The annotation is helpful when micro service access is required on a non-standard port. By default, port 80 is configured.
For more information, see How to load balance Ingress traffic to TCP or UDP based application.
Monitor and improve the performance of your TCP or UDP based applications
Application developers can closely monitor the health of TCP or UDP based applications through rich monitors (such as TCP-ECV, UDP-ECV) in NetScaler. The ECV (extended content validation) monitors help in checking whether the application is returning expected content or not.
Also, the application performance can be improved by using persistence methods such as source IP. You can use these NetScaler features through Smart Annotations in Kubernetes. The following is one such example:
apiVersion: extensions/v1beta1
kind: Ingress
metadata:
    name: mongodb
    annotations:
        ingress.citrix.com/insecure-port: “80”
        ingress.citrix.com/frontend-ip: “192.168.1.1”
        ingress.citrix.com/csvserver: ‘{“l2conn”:”on”}’
        ingress.citrix.com/lbvserver: ‘{“mongodb-svc”:{“lbmethod”:”SRCIPDESTIPHASH”}}’
        ingress.citrix.com/monitor: ‘{“mongodbsvc”:{“type”:”tcp-ecv”}}’
Spec:
    rules:
    - host: mongodb.beverages.com
      http:
        paths:
        - path: /
          backend:
            serviceName: mongodb-svc
            servicePort: 80
<!--NeedCopy-->
NetScaler Application Delivery Management (ADM) Service
NetScaler Console Service provides the following benefits:
- Agile – Easy to operate, update, and consume. The service model of NetScaler Console Service is available over the cloud, making it is easy to operate, update, and use the features provided. The frequency of updates, combined with the automated update feature, quickly enhances your NetScaler deployment.
- Faster time to value – Quicker business goals achievement. Unlike the traditional on-premises deployment, you can use your NetScaler Console Service with a few clicks. You not only save on installation and configuration time, but also avoid wasting time and resources on potential errors.
- Multi-Site Management – Single Pane of Glass for instances across Multi-Site data centers. With the NetScaler Console Service, you can manage and monitor NetScalers that are in various types of deployments. You have one-stop management for NetScalers deployed on-premises and in the cloud.
- Operational Efficiency – Optimized and automated way to achieve higher operational productivity. With the NetScaler Console Service, your operational costs are reduced by saving your time, money, and resources on maintaining and upgrading the traditional hardware deployments.
Service graph for Kubernetes applications
Using the service graph for the cloud-native application feature in NetScaler Console, you can:
- Ensure end-to-end application overall performance
- Identify bottlenecks created by the interdependency of different components of your applications
- Gather insights into the dependencies of different components of your applications
- Monitor services within the Kubernetes cluster
- Monitor which service has issues
- Check the factors contributing to performance issues
- View detailed visibility of service HTTP transactions
- Analyze the HTTP, TCP, and SSL metrics
By visualizing these metrics in NetScaler Console, you can analyze the root cause of issues and take necessary troubleshooting actions faster. Service graph displays your applications in various component services. These services running inside the Kubernetes cluster can communicate with various components within and outside the application.
To get started, see Setting up service graph.
Service graph for 3-tier web applications
Using the service graph feature from the application dashboard, you can view:
- Details on how the application is configured (with content switching virtual server and load balancing virtual server)
- For GSLB applications, you can view data center, ADC instance, CS, and LB virtual servers
- End-to-end transactions from client to service
- The location from where the client is accessing the application
- The data center name where the client requests are processed and the associated data center NetScaler metrics (only for GSLB applications)
- Metrics details for client, service, and virtual servers
- If the errors are from the client or from the service
- The service status such as Critical, Review, and Good. NetScaler Console displays the service status based on service response time and error count.
- Critical (red) - Indicates when average service response time > 200 ms AND error count > 0
- Review (orange) - Indicates when average service response time > 200 ms OR error count > 0
- Good (green) - Indicates no error and average service response time < 200 ms
- The client status such as Critical, Review, and Good. NetScaler Console displays the client status based on client network latency and error count.
- Critical (red)- Indicates when average client network latency > 200 ms AND error count > 0
- Review (orange) - Indicates when average client network latency > 200 ms OR error count > 0
- Good (green) - Indicates no error and average client network latency < 200 ms
- The virtual server status such as Critical, Review, and Good. NetScaler Console displays the virtual server status based on the app score.
- Critical (red) - Indicates when app score < 40
- Review (orange) - Indicates when app score is between 40 and 75
- Good (green) - Indicates when app score is > 75
Points to note:
- Only Load Balancing, Content Switching, and GSLB virtual servers are displayed in the service graph.
- If no virtual server is bound to a custom application, the details are not visible in the service graph for the application.
- You can view metrics for clients and services in the service graph only if active transactions occur between virtual servers and web application.
- If no active transactions are available between virtual servers and web application, you can only view details in the service graph based on the configuration data such as load balancing, content switching, GSLB virtual servers, and services.
- Updates in the application configuration might take 10 minutes to reflect in the service graph.
For more information, see Service graph for applications.
To get started, see Service Graph Documentation.
Troubleshooting for NetScaler teams
Let’s discuss some of the most common attributes for troubleshooting the NetScaler platform and how these troubleshooting techniques apply to the Tier-1 deployments for microservices topologies.
The NetScaler has a command line interface (CLI) that shows commands in real-time and is useful for determining runtime configurations, statics, and policy configuration. This is facilitated via the “SHOW” command.
SHOW - perform ADC CLI operations:
>Show running config (-summary -fullValues)

 Ability to search (grep command)
>“sh running config | -i grep vserver”

Check the version.
>Show license
  “sh license"
<!--NeedCopy-->
Show SSL Statistics
>Sh ssl
        System
        Frontend
        Backend
        Encryption
<!--NeedCopy-->
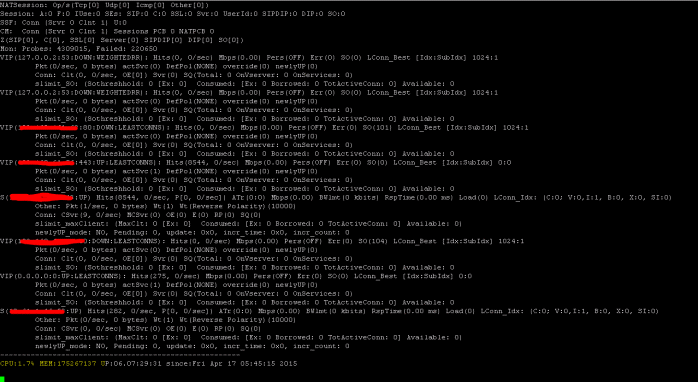
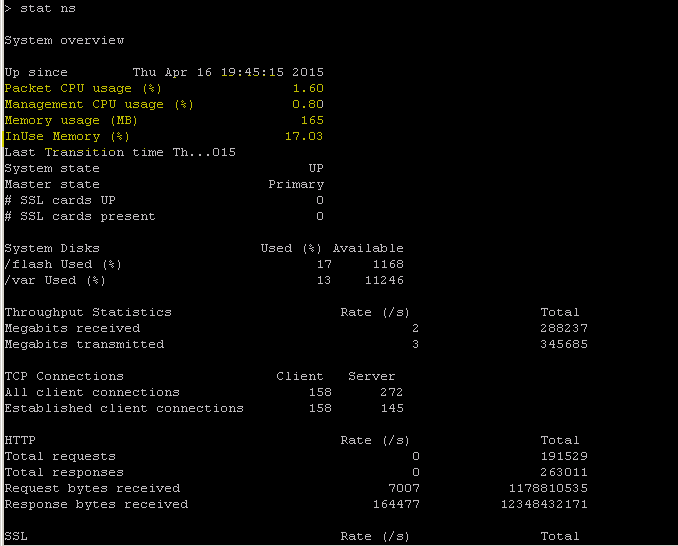
The NetScaler has a command for enumerating statistics for all objects based on a seven (7) second counter interval. This is facilitated via the “STAT” command.
Highly granular L3-L7 telemetry by NetScaler
- System Level: CPU and memory utilization of ADC.
- HTTP Protocol: #Requests/Responses, GET/POST split, HTTP errors for N-S and E-W (for service mesh lite only, sidecar soon).
- SSL: #Sessions and #Handshakes for N-S and E-W traffic for service mesh lite only.
- IP Protocol: #Packets receieved/sent, #Bytes received/sent, #Truncated packets, and #IP address lookup.
- NetScaler AAA: #Active Sessions
- Interface: #Total multicast packets, #Total transferred bytes, and #Jumbo packets received/sent.
- Load balancing virtual server and content switching virtual server: #Packets, #Hits, and #Bytes received/sent.
STAT - perform ADC CLI operations:
>Statistics
“stat ssl”
<!--NeedCopy-->
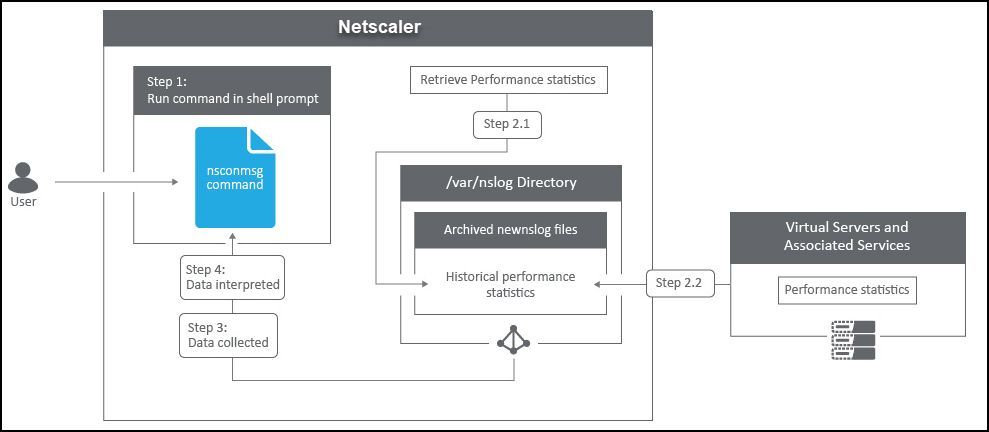
The NetScaler has a log archive structure that allows for the searching of statistics and counters when troubleshooting specific errors via the “NSCONMSG” command.
NSCONMSG - main log file (ns data format)
    Cd/var/nslog

    “Mac Moves”
    nsconmsg -d current -g nic_err
<!--NeedCopy-->
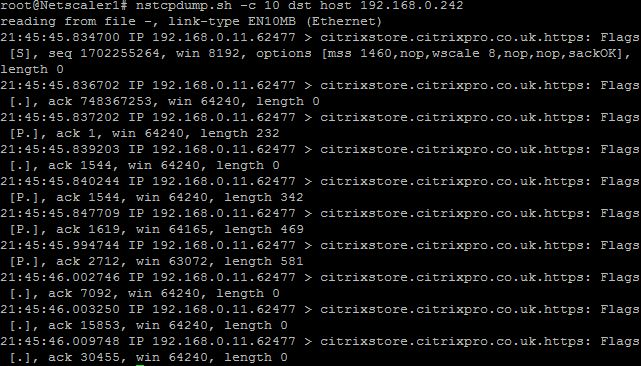
Nstcpdump
You can use nstcpdump for low-level troubleshooting. nstcpdump collects less detailed information than nstrace. Open the ADC CLI and type shell. You can use filters with nstcpdump but cannot use filters specific to ADC resources. The dump output can be viewed directly within the CLI screen.
CTRL + C – Press these keys simultaneously to stop an nstcpdump.
nstcpdump.sh dst host x.x.x.x – Shows traffic sent to the destination host.
nstcpdump.sh -n src host x.x.x.x – Shows traffic from specified host and don’t convert IP addresses to names (-n).
nstcpdump.sh host x.x.x.x – Shows traffic to and from specified host IP.
NSTRACE - packet trace file
NSTRACE is a low-level packet debugging tool for troubleshooting networks. It allows you to store capture files that you can analyze further using the analyzer tools. Two common tools are Network Analyzer and Wireshark.
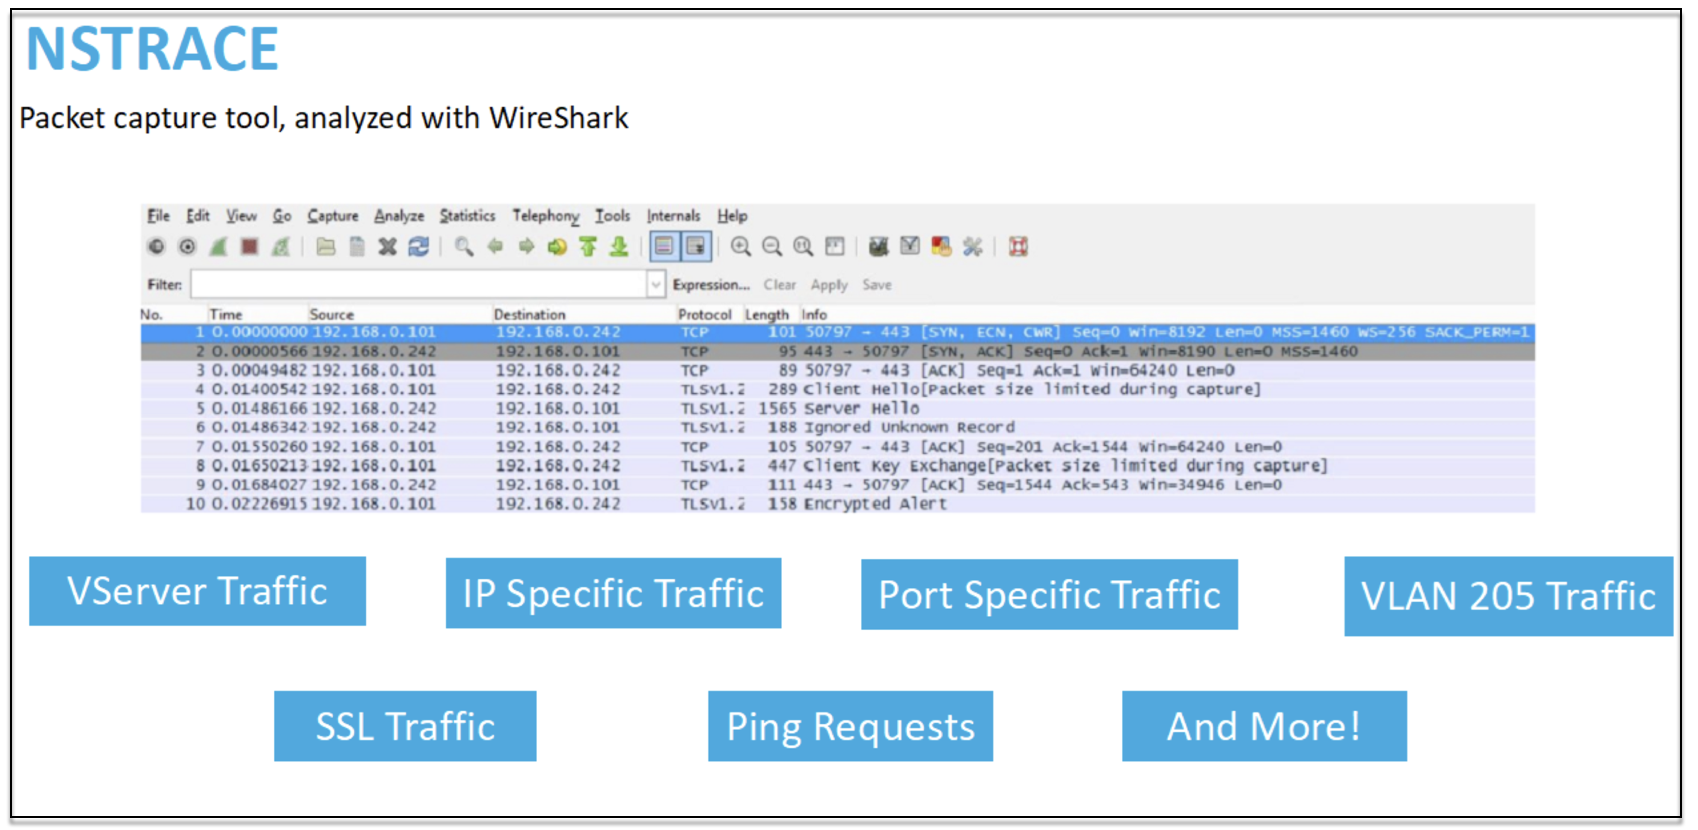
Once the NSTRACE capture file is created in /var/nstrace on the ADC, you can import the capture file into Wireshark for packet capture and network analysis.
SYSCTL - Detailed ADC info: Description, Model, Platform, CPUs, and so on
    sysctl -a grep hw.physmem

    hw.physmem: 862306304
    netscaler.hw_physmem_mb: 822
<!--NeedCopy-->
aaad.debug - Open Pipe for authentication debug info

For more information on how to troubleshoot authentication issues through ADC or ADC Gateway with the aaad.debug module, see aaad.debug Support Article.
There is also the ability to obtain performance statistics and event logs directly for the ADC. For more information on this, see ADC Support Document.
Troubleshooting for SRE and platforms teams
Kubernetes traffic flows
North/South:
- North/south traffic is traffic flowing from the user into the cluster, through the ingress.
East/West:
- East/west traffic is traffic flowing around the Kubernetes cluster: service-to-service or service-to-datastore.
How NetScaler CPX load balances east-west traffic flow in a Kubernetes environment
After you have deployed the Kubernetes cluster, you must integrate the cluster with ADM by providing the details of the Kubernetes environment in ADM. ADM monitors the changes in Kubernetes resources, such as services, endpoints, and Ingress rules.
When you deploy an NetScaler CPX instance in the Kubernetes cluster, it automatically registers with ADM. As part of the registration process, ADM learns about the CPX instance IP address and the port on which it can reach the instance to configure it by using NITRO REST APIs.
The following figure shows how NetScaler CPX load balances east-west traffic flow in a Kubernetes cluster.
In this example,
Node 1 and Node 2 of the Kubernetes clusters contains instances of a front-end service and a back-end service. When the NetScaler CPX instances are deployed in Node 1 and Node 2, the NetScaler CPX instances are automatically registered with ADM. You must manually integrate the Kubernetes cluster with ADM by configuring the Kubernetes cluster details in ADM.
When a client requests the front-end service, the ingress resource load balances the request between the instances of the front-end service on the two nodes. When an instance of the front-end service needs information from the back-end services in the cluster, it directs the requests to the NetScaler CPX instance in its node. That NetScaler CPX instance load balances the requests between the back-end services in the cluster, providing east-west traffic flow.
ADM service graph for applications
The service graph feature in NetScaler Console enables you to monitor all services in a graphical representation. This feature also provides a detailed analysis and useful metrics. You can view service graphs for:
- Applications configured across all NetScaler instances
- Kubernetes applications
- 3-tier Web applications
To get started, see the details in service graph.
View microservice applications counters
The service graph also displays all microservice applications that belong to the Kubernetes clusters. However, the mouse pointer on a service to view the metrics details.
You can view:
- The service name
- The protocol used by the service such as SSL, HTTP, TCP, SSL over HTTP
- Hits – The total number of hits received by the service
- Service Response Time – The average response time taken from the service. (Response time = Client RTT + request last byte – request first byte)
- Errors – The total errors such as 4xx, 5xx, and so on
- Data Volume – The total volume of data processed by the service
- Namespace – The namespace of the service
- Cluster Name – The cluster name where the service is hosted
- SSL Server Errors – The total SSL errors from the service
These specific counters and transaction logs can be extracted through the NetScaler Observability Exporter (COE) using a range of supported endpoints. For more information on COE, see the following sections.
Exporter for NetScaler stats
This is a simple server that scrapes NetScaler stats and exports them via HTTP to Prometheus. Prometheus can then be added as a data source to Grafana to view the NetScaler stats graphically.
To monitor the stats and counters of NetScaler instances, citrix-adc-metric-exporter can be run as a container or script. The exporter collects NetScaler stats such as total hits to a virtual server, HTTP request rate, SSL encryption-decryption rate, and so on from the NetScaler instances and holds them until the Prometheus server pulls the stats and stores them with a timestamp. Grafana can then be pointed to the Prometheus server to fetch the stats, plot them, set alarms, create heat maps, generate tables, and so forth as needed to analyze the NetScaler stats.
Details about setting up the exporter to work in an environment as given in the figure is provided in the following sections. A note on which NetScaler entities/metrics the exporter scrapes by default and how to modify it is also explained.
For more information on Exporter for NetScaler, see the Metrics Exporter GitHub.
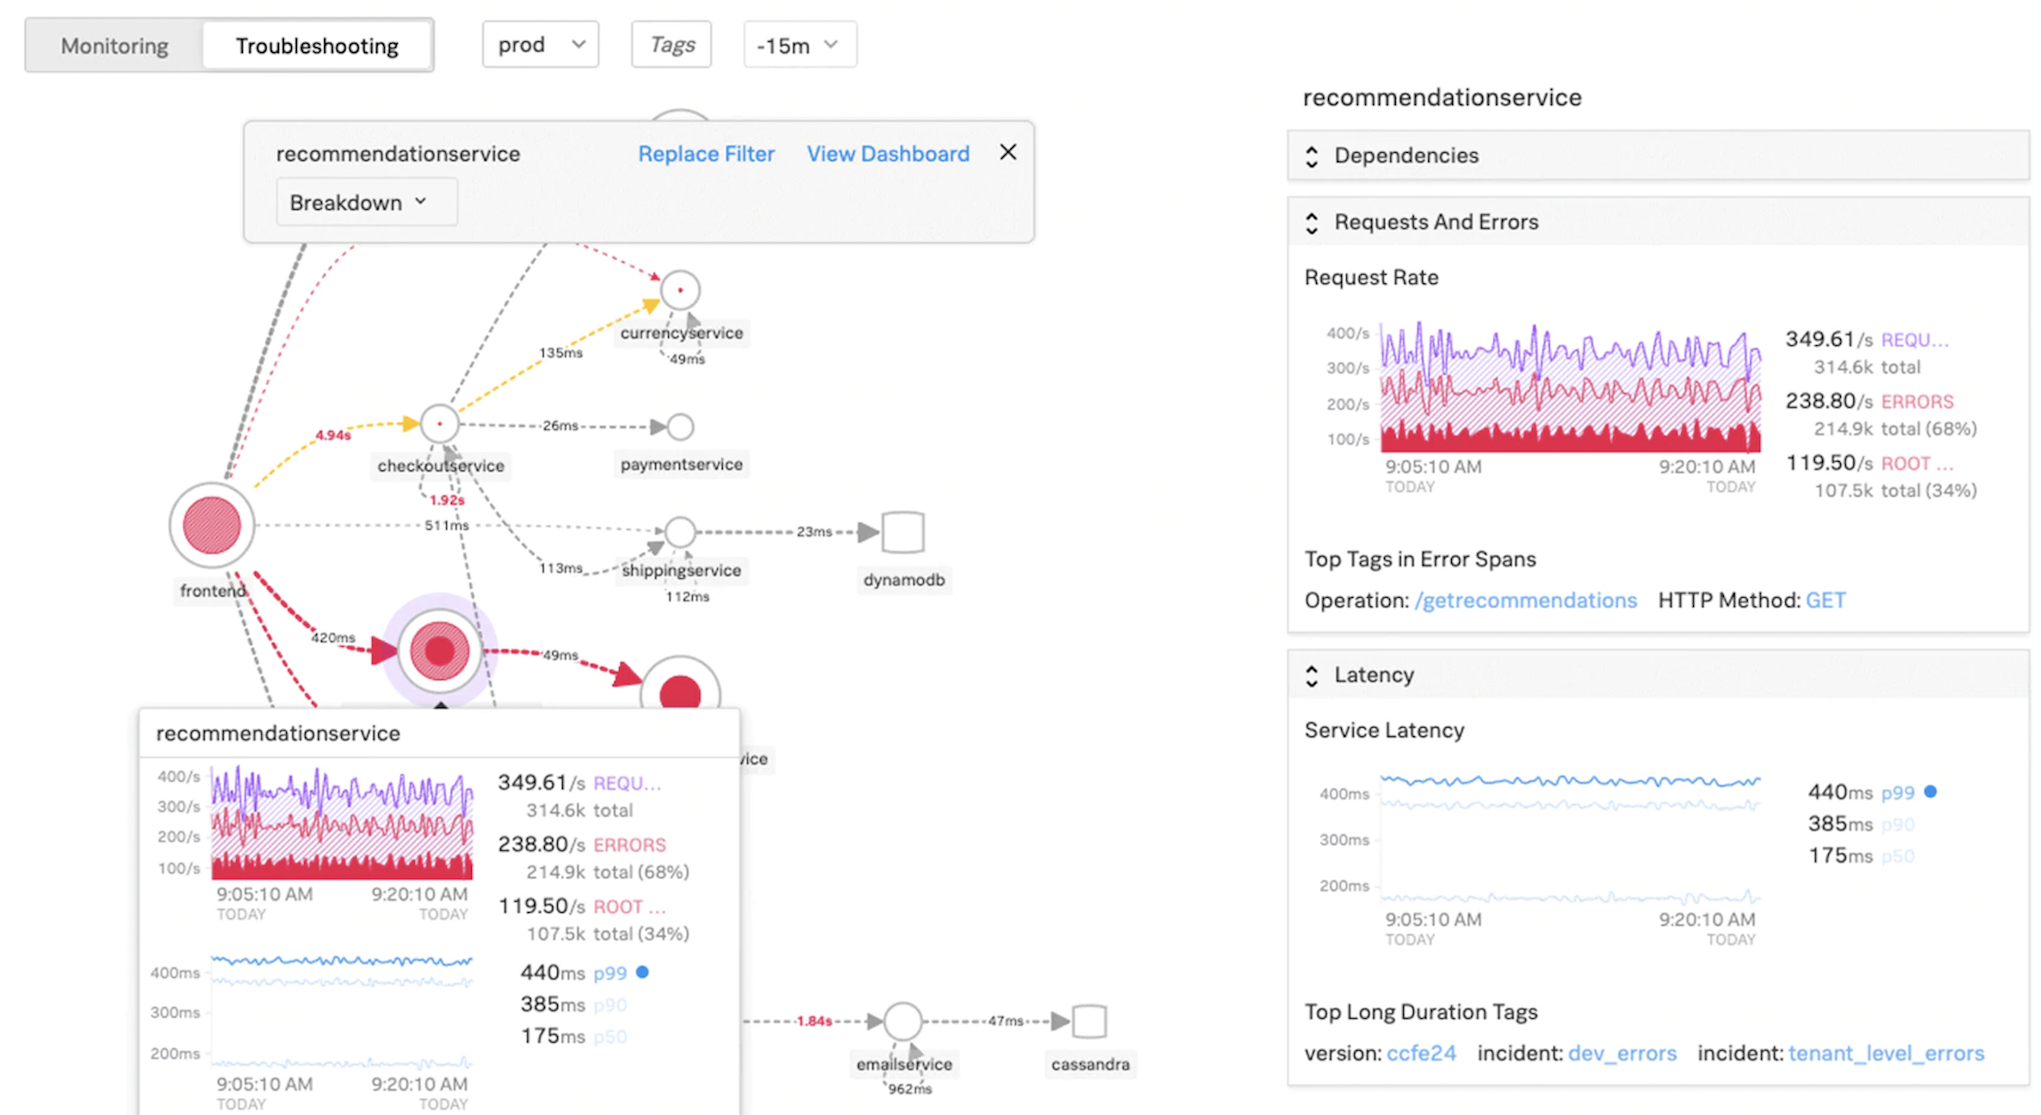
ADM service distributed tracing
In the service graph, you can use the distributed tracing view to:
- Analyze the overall service performance.
- Visualize the communication flow between the selected service and its inter-dependent services.
- Identify which service indicates errors and troubleshoot the erroneous service
- View transaction details between the selected service and each interdependent service.
ADM distributed tracing prerequisites
To view the trace information for the service, you must:
- Ensure that an application maintains the following trace headers, while sending any east-west traffic:
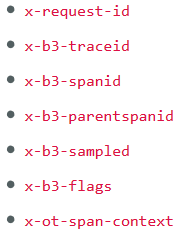
- Update the CPX YAML file with NS_DISTRIBUTED_TRACING and the value as YES. To get started, see Distributed Tracing.
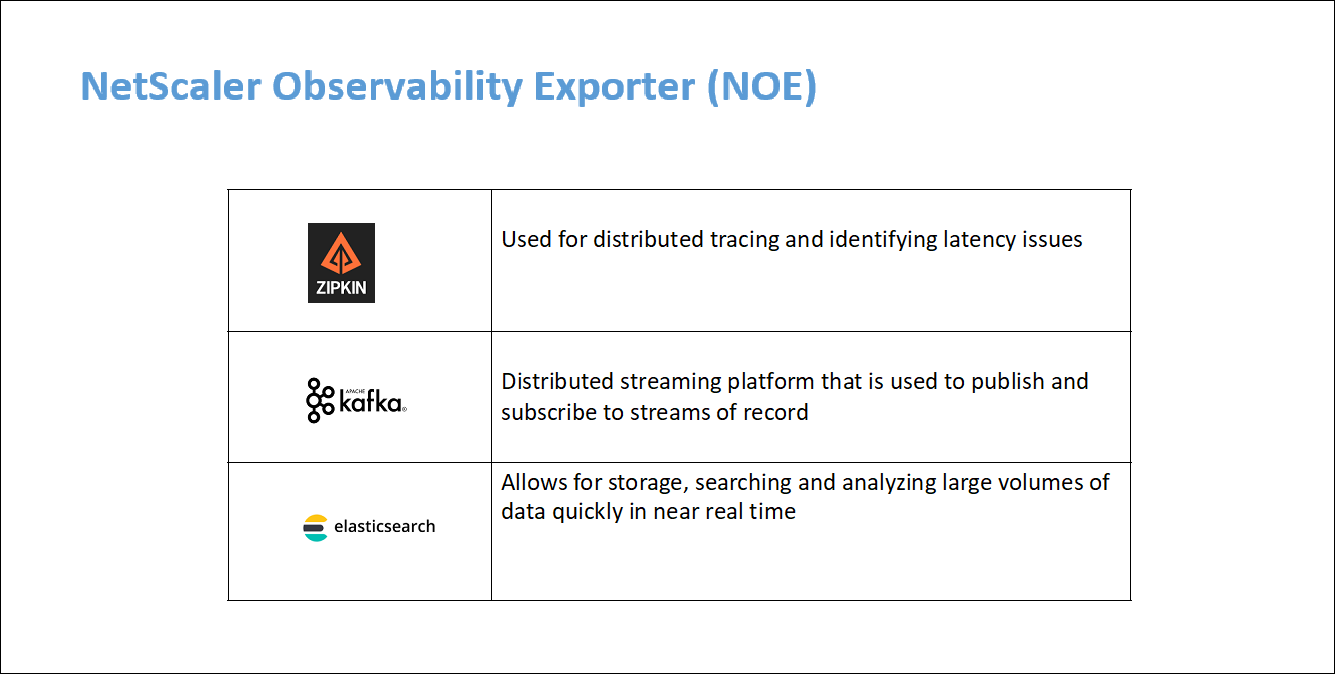
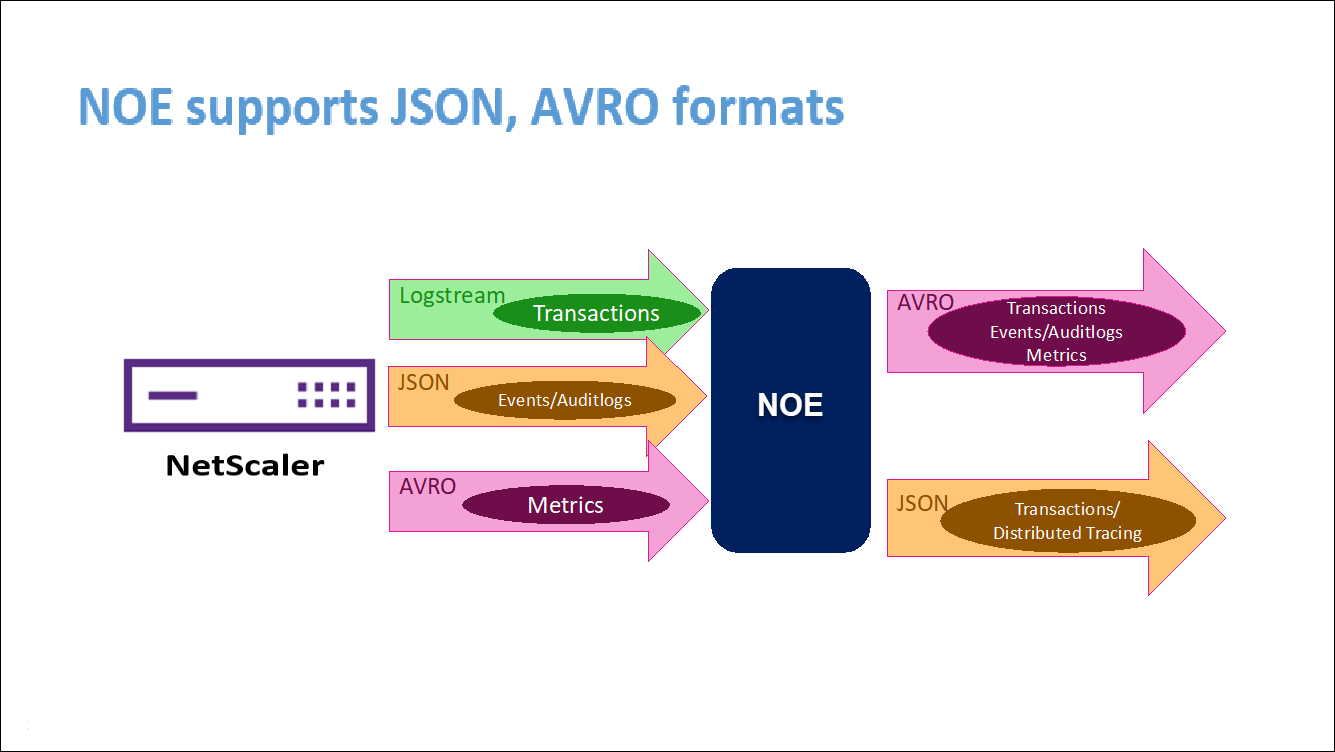
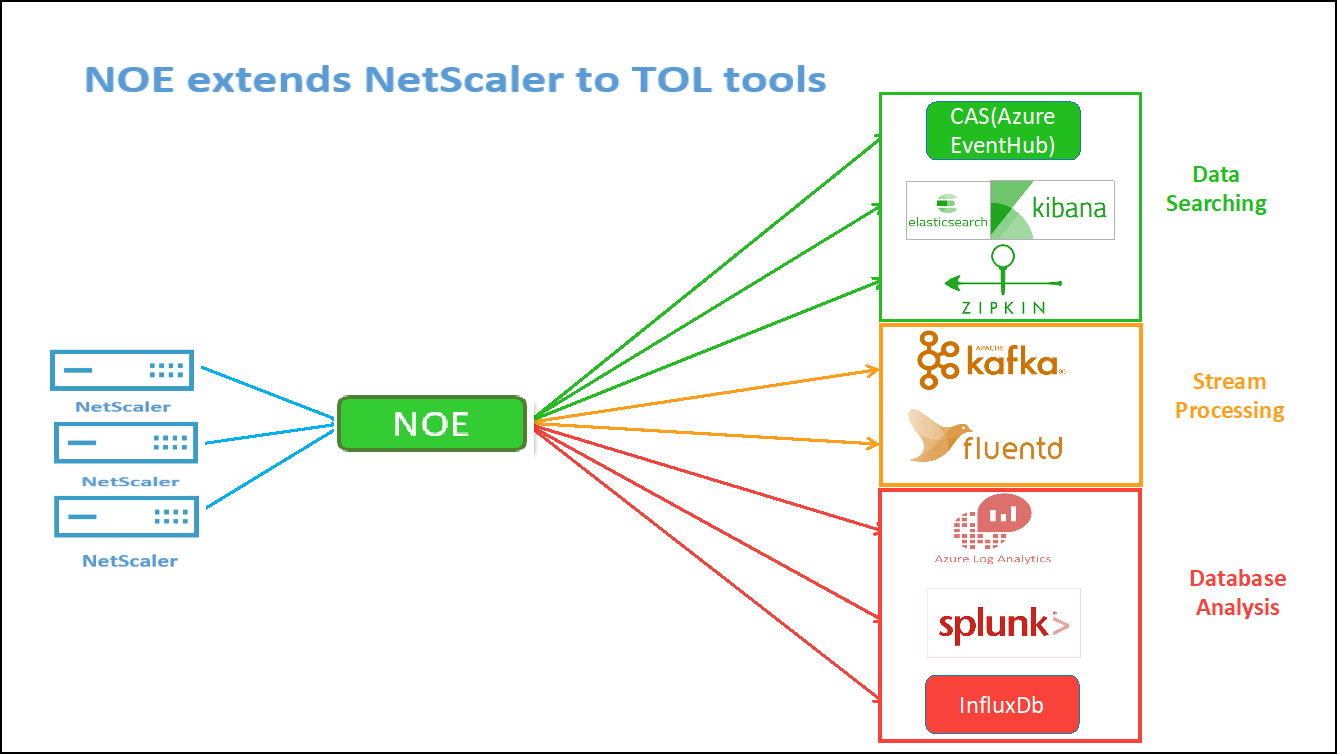
NetScaler Observability Exporter (COE) parsing
NetScaler Observability Exporter is a container which collects metrics and transactions from NetScalers and transforms them to suitable formats (such as JSON, AVRO) for supported endpoints. You can export the data collected by the NetScaler Observability Exporter to the desired endpoint. By analyzing the data exported to the endpoint, you can get valuable insights at a microservices level for applications proxied by NetScalers.
For more information on COE, see the COE GitHub.
COE with Elasticsearch as the transaction endpoint
When Elasticsearch is specified as the transaction endpoint, NetScaler Observability Exporter converts the data to JSON format. On the Elasticsearch server, NetScaler Observability Exporter creates Elasticsearch indexes for each ADC on an hourly basis. These indexes are based on data, hour, UUID of the ADC, and the type of HTTP data (http_event or http_error). Then, the NetScaler Observability Exporter uploads the data in JSON format under Elastic search indexes for each ADC. All regular transactions are placed into the http_event index and any anomalies are placed into the http_error index.
Distributed tracing support with Zipkin
In a microservice architecture, a single end-user request may span across multiple microservices making tracking a transaction and fixing sources of errors challenging. In such cases, traditional ways for performance monitoring cannot accurately pinpoint where failures occur and what is the reason behind poor performance. You need a way to capture data points specific to each microservice handling a request and analyze them to get meaningful insights.
Distributed tracing addresses this challenge by providing a way to track a transaction end-to-end and understand how it is being handled across multiple microservices.
OpenTracing is a specification and standard set of APIs for designing and implementing distributed tracing. Distributed tracers allow you to visualize the data flow between your microservices and helps to identify the bottlenecks in your microservices architecture.
NetScaler Observability Exporter implements distributed tracing for NetScaler and currently supports Zipkin as the distributed tracer.
Currently, you can monitor performance at the application level using NetScaler. Using NetScaler Observability Exporter with NetScaler, you can get tracing data for microservices of each application proxied by your NetScaler CPX, MPX, or VPX.
To get started, see the GitHub Observability Exporter.
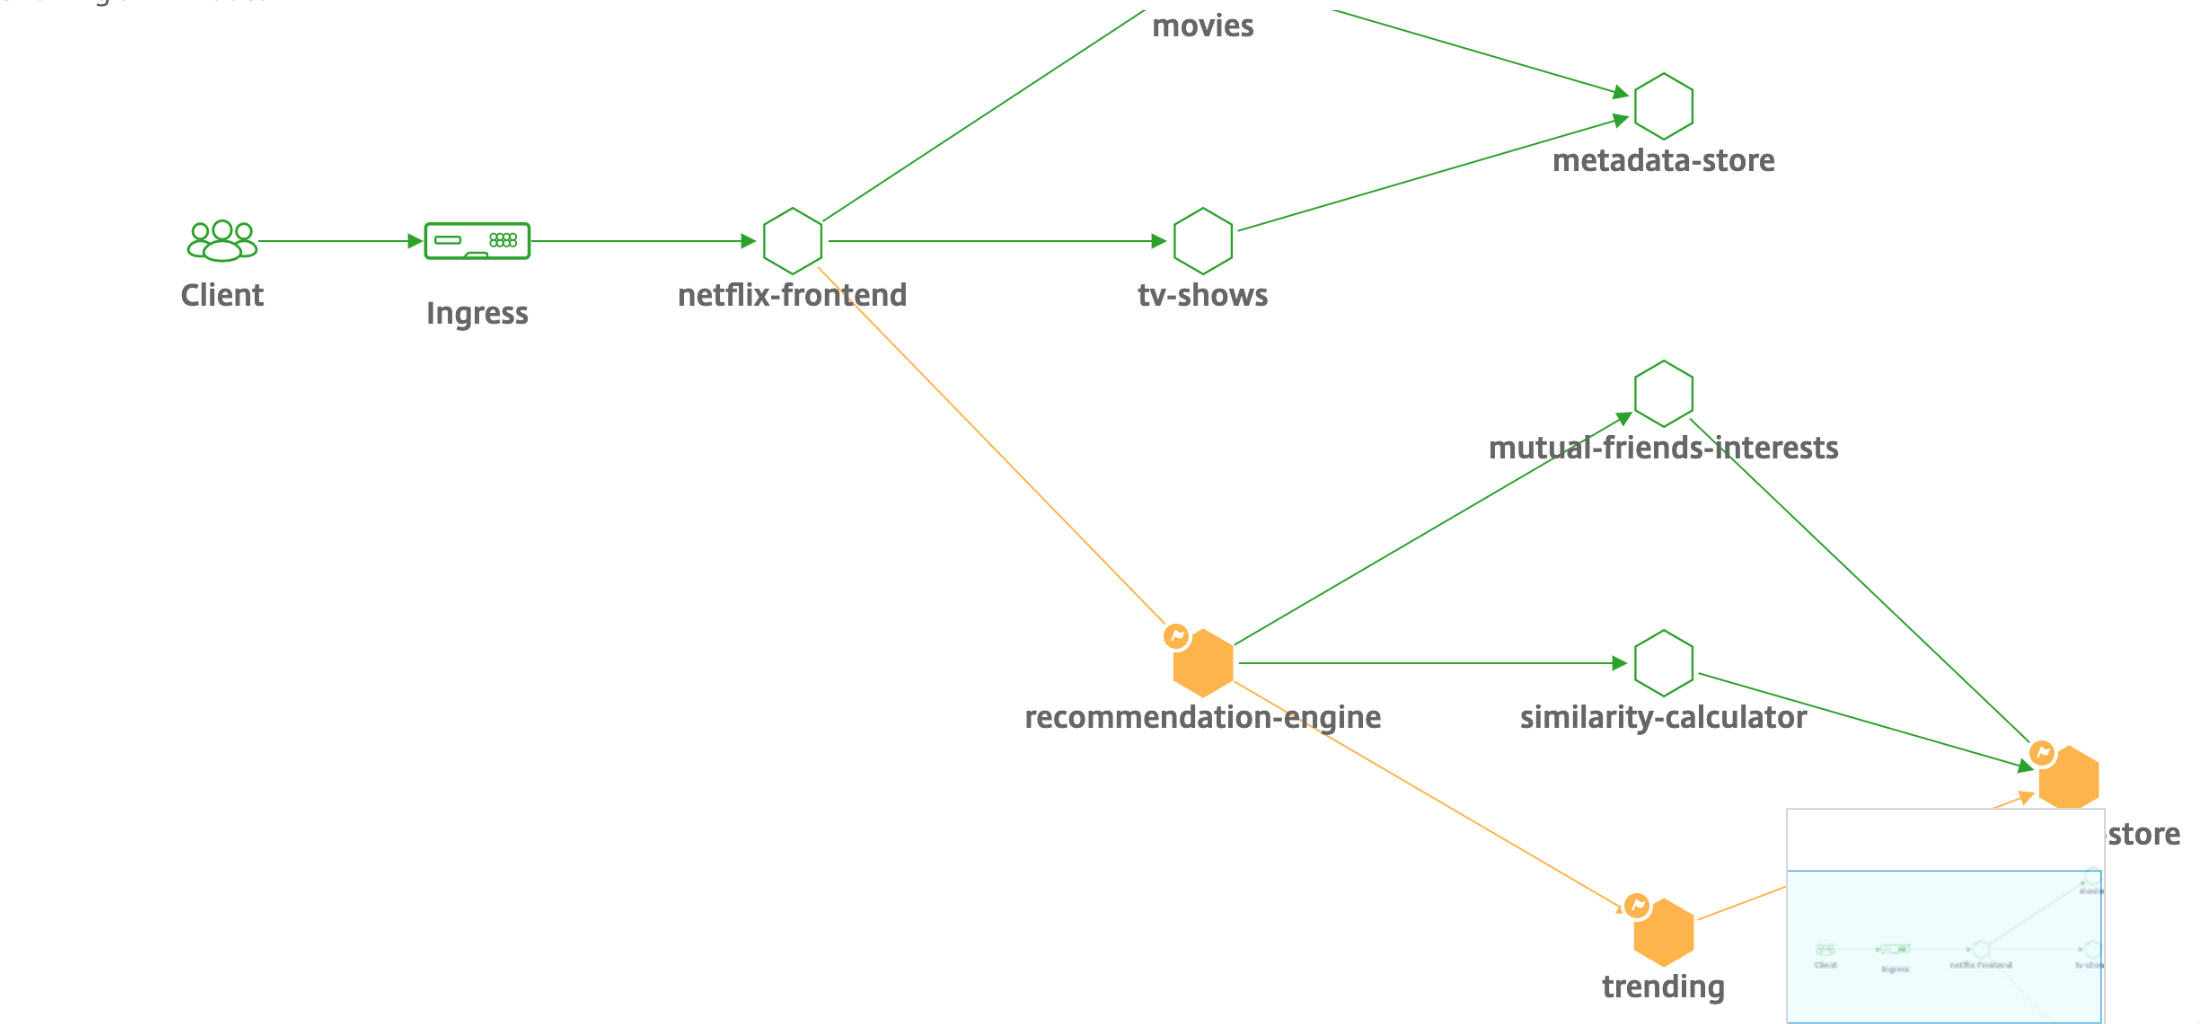
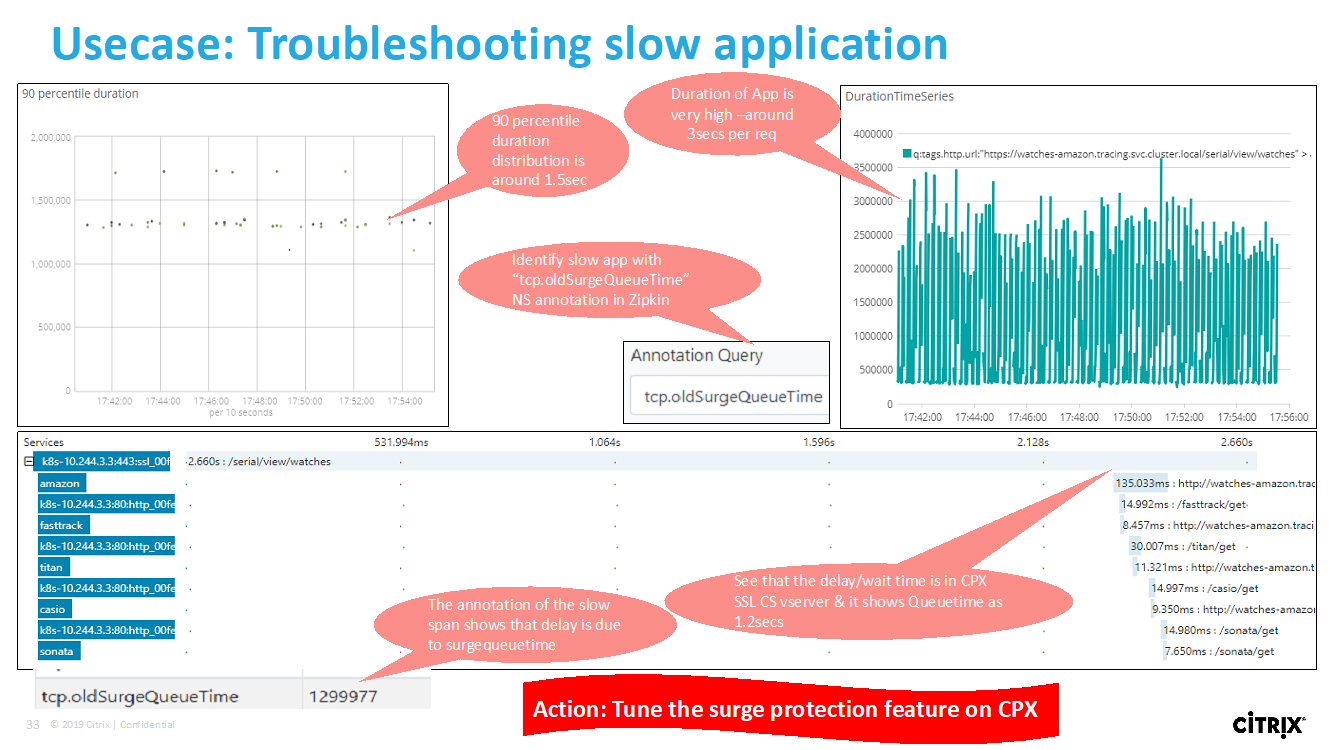
Zipkin for application debugging
Zipkin is an open source distributed tracing system based on Dapper’s paper from Google. Dapper is Google’s system for its system distributed tracing in production. Google explains this in their paper - “We built Dapper to provide Google’s developers with more information about the behavior of complex distributed systems”. Observing the system from different angles is critical when troubleshooting, especially when a system is complex and distributed.
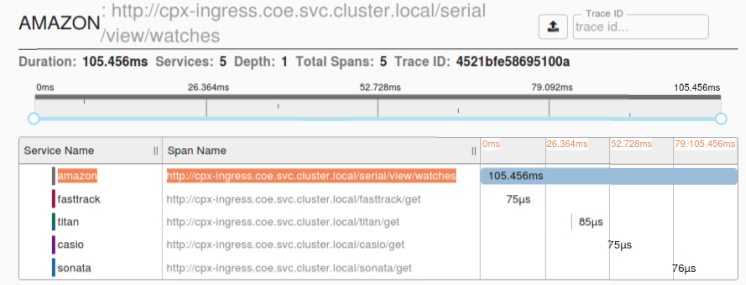
The following Zipkin trace data identifies a total of 5 spans and 5 services related to the Watches sample application. The trace data shows the specific span data across the 5 microservices.
To get started, see Zipkin.
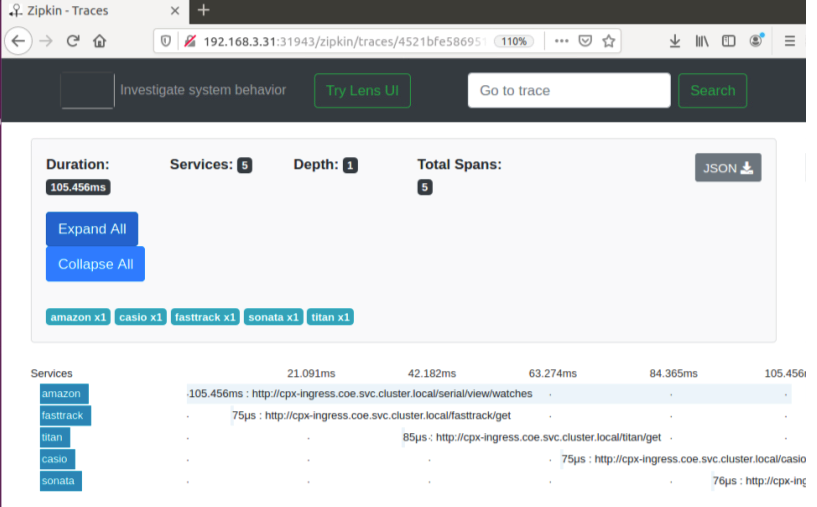
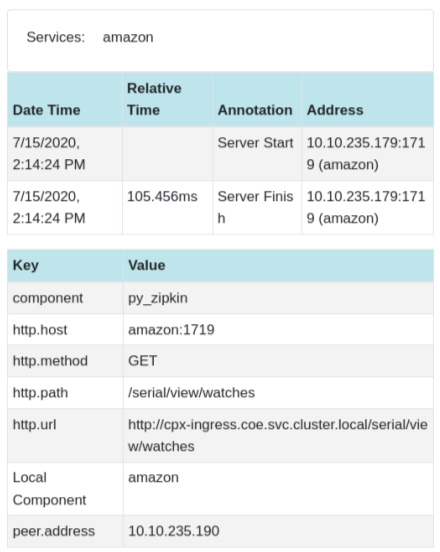
Sample Zipkin span showing application latency for initial page load request:
Kibana for viewing data
Kibana is an open user interface that lets you visualize your Elasticsearch data and navigate the Elastic Stack. Do anything from tracking query load to understanding the way requests flow through your apps.
Whether you’re an analyst or an admin, Kibana makes your data actionable by providing the following three key functions:
- An open-source analytics and visualization platform. Use Kibana to explore your Elasticsearch data, and then build beautiful visualizations and dashboards.
- A UI for managing the Elastic Stack. Manage your security settings, assign user roles, take snapshots, roll up your data, and more — all from the convenience of a Kibana UI.
- A centralized hub for Elastic’s solutions. From log analytics to document discovery to SIEM, Kibana is the portal for accessing these and other capabilities.
Kibana is designed to use Elasticsearch as a data source. Think of Elasticsearch as the engine that stores and processes the data, with Kibana sitting on top.
From the home page, Kibana provides these options for adding data:
- Import data using the File Data visualizer.
- Set up a data flow to Elasticsearch using our built-in tutorials. If a tutorial doesn’t exist for your data, go to the Beats Overview to learn about other data shippers in the Beats family.
- Add a sample data set and take Kibana for a test drive without loading data yourself.
- Index your data into Elasticsearch with REST APIs or Client Libraries.
Kibana uses an index pattern to tell it which Elasticsearch indices to explore. If you upload a file, run a built-in tutorial, or add sample data you get an index pattern for free and are good to start exploring. If you load your own data you can create an index pattern in Stack Management.
Step 1: Configure Index Pattern for Logstash
Step 2: Select the index and generate traffic to populate.
Step 3: generate application from the unstructured data from log feeds.
Step 4: Kibana formats the Logstash input to create reports and dashboards.
- Time Range
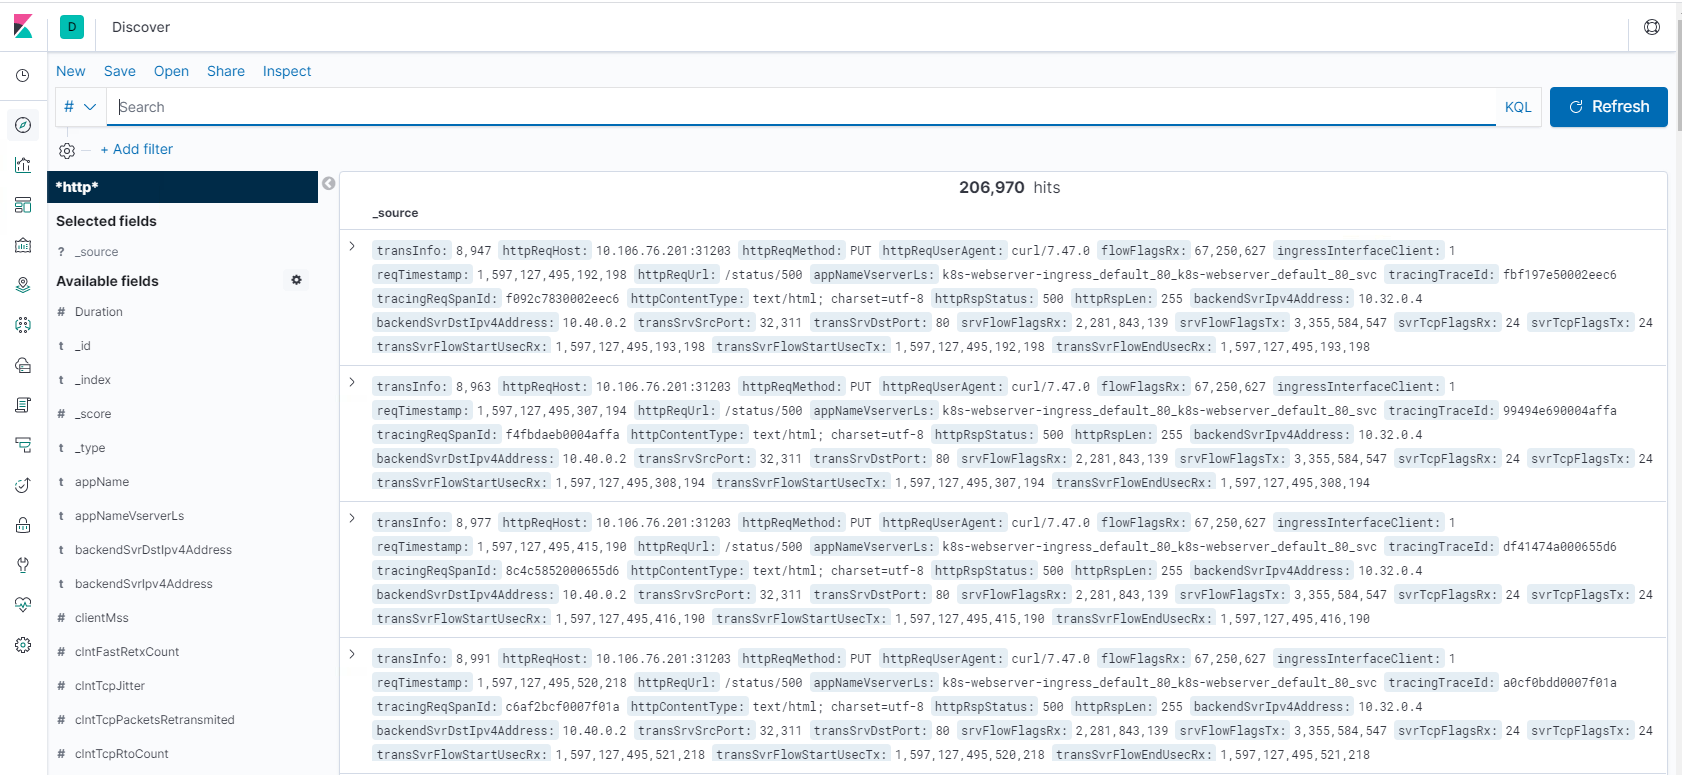
- Tabular View
- Hit counts based on the application.
- Time IP, Agent, Machine.OS, Response Code (200), URL
- Filter on values
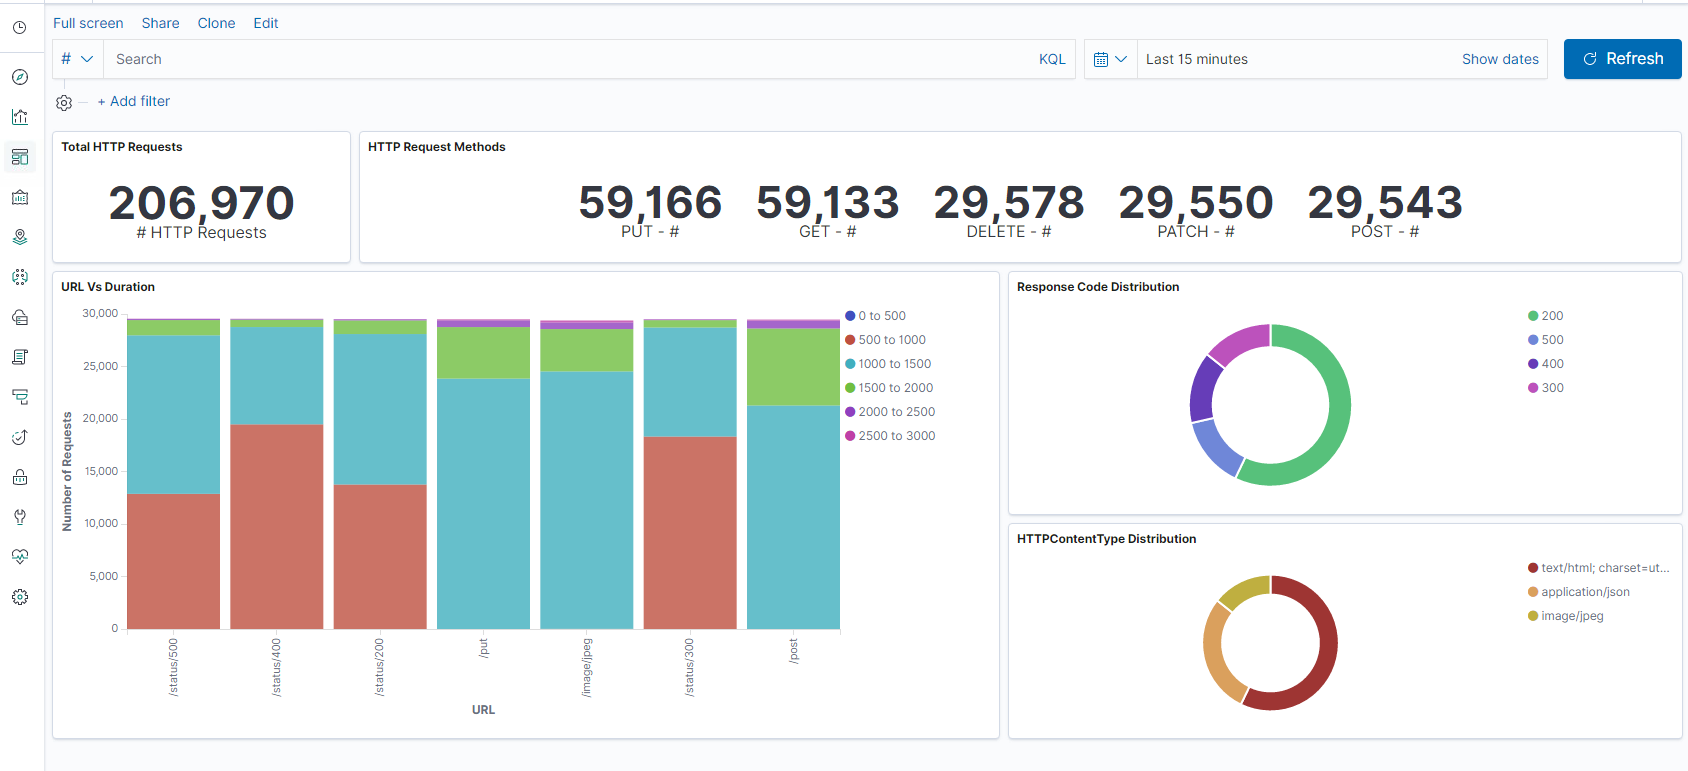
Step 5: Visualize the data in a report of aggregations.
- Result Aggregation in a chart report (pie, graph, and so forth)
Share
Share
In this article
- Overview
- Application performance and latency overview
- NetScaler Application Delivery Management SSL dashboard
- Third party integrations
- How to load balance Ingress traffic to TCP or UDP based application
- Monitor and improve the performance of your TCP or UDP based applications
- NetScaler Application Delivery Management (ADM) Service
- Troubleshooting for NetScaler teams
- Troubleshooting for SRE and platforms teams
This Preview product documentation is Cloud Software Group Confidential.
You agree to hold this documentation confidential pursuant to the terms of your Cloud Software Group Beta/Tech Preview Agreement.
The development, release and timing of any features or functionality described in the Preview documentation remains at our sole discretion and are subject to change without notice or consultation.
The documentation is for informational purposes only and is not a commitment, promise or legal obligation to deliver any material, code or functionality and should not be relied upon in making Cloud Software Group product purchase decisions.
If you do not agree, select I DO NOT AGREE to exit.