Infrastructure Analytics
What is Infrastructure Analytics?
The Infrastructure analytics from Citrix Analytics for Performance™ provides insights into the status of key components in your Apps and Desktops sites.
- You can view the health and status of multiple machines on a single dashboard.
- You can view the analytics of machines in a single site or get a cohesive view across all sites.
- You can view the analytics across selected single or multi-session OS Delivery Groups.
- You can view machine usage trends over a period based on its availability and performance.
This data enables you to take better-informed decisions about capacity management, perform analysis and risk assessment of your Sites. Thus, you can proactively take necessary actions to minimize critical failures and optimize the usage and performance of your Sites.
Machine Availability provides information about single and multi-session OS machines. You can view the current availability of machines across your environment. You can see the distribution of machines in available and unavailable states across the selected sites and Delivery Groups. The Aggregate State of machines is also plotted alongside Session Availability across the chosen time interval.
Machine Performance provides information about the performance of multi-session OS machines only.
You can use the custom time selection filter to view the machine availability and machine performance of machines for a specific time period.
How to access the Infrastructure dashboard
To view the Infrastructure dashboard:
-
Log on to Citrix Cloud™ and select your Cloud Customer.
-
On the Citrix Analytics service tile, click Manage.
-
Citrix Analytics service opens, click the Performance tab.
-
Click the Infrastructure tab.
How to use the Infrastructure dashboard
The Infrastructure dashboard provides the detailed status of the machines deployed across the sites.
As an administrator, if you manage and monitor few sites for your organization, you can use the Infrastructure dashboard to get insights into the availability and performance of machines across the Delivery Groups in all the sites. This information helps take infrastructure decisions proactively to improve the user experience while also keeping track of optimum usage and infrastructure cost reduction.
Current Machine Availability
Note:
Current Machine Availability is under Preview.
The Current Machine Availability panel provides the availability of machines in the last 15 minutes. A breakup of machine count is displayed per state under the Available and Unavailable Category.
Note that machine availability does not ensure service availability as the service is also dependent on other factors. This information helps determine the availability of provisioned machines to serve sessions.
The machine count and percentage in each last known machine state is displayed. The machine count does not include machines which are in a catalog but are not yet assigned to a delivery group. Clicking the machine count opens the Machines self-service page. This view lists the machines in the specific state with further details for each machine during the last 15 minutes.
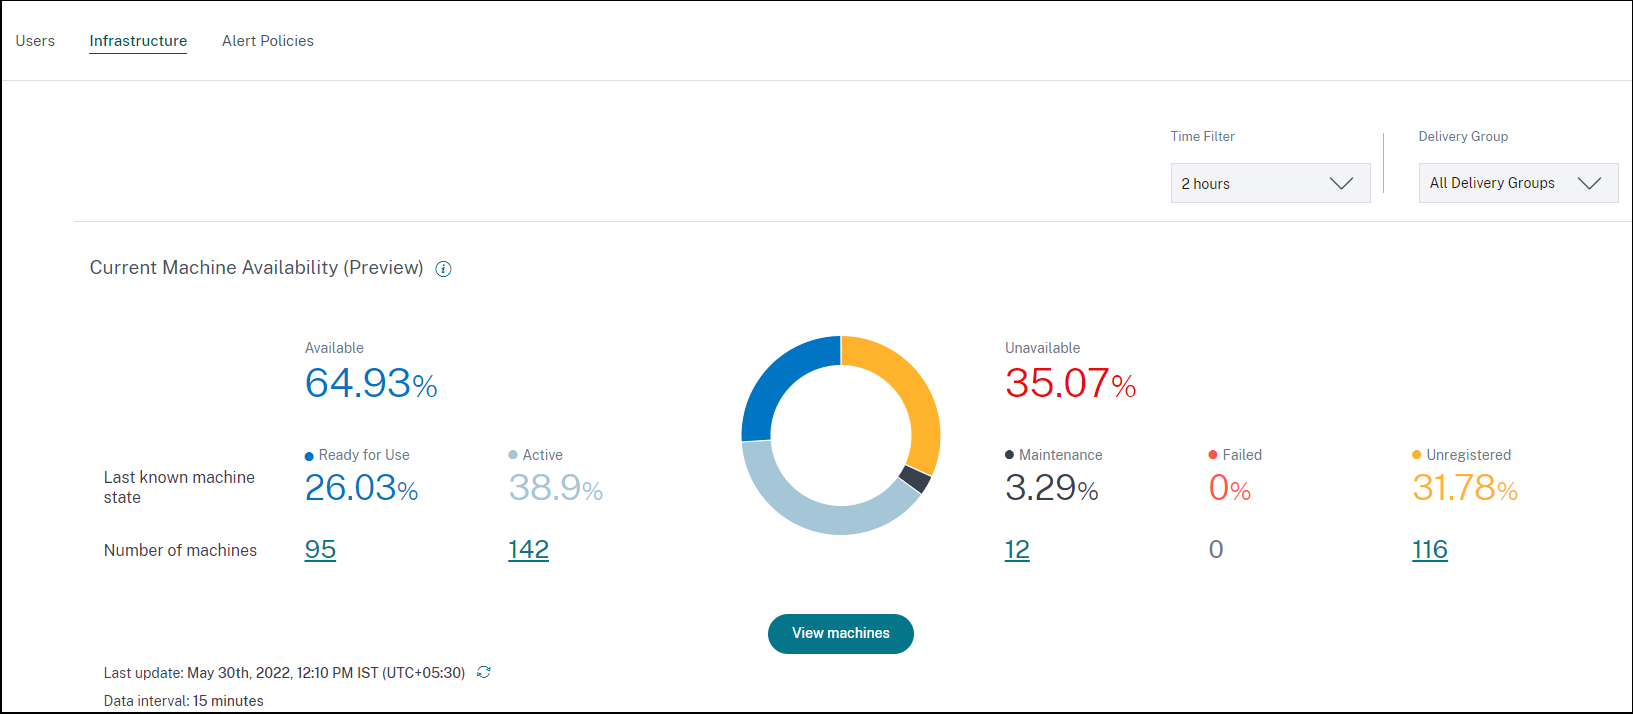
Available Machines: You can view the percentage of machines that were available in the last 15 minutes in the selected sites and Delivery Groups. Available Machines are in the following states:
- Ready for use (single and multi-session machines): These machines have no active sessions. The machines are in healthy state.
- Active (single and multi-session): In this state, the machine has at least one active session. New sessions cannot be launched on single-session OS machines in the active state. On multi-session OS machines, new sessions can be launched depending on the machine capacity. Active machines number also includes the machines on which all sessions have been disconnected.
Unavailable Machines: You can view the percentage of machines that were unavailable in the last 15 minutes in the selected sites and Delivery Groups. You can use this information to optimize machine utilization across your environment. Unavailable Machines are in the following states:
-
Unregistered: Machine is not registered with the Broker Service.
-
Failed: Machine failed to start.
-
Maintenance: Machine is in maintenance mode, no new connections are allowed. These are the machines which were registered in healthy state and are now in maintenance. Machines that weren’t registered are counted as an Unregistered machines.
View Machines takes you to the Machines self-service page showing all the machines in the environment. For more information, see the Self-Service search for Machines.
Machine Availability and Session Availability Trends
Note:
Machine Availability Trends is under Preview.
The Machine Availability trend shows the Aggregate State of machines plotted across the selected period. The machine state is aggregated to consider the least favorable state from among Ready for use, Active, Maintenance, Unregistered and Failed in that order.
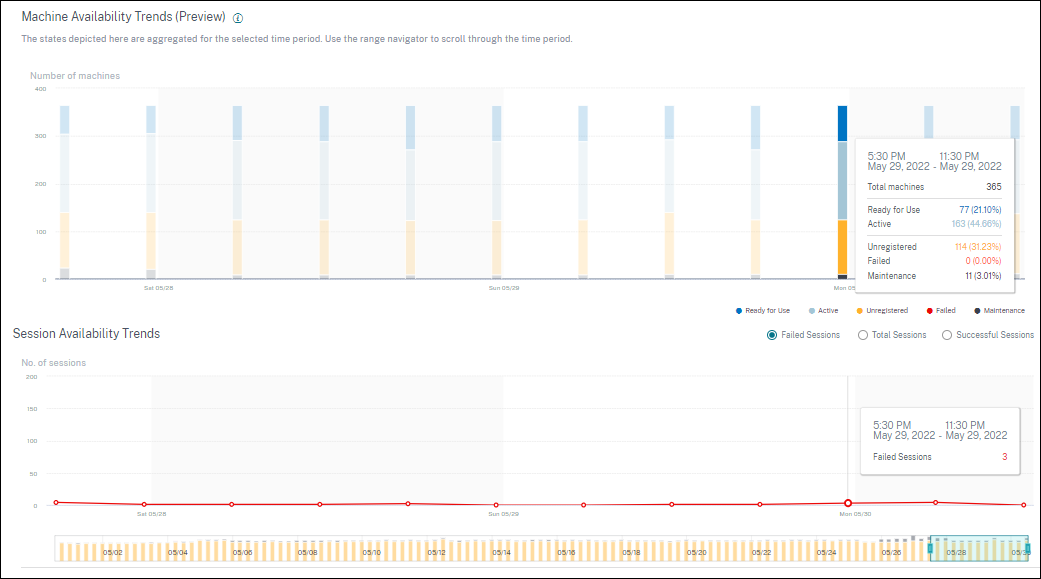
You can drill down from a specific section on the graph to view the details of the machines in a specific state in the Machine self-service view. On the Session Availability trend, you can choose from among Successful, Failed, and Total sessions to be plotted for the selected period. Trends for one-month and one-week periods are plotted with a 6-hour granularity. You can zoom into the one-month Machine and Sessions Availability trends using the time navigator in a range of 3-7 days.
The time navigator also reflects the machine availability trends. This helps you identify time periods with a large number of unavailable machines, so you can easily navigate and zoom into the required period in the Machine availability trend. You can use the synchronized tool tips on the Machines and Sessions Availability trends to understand the correlation between unavailable machines and failed sessions.
Troubleshooting Machines
Unregistered and failed machines can become unusable for the following reasons:
-
The machine fails to communicate with the Delivery Controller.
-
Broker Service experiences issues while creating a session prepare request.
-
Network issues that resulted in the machine not accepting the session prepare request.
-
A timeout occurs when the machine is attempting to register with the Delivery Controller.
-
The machine might not be powered on for session launch.
-
Delivery Controller sends a request to the machine to prepare for a connection from an end user but the machine actively refuses the request.
-
Delivery Controller does not send the required configuration data, such as policy settings and session information to the machine during session launch.
-
The machine is removed from the Delivery Group.
-
The machine is not registered.
-
Machine is in unavailable power state.
-
The machine is experiencing internal issues.
-
The machine fails to connect and register with the Cloud Connector or Delivery Controller.
-
The machine is powered off or shut down.
Machine Performance
The Machine Performance panel shows the distribution of machines based on the load.
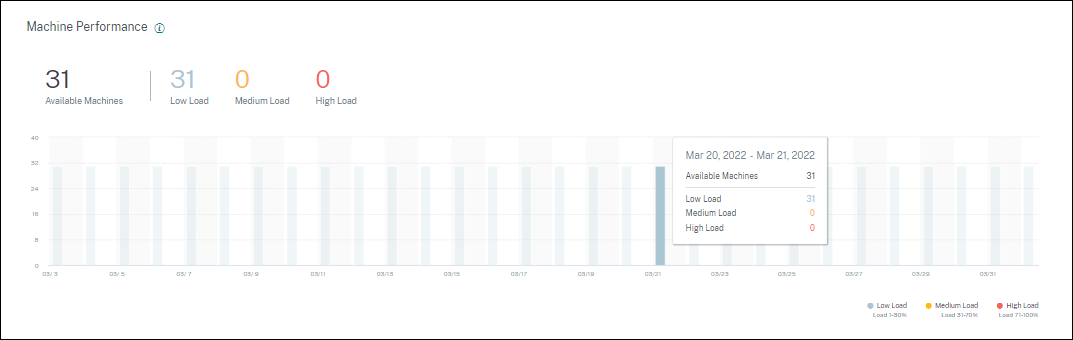
This information is available only for multi-session OS machines. You can view the number of machines in usable state categorized based on the load evaluator index such as high, medium, and low for the chosen selected time period, Site, and Delivery Groups.
The graph displays machines plotted based on the categorization as high, medium, and low load over the selected duration. Hover over the bar graph to view the detailed status of the usable machines at a given time. You can monitor the load distribution trends across the machines over a time period.
The load evaluator index for a machine is the maximum value of the individual indexes that are enabled such as session count, CPU plus five percent of the average of the other enabled indexes. Based on the load evaluator index, you can configure load management between servers delivering Windows Server OS machines. For more information, see Load management policy settings.
Machine load is categorized as follows:
-
High load: Load more than 70%
-
Medium load: Load between 30% to 70%
-
Low load: Load less than 30%
For information about how the load evaluator index is calculated, see Knowledge Center article CTX202150.