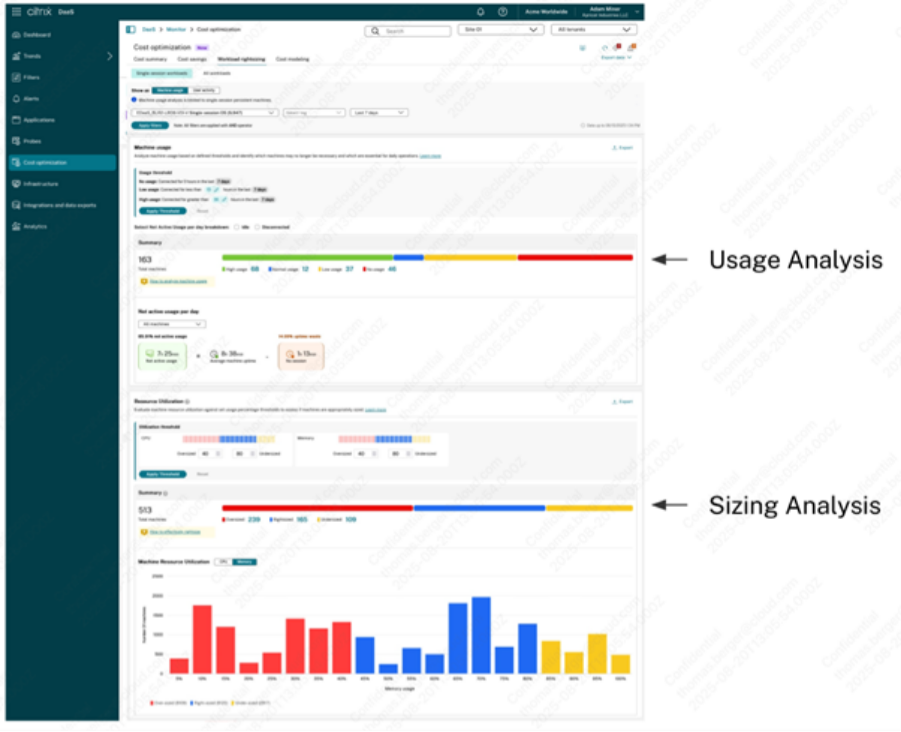
Workload rightsizing
The enhanced workload rightsizing page helps you analyze the usage and sizing aspects of your delivery groups. Hereby, delivery groups can be analyzed based on machine or user activity.
The machine-based analysis enables you to:
-
Categorize virtual desktops based on usage to identify machines with no or low activity and reduce spending on unused resources.Usage Analysis
-
Analyze resource utilization on virtual desktops to identify machines that needs to be right sized to reduce cost or improve user experience.Sizing Analysis
The user-based analysis enables you to:
-
Categorize the users based on their activity. Consider removing the access entitlement of users with no activity for IT hygiene reasons. Users with low usage could be moved to shared resources for a more efficient use of resources.
-
Analyze the resource consumption of users to identify cohorts with higher or lower than average resource consumption, and to distribute users more effectively.
Click the Cost Optimization tab from the left menu on the Home page. And then, click the Workload rightsizing tab to access the Workload rightsizing page.
Note:
At the top of the page, you can toggle between machine and user-based analysis.
You can also click the Rightsize this delivery group link from the Infrastructure details section in the Cost Optimization tab > Cost savings to access the Workload rightsizing page.
Machine analysis is ideal for scenarios with virtual desktops statically assigned to users, such as Windows 365 Enterprise or Frontline dedicated. User analysis is useful for the analysis of delivery groups with randomly assigned virtual desktops. Both analyses are currently limited to single session machines.
Note:
The classic rightsizing analysis, accessible through the “All Workloads” button at the top of the page, will be deprecated in an upcoming release.
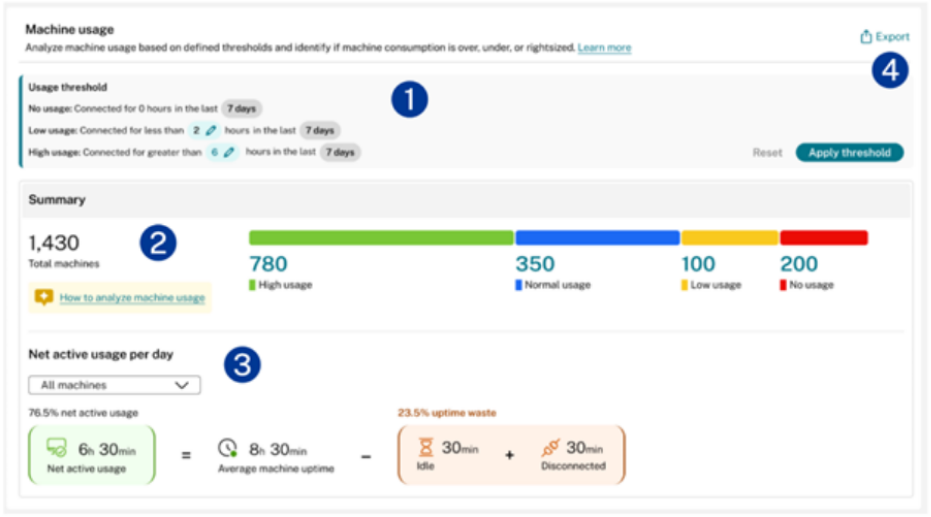
Usage analysis
Usage analysis enables you to categorize virtual desktops based on their activity levels as follows:
- Low or no usage machines (Dedicated machines): Machines in this category might no longer be necessary and can potentially be removed to save costs.
- High usage machines (Dedicated machines): This category is critical for daily operations and might require additional service continuity measures.
- Low or no-usage users (Pooled machines): Users with no activity within the selected timeframe may no longer need to be assigned to the delivery group. Removing them can help reduce the costs of your environment. Low-activity users may benefit from reassignment. To consolidate usage and reduce costs, consider moving low-activity users who have a dedicated desktop to a pooled desktop.
To perform usage analysis:
- Select machines based on Delivery Groups or Tags
- Choose the timeframe for analysis.
- Review and configure thresholds that define low and high usage patterns.
- Examine the summary section showing virtual desktop categorization based on configured thresholds.
- Review the net active usage section displaying usage details for each machine. Idle and disconnected time can be included or excluded in net active usage analysis.
- Use the drop-down to focus on specific categories.
- Export machine names and associated users using the export function to review the names of the machines and their associated users.
Note:
The example provided illustrates machine-based usage analysis; however, the steps for user-based analysis are equivalent and are not discussed separately.
Sizing analysis
Sizing analysis categorizes virtual desktops or users based on resource utilization as follows:
- Oversized machines: Have more resources than necessary; reducing resource allocation can lower costs without impacting user experience
- Undersized machines: Lack sufficient resources; user experience can be improved by allocating more resources
- Right-sized machines: Fall between the oversized and undersized thresholds
- Light users: These users may benefit from reassignment. To consolidate and reduce costs, consider moving light users with a dedicated desktop to a shared pooled desktop.
- Moderate users: Moderate users are properly assigned to machines in a delivery group and should expect an optimal user experience.
- Power users: Power users consume significant resources, and when they share a pooled desktop, their high usage can negatively impact the overall experience for other users on that machine. To enhance the experience for all users and ensure that power users have consistent access to a desktop, consider moving these users to a dedicated desktop or assigning them to individual delivery groups.
To perform Sizing Analysis:
- Select machines based on Delivery Groups or Tags
- Choose the timeframe for analysis.
- Configure separate thresholds for CPU and Memory utilization.
- Review the summary section showing virtual desktop categorization
- Analyze the machine resource utilization chart showing CPU and Memory distribution
- Fine-tune machine configurations based on resource type and identify outliers
- Export machine names and associated users using the export function to review the names of the machines and their associated users
Note:
The example provided illustrates machine-based resource consumption analysis; however, the steps for user-based analysis are equivalent and are not discussed separately.
Note:
The utilization analysis uses 95th-percentile utilization for delivery groups in the selected timeframe, indicating that 95% of CPU or Memory utilization is at or below the set value.
Best practices
- Use usage analysis to identify cost-saving opportunities by removing underutilized machines.
- Apply sizing analysis to optimize resource allocation and improve user experience.
- Use machine analysis for statically assigned virtual desktop scenarios for accurate analysis.
- Use user activity for pooled virtual desktop scenarios for accurate analysis.
- Consider roaming patterns when analyzing randomly assigned virtual desktops.
- Export detailed reports for further analysis and documentation.
Key terms and charts
Machine net active usage: Net active usage is calculated by deducting the total uptime waste from the average machine uptime. All times are in minutes.
Percentage of Net Active Usage: The actual time users actively used the machine. This is the duration when at least one session was active while the machine was powered on.
Average Machine Uptime: The total time the machine was powered on.
No Session: The wasted uptime due to no active sessions.
Idle Time: Wasted uptime due to idle sessions. This is the time when all sessions on the machine are idle.
Disconnected Time: Wasted uptime due to disconnected sessions. This is the time when all sessions on the machine are disconnected.
Total machine - Displays the total number of machines. This includes all the machines which were powered on during the selected period.
Average session density - This is an average across the number of machines and across the selected time period. Refers to the amount of session load on a machine which affects the resource available for sessions.
Unused machines - Displays the number of machines which had no sessions over the selected time period but which were still powered on.
CPU utilization:
Machine cohort - Provides information about the machine groups categorized into top, middle, and bottom based on its CPU utilization. Thresholds limit can be configured by the admins.
Range of CPU Peaks - Displays the CPU peaks range based on its utilization corresponding to the machine cohort.
Machines - Displays the number of machines corresponding to the machine cohort.
Session density - Displays the session density corresponding to the machine cohort.
Resource utilization trends:
Range of CPU peaks - Displays the range of CPU peaks in a band. When you hover on any point in the band, the top and bottom value of the band is displayed.
Peak memory utilization - Displays the highest memory utilization for the selected machines and for the selected time over a graph.
Average Session density - Displays the average session density for the selected machines and for the selected time over a graph.
Average ICA RTT - Displays the average round trip time for the session. This chart shows breaks when there are no active sessions or when sessions are disconnected.
Average logon duration - Displays the average logon duration for the selected machines and for the selected time period over a graph. This chart shows data when a new logon starts during the selected time.