Filter data to troubleshoot failures
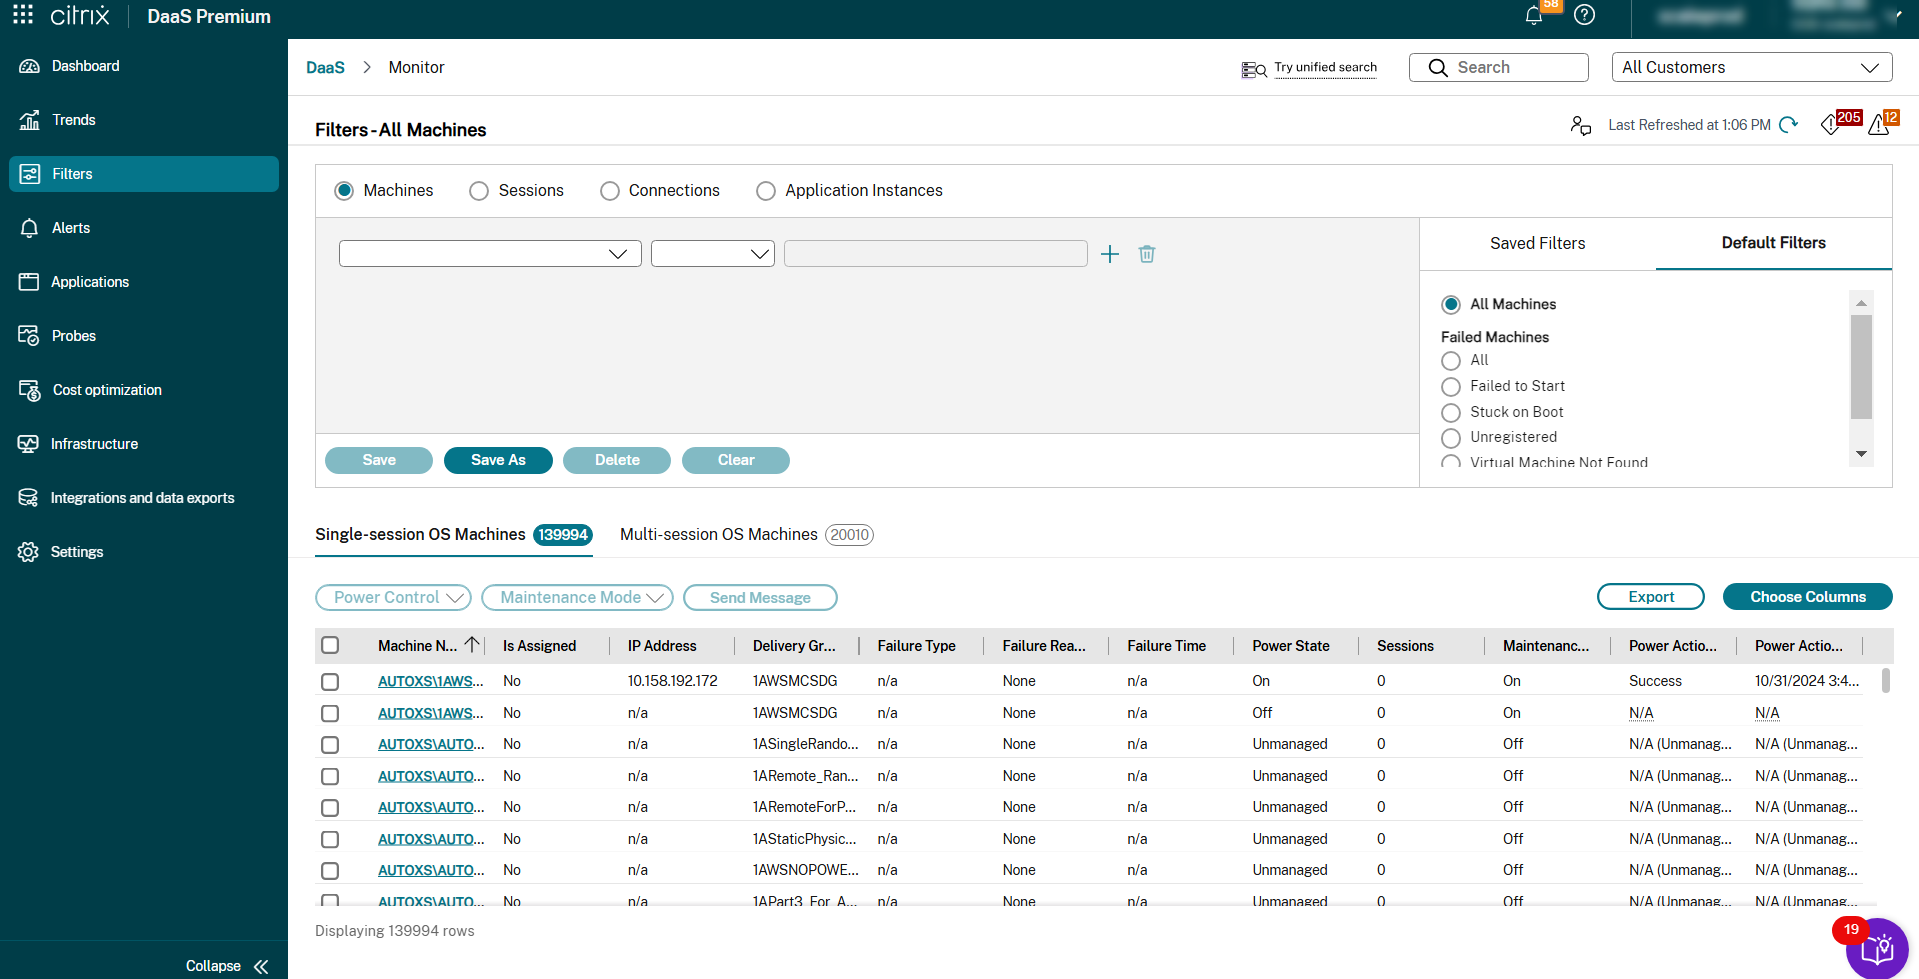
When you click numbers on the Dashboard or select a predefined Default filter from the Filters tab, the Filters view opens to display data based on the selected machine or failure type.
You can create custom-filtered views of machines, connections, sessions, and application instances across all delivery groups and save the search for later access. You can edit a predefined filter and save it as a Saved filter.
-
Select a view:
- Machines. Select Single session OS Machines or Multi-session OS Machines. These views show the number of configured machines. The Multi-session OS Machines tab also includes the load evaluator index, which indicates the distribution of performance counters and tool tips of the session count if you hover over the link.
- Sessions. You can also see the session count from the Sessions view. Use the idle time measurements to identify sessions that are idle beyond a threshold time period. Click the Associated User to open the Activity Manager for the user. Clicking the Endpoint name opens the Activity Manager for the Endpoint. Clicking View Details opens the User Details or Endpoint Details page respectively. For more information, see User Details.
- Connections. Filter connections by different time periods, including last 60 minutes, last 24 hours, or last 7 days. Click the Associated User to open the Activity Manager for the user. Clicking the Endpoint name opens the Activity Manager for the Endpoint. Clicking Machine Names opens the Machine Details page. The Machine Details page lists the machine details, machine utilization, infrastructure details, and applied hotfixes. For more information, see Troubleshoot Machines.
- Application Instances. This view displays the properties of all application instances on VDAs of Multi-session and Single session OS. The session idle time measurements are available for Application instances on VDAs of Multi-session OS.
- Select a filter from the list of Saved or Default filters.
- Use the drop-down lists to select further filter criteria.
- Select extra columns, as needed, to troubleshoot further.
- Save and name your filter.
- To open the filter later, from the Filters view, select View (Machines, Sessions, Connections, or Application Instances), and select the saved filter.
- Click Export to export the data to CSV format files. Data of up to 100,000 records can be exported.
- If needed, for Machines or Connections views, use machine actions for all the machines you select in the filtered list. For the Sessions view, use the session controls or option to send messages.
Note:
-
Run Scripted Task is supported only when the WEM(Workspace Environment Management) service is provisioned and the WEM agent on the VDA is installed and registered with the WEM service.
-
Task History shows only the current user’s Scripted Task executions within the last 24 hours.
-
- If needed, you can use multiple actions. You get a progress bar on the progress of the action. Also, get a message when the action is complete.
- In the Machines and Connections views, click the Failure Reason of a failed machine or connection to get a detailed description of the failure and actions recommended to troubleshoot the failure. The failure reasons and the recommended actions for Machine and Connection failures are available in the Citrix Director Failure Reasons Troubleshooting Guide.
- In the Machines view, click a machine name link to go to the corresponding Machine Details page. This page displays the details of the machine, provides power controls, displays the CPU, memory, disk monitoring, and GPU monitoring graphs. Also, click View Historical Utilization to see the resource utilization trends for the machine. For more information, see Troubleshoot machines.
- In the Application Instances view, sort or filter based on Idle Time greater than a threshold time period. Select the idle application instances to end. Log off or Disconnect of an application instance ends all active application instances in the same session. For more information, see Troubleshoot applications. The Application Instances filter page and idle time measurements in the Sessions filter pages are available if VDAs are version 7.13 or later.
Note:
Studio allows assignment of multiple Desktop Assignment Rules (DAR) for different users or user groups to a single VDA in the delivery group. StoreFront displays the assigned desktop with the corresponding Display Name as per the DAR for the logged in user. However, Monitor does not support DARs and displays the assigned desktop using the delivery group name regardless of the logged in user. As a result, you cannot map a specific desktop to a machine in Monitor. To map the assigned desktop displayed in StoreFront to the delivery group name displayed in Monitor, use the following PowerShell command. Run the PowerShell command using Remote PowerShell SDK as described in the blog.
Get-BrokerDesktopGroup | Where-Object { $\_.Uid -eq (Get-BrokerAssignmentPolicyRule | Where-Object { $\_.PublishedName -eq "\<Name on StoreFront\>" }).DesktopGroupUid } | Select-Object -Property Name, Uid
<!--NeedCopy-->
Unified Communication app metrics
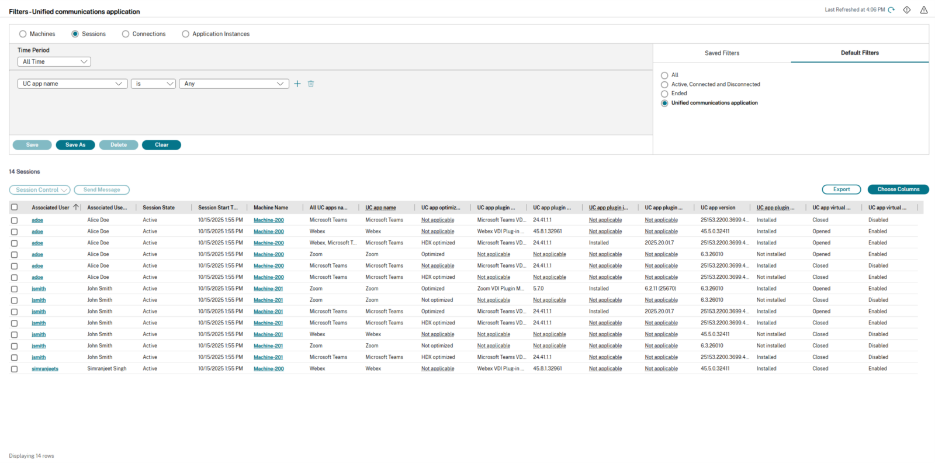
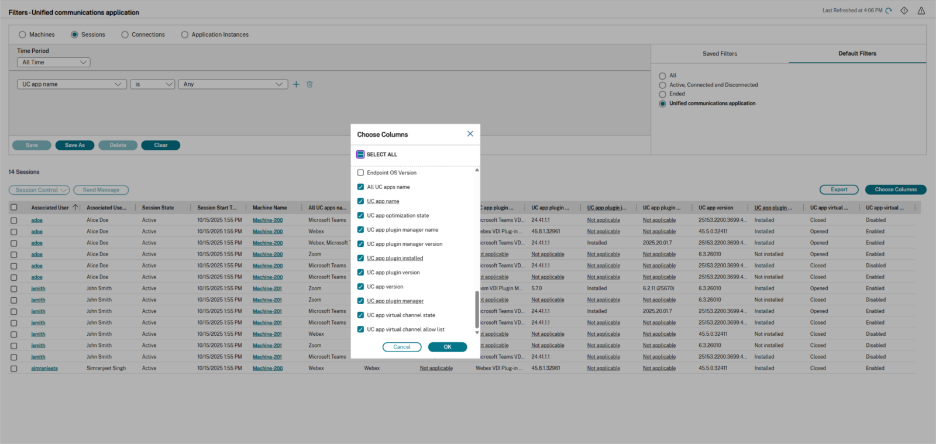
The Sessions view now includes several new display columns that provide detailed insights into Unified Communications (UC) application usage for a user session. These metrics are available in the filter to refine the list of sessions, and they can also be selected via the Choose Columns option to be displayed in the main session table view.
- All UC apps name (Column Only): Contains data listing for all multiple UC applications that were running in the session simultaneously. This is a display column and not a filter option.
- UC app name: The name of the specific Unified Communications application (e.g., Microsoft Teams, Webex, Zoom).
- UC app optimization state: The optimization status of the UC application within the session (e.g., Optimized, HDX optimized, not optimized, not applicable).
- UC app plugin manager name: The name of the plugin manager used for the UC application.
- UC app plugin manager version: The version of the plugin manager being used.
- UC app plugin installed: Indicates whether the necessary application plugin is Installed or Not installed for the UC application.
- UC app plugin version: The version of the specific UC application plugin.
- UC app version: The overall version of the Unified Communications application.
- UC app plugin manager: Indicates whether the necessary application plugin manager is Installed or Not installed on the endpoint for the UC application.
- UC app virtual channel state: The status of the virtual channel established for the UC application (e.g., Opened, Closed).
- UC app virtual channel allow list: Indicates if the application’s virtual channel is on the allowed list.