Monitor Autoscale-managed machines
Autoscale is a power management feature that enables proactive power management of all registered Multi-session and Single session OS machines in a delivery group. You can configure Autoscale for a selected delivery group from the Manage tab. For more information, see Autoscale. You can monitor the key metrics of Autoscale enabled machines from the Monitor console.
Machine Usage
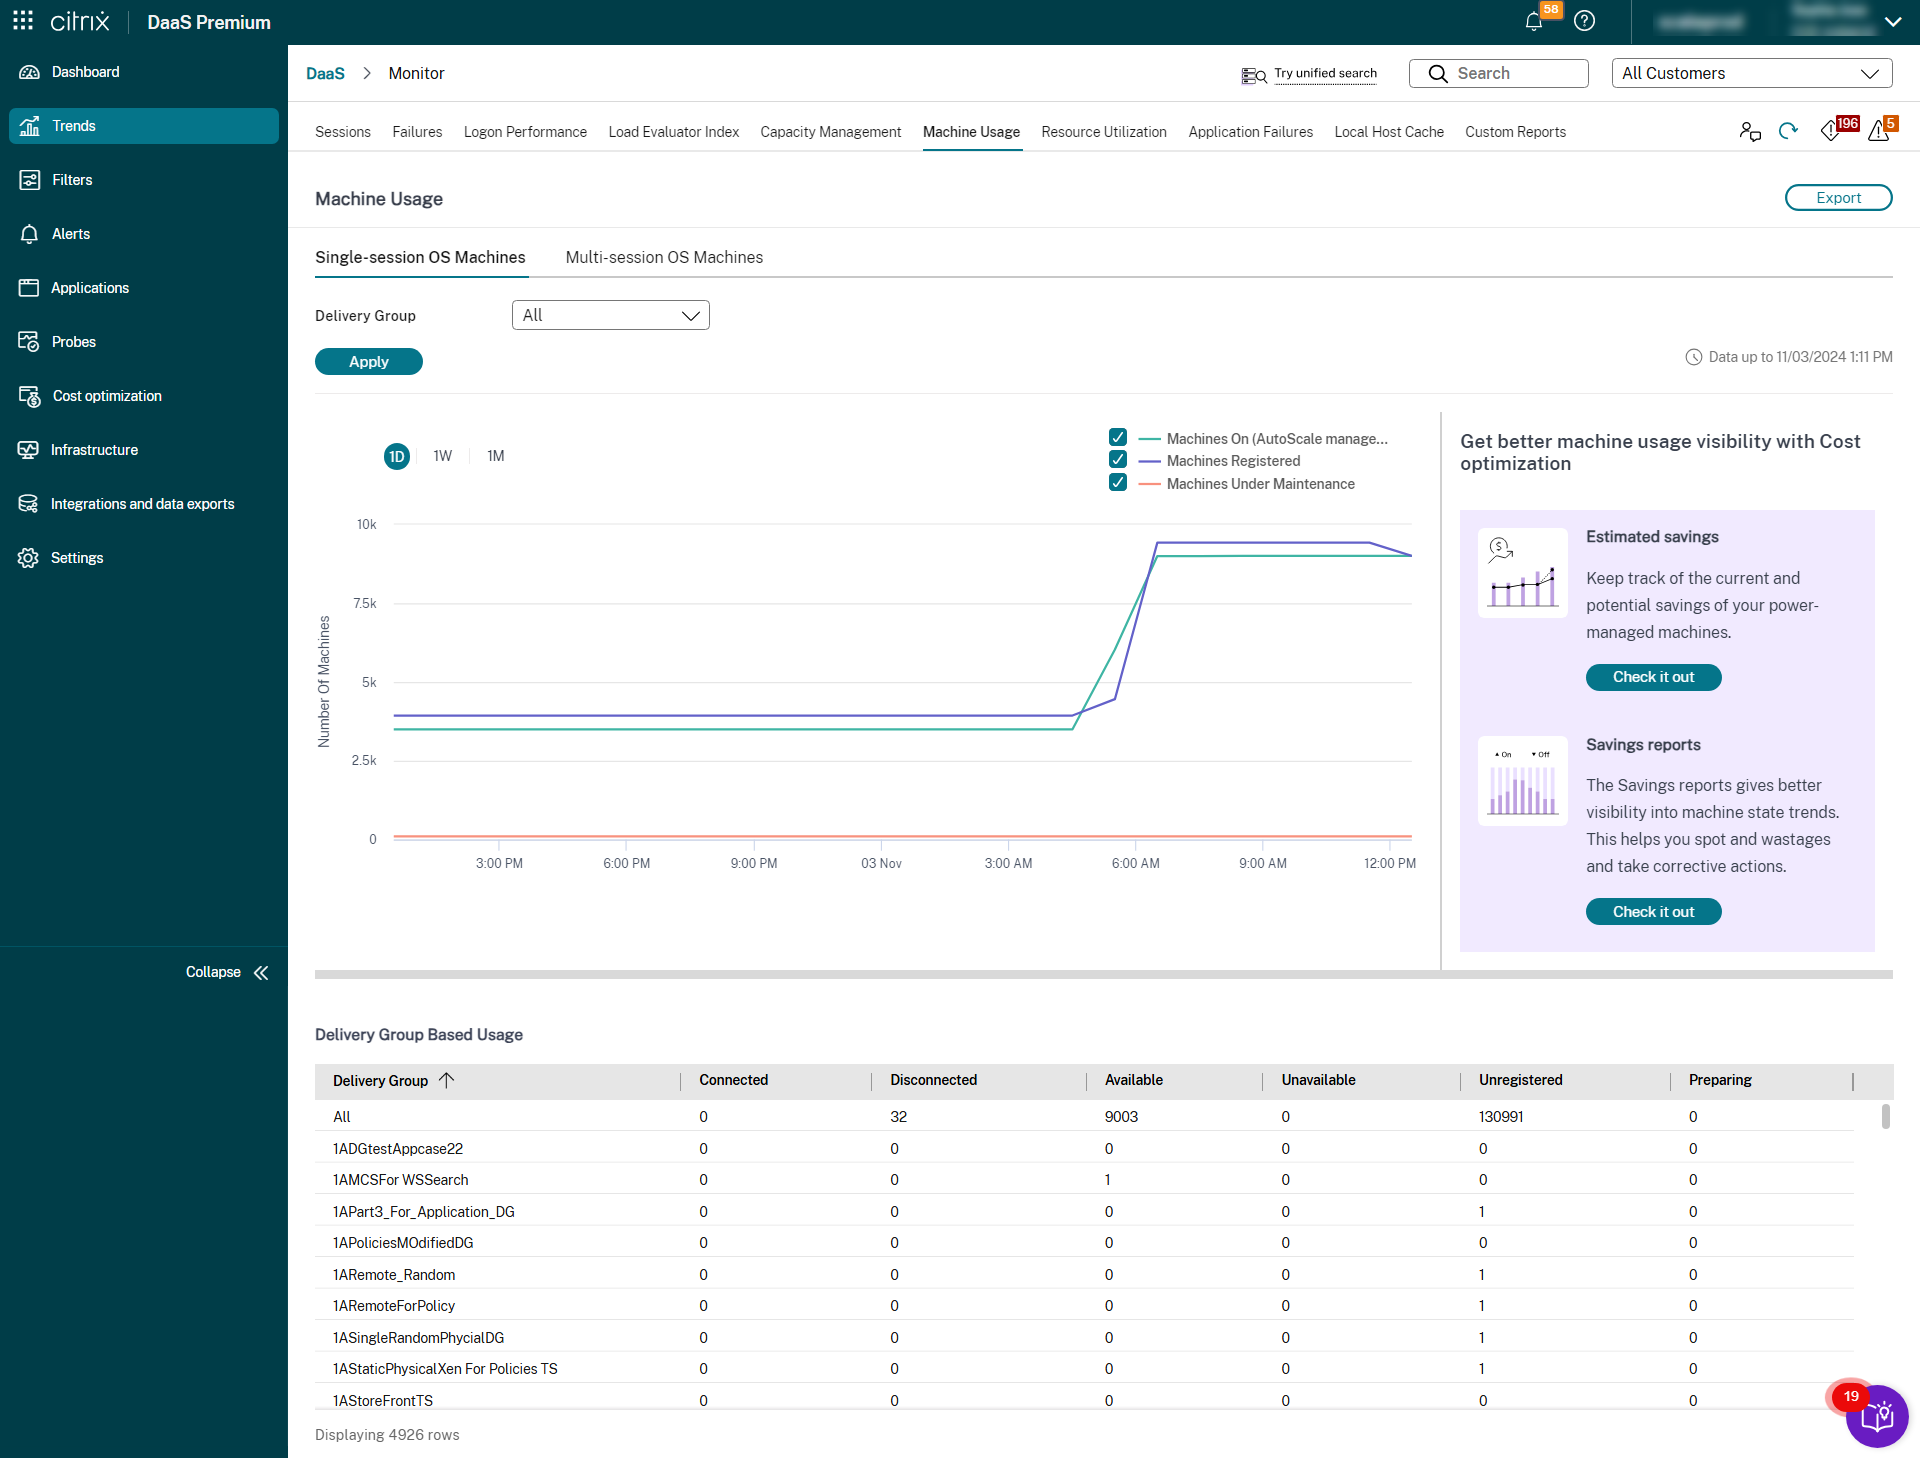
The Monitor > Trends > Machine Usage page displays the total number of Autoscale enabled Multi-session and Single session OS machines that are powered on for a selected delivery group and time period. This metric indicates the actual usage of machines in the delivery group. From the Single session OS Machines or the Multi-session OS Machines tab, select the Delivery group and the time period.

The chart plots the following metrics:
- Machines On - the number of Autoscale enabled machines that are powered on
- Machines Registered - the number of registered Multi-session or Single session OS machines
- Machines under Maintenance - the number of Multi-session or Single session OS machines with maintenance mode switched on
Estimated Savings
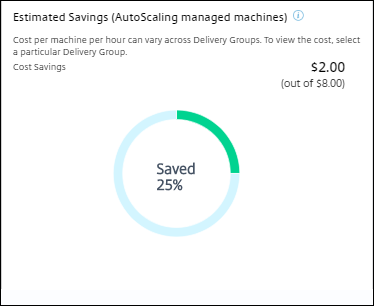
The Monitor > Trends > Machine Usage page also displays the estimated cost savings achieved by enabling Autoscale in the selected delivery group.

Estimated Savings is calculated as the percentage of savings per machine per hour (in US $) as configured in Manage > Edit Delivery Group > Autoscale. For more information about configuring the savings per machine, see Autoscale.
When you select all Delivery groups, the average value of Estimated Savings across all the delivery groups is displayed. The estimated savings help administrators consolidate the existing infrastructure and plan the capacity to achieve maximum savings and utilization.
Alert notifications for machines and sessions
The Monitor Dashboard displays alert notifications that can be further drilled down. Alert details are displayed on the Monitor > Alerts page.
- To create an alert policy in a delivery group, go to Monitor > Alerts > Citrix Alerts Policy > Delivery Group Policy.
- Here, you can set the following Warning and Critical thresholds:
- Failed Machines (Single session OS) and Failed Machines (Multi-session OS),
- Peak Connected Sessions, Peak Disconnected Sessions and Peak Concurrent Total Sessions in the delivery group.
- Alerts are generated when the corresponding metric in the delivery group reaches the threshold.
For more details regarding the alert policy conditions and creation of new alert policies, see Alerts and notifications.
Machine status
- Monitor > Filters > Machines displays the power state of all machines in a tabular format. You can filter by a specific delivery group.
- Monitor > Filters > Sessions displays filter by the Machine name to see the associated sessions and their real-time status.
- In Monitor > Trends > Sessions, select your delivery group and time period to see the trend of the sessions and their associated metrics.
For more information, see Filter data to troubleshoot failures.
Load Evaluation trends
The Monitor > Trends > Load Evaluator Index page displays a graph with detailed information about the load that is distributed among the Multi-session OS machines. The filter options for this graph include the delivery group or Multi-session OS machine in a delivery group, Multi-session OS machine (available only if Multi-session OS machine in a delivery group was selected), and range. The Load Evaluator Index is displayed as percentages of Total CPU, Memory, Disk, or Sessions and is shown in comparison with the number of connected users in the last interval.