Troubleshoot applications
Application Analytics
The Applications view displays application-based analytics in a single, consolidated view to help analyze and manage application performance efficiently. You can gain valuable insight into the health and usage information of all applications published on the site. The default view helps identify the top running applications. This feature requires VDAs Version 7.15 or later.
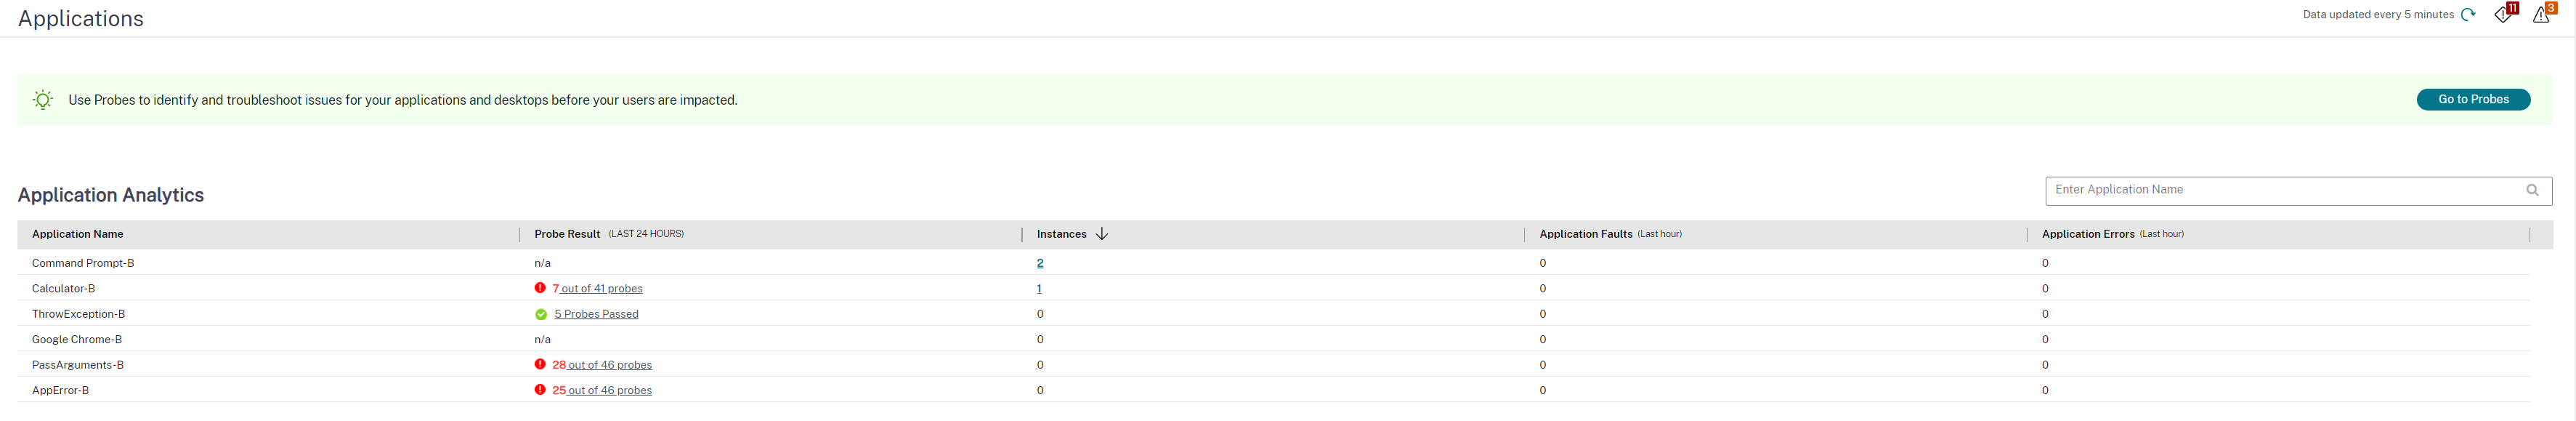
The Instances column displays usage of the applications. It indicates the number of application instances currently running (both connected and disconnected instances). To troubleshoot further, click the Instances field to see the corresponding Application Instances filters page. Here, you can select application instances to log off or disconnect.
Note:
For custom scope administrators, Monitor does not display application instances created under application groups. To view all application instances, you must be a full administrator. For more information, see Knowledge Center article CTX256001.
Monitor the health of published applications in your site with the Application Faults and the Application Errors columns. These columns display the aggregated number of faults and errors that have occurred while launching the corresponding application in the last one hour. Click the Application Faults or Application Errors field to see failure details on the Trends > Application Failures page corresponding to the selected application.
The application failure policy settings govern the availability and display of faults and errors. For more information about the policies and how to modify them, see Policies for application failure monitoring in Monitoring policy settings.
Real-time application monitoring
You can troubleshoot applications and sessions by using the idle time metric to identify instances that are idle beyond a specific time limit.
Typical use cases for application-based troubleshooting are in the healthcare sector, where employees share application licenses. There, you must end idle sessions and application instances to purge the Citrix Virtual Apps and Desktops™ environment, to reconfigure poorly performing servers, or to maintain and upgrade applications.
The Application Instances filter page lists all application instances on VDAs of Multi-session and Single session OS. The associated idle time measurements are displayed for application instances on VDAs of Multi-session OS that have been idle for at least 10 minutes.
Note:
The Application Instances metrics are available on sites of all license editions.
Use this information to identify the application instances that are idle beyond a specific time period and log off or disconnect them as appropriate. To do this, select Filters > Application Instances and select a pre-saved filter or choose All Application Instances and create your own filter.
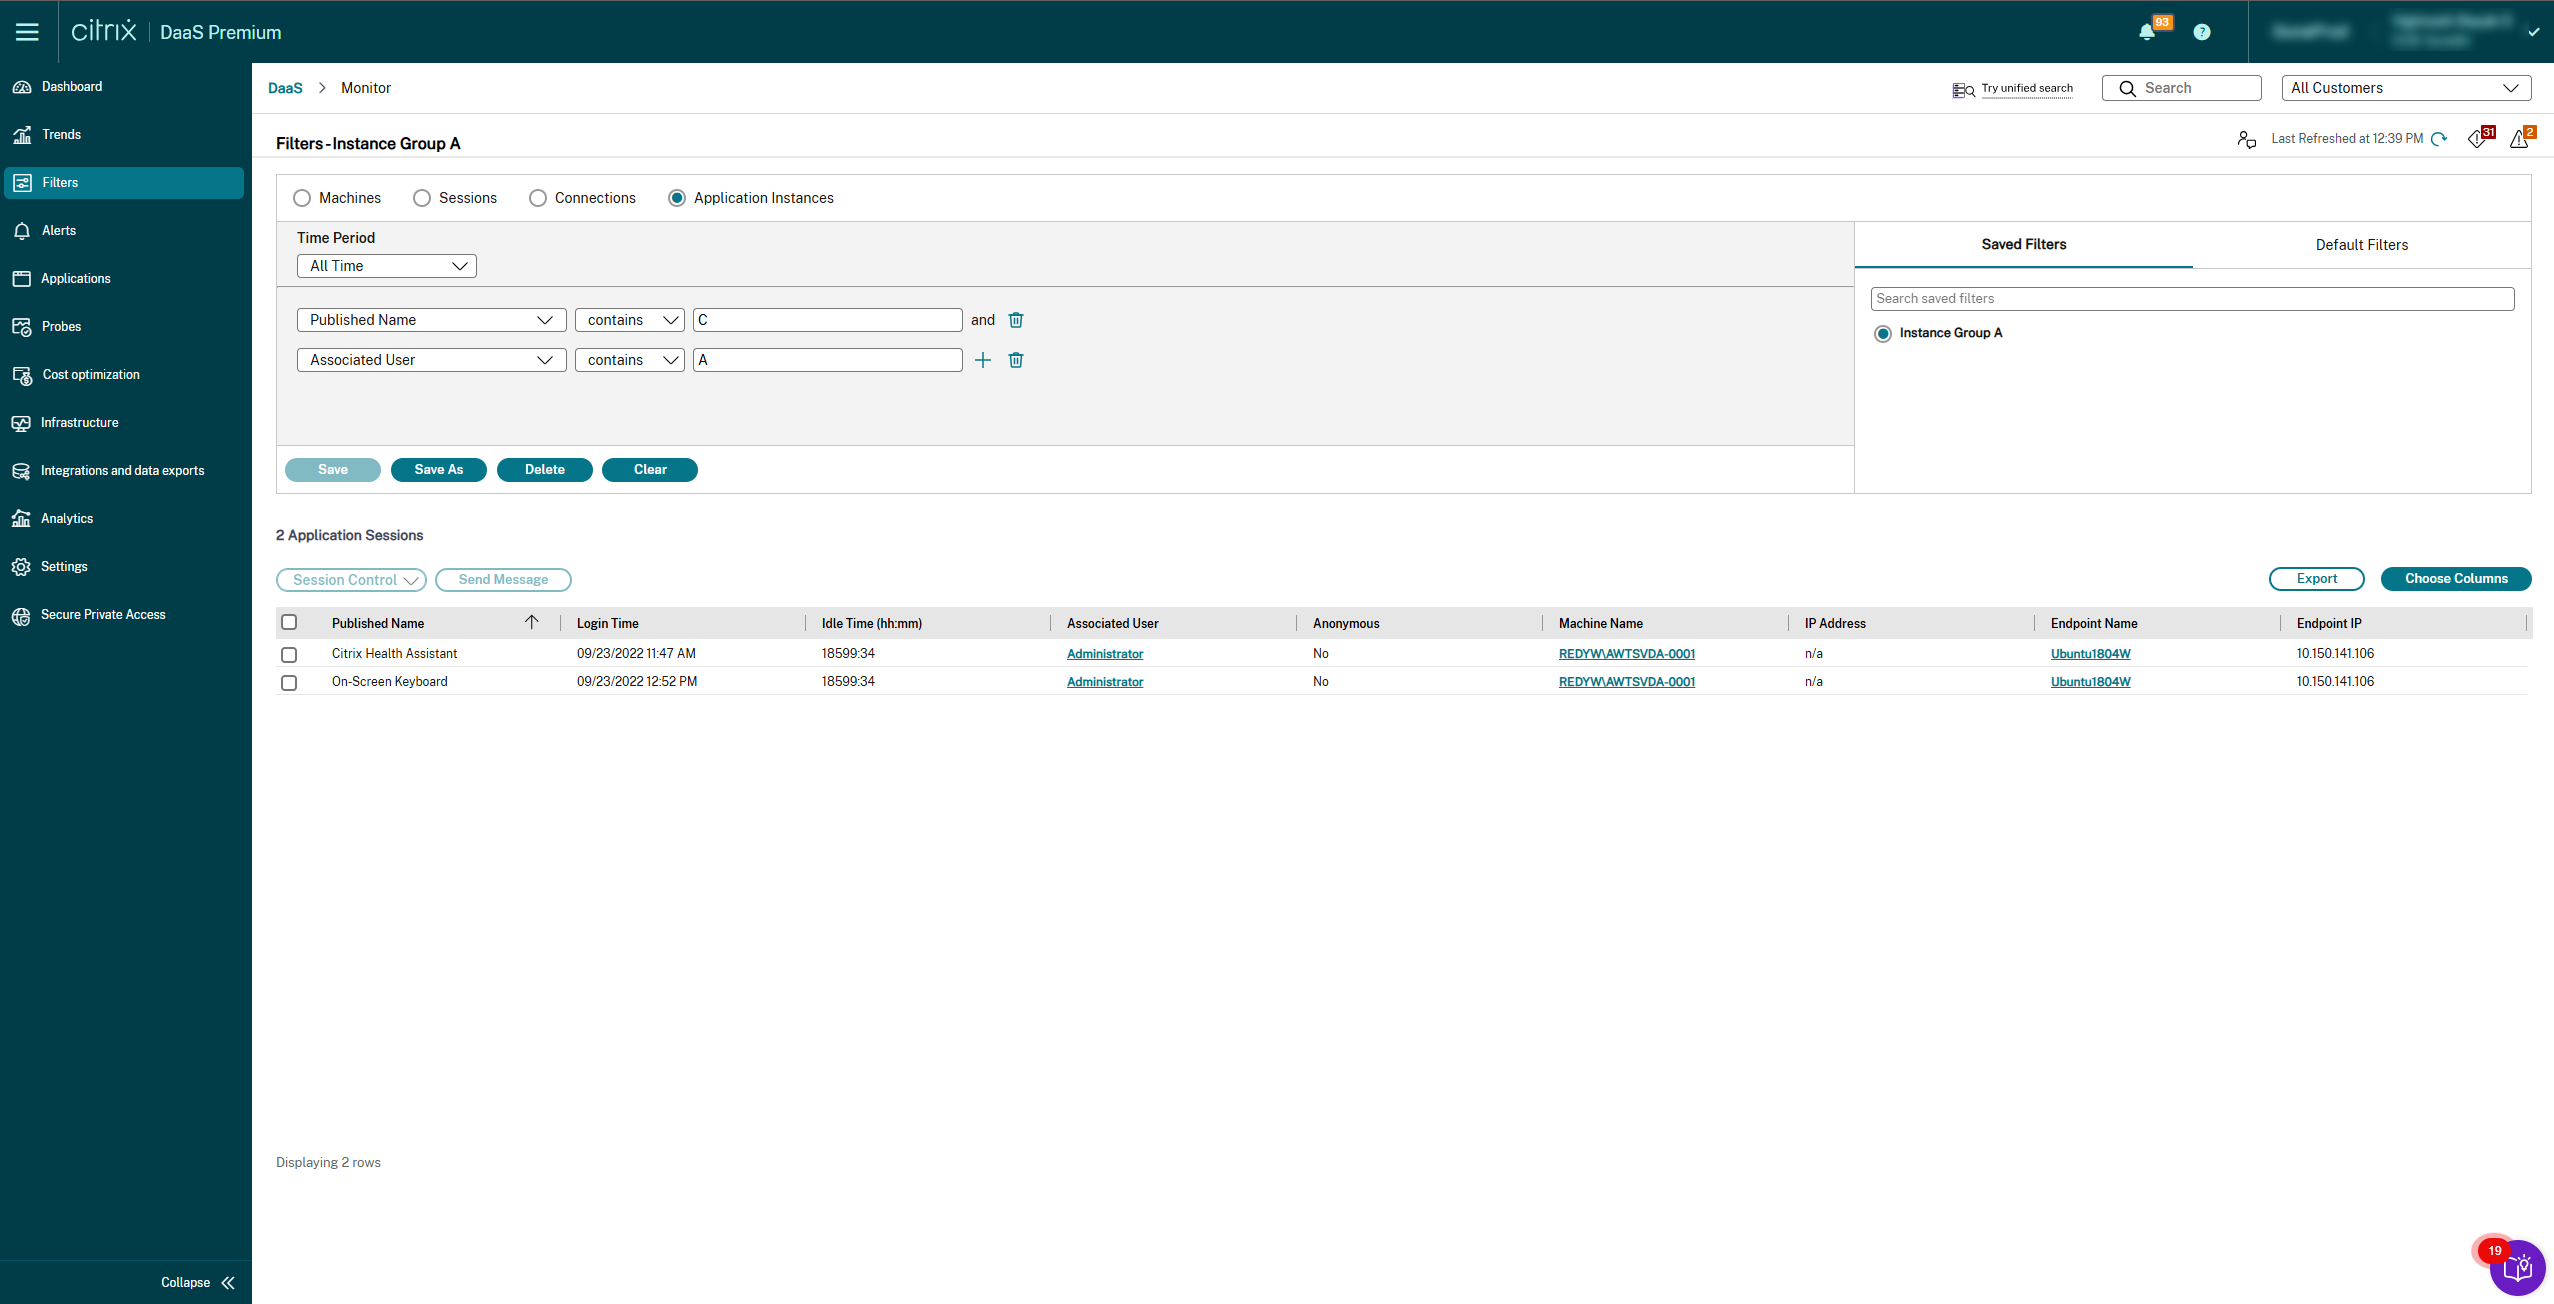
An example of a filter would be as follows. As Filter by criteria, choose Published Name (of the application) and Idle Time. Then, set Idle Time to greater than or equal to a specific time limit and save the filter for reuse. From the filtered list, select the application instances. Select option to send messages or from the Session Control drop-down, choose Logoff or Disconnect to end the instances.
Note:
Logging off or disconnecting an application instance logs off or disconnects the current session, thereby ending all application instances that belong to the same session.
You can identify idle sessions from the Sessions filter page using the session state and the session idle time metric. Sort by the Idle Time column or define a filter to identify sessions that are idle beyond a specific time limit. Idle time is listed for sessions on VDAs of Multi-session OS that have been idle for at least 10 minutes.
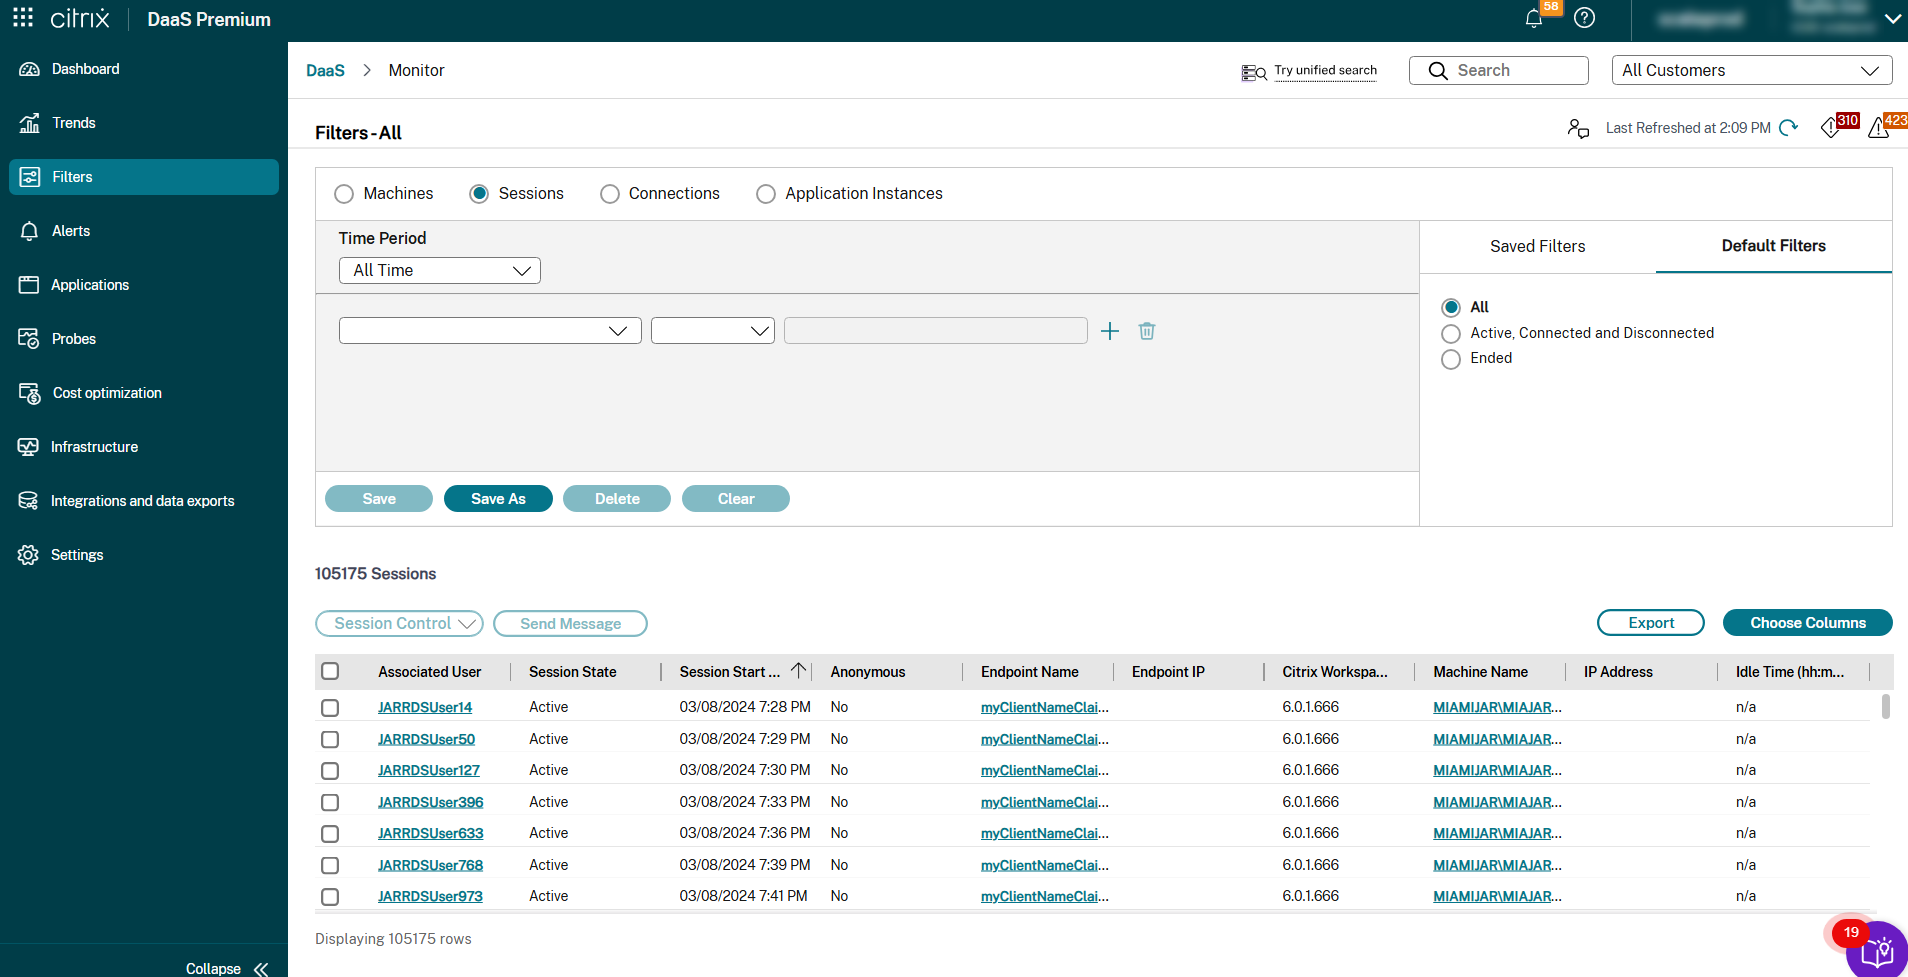
The Idle time is displayed as N/A when the session or application instance
- has not been idle for more than 10 minutes,
- is launched on a VDA of Single session OS, or
- is launched on a VDA running Version 7.12 or earlier.
Historical application failure monitoring
The Trends -> Application Failures tab displays failures associated with the published applications on the VDAs.
For more information about the availability of the application failure trends, see Data granularity and retention article. The application failures that are logged to the Event Viewer with source “Application Errors” are monitored. Click Export to generate reports in CSV, Excel, or PDF formats
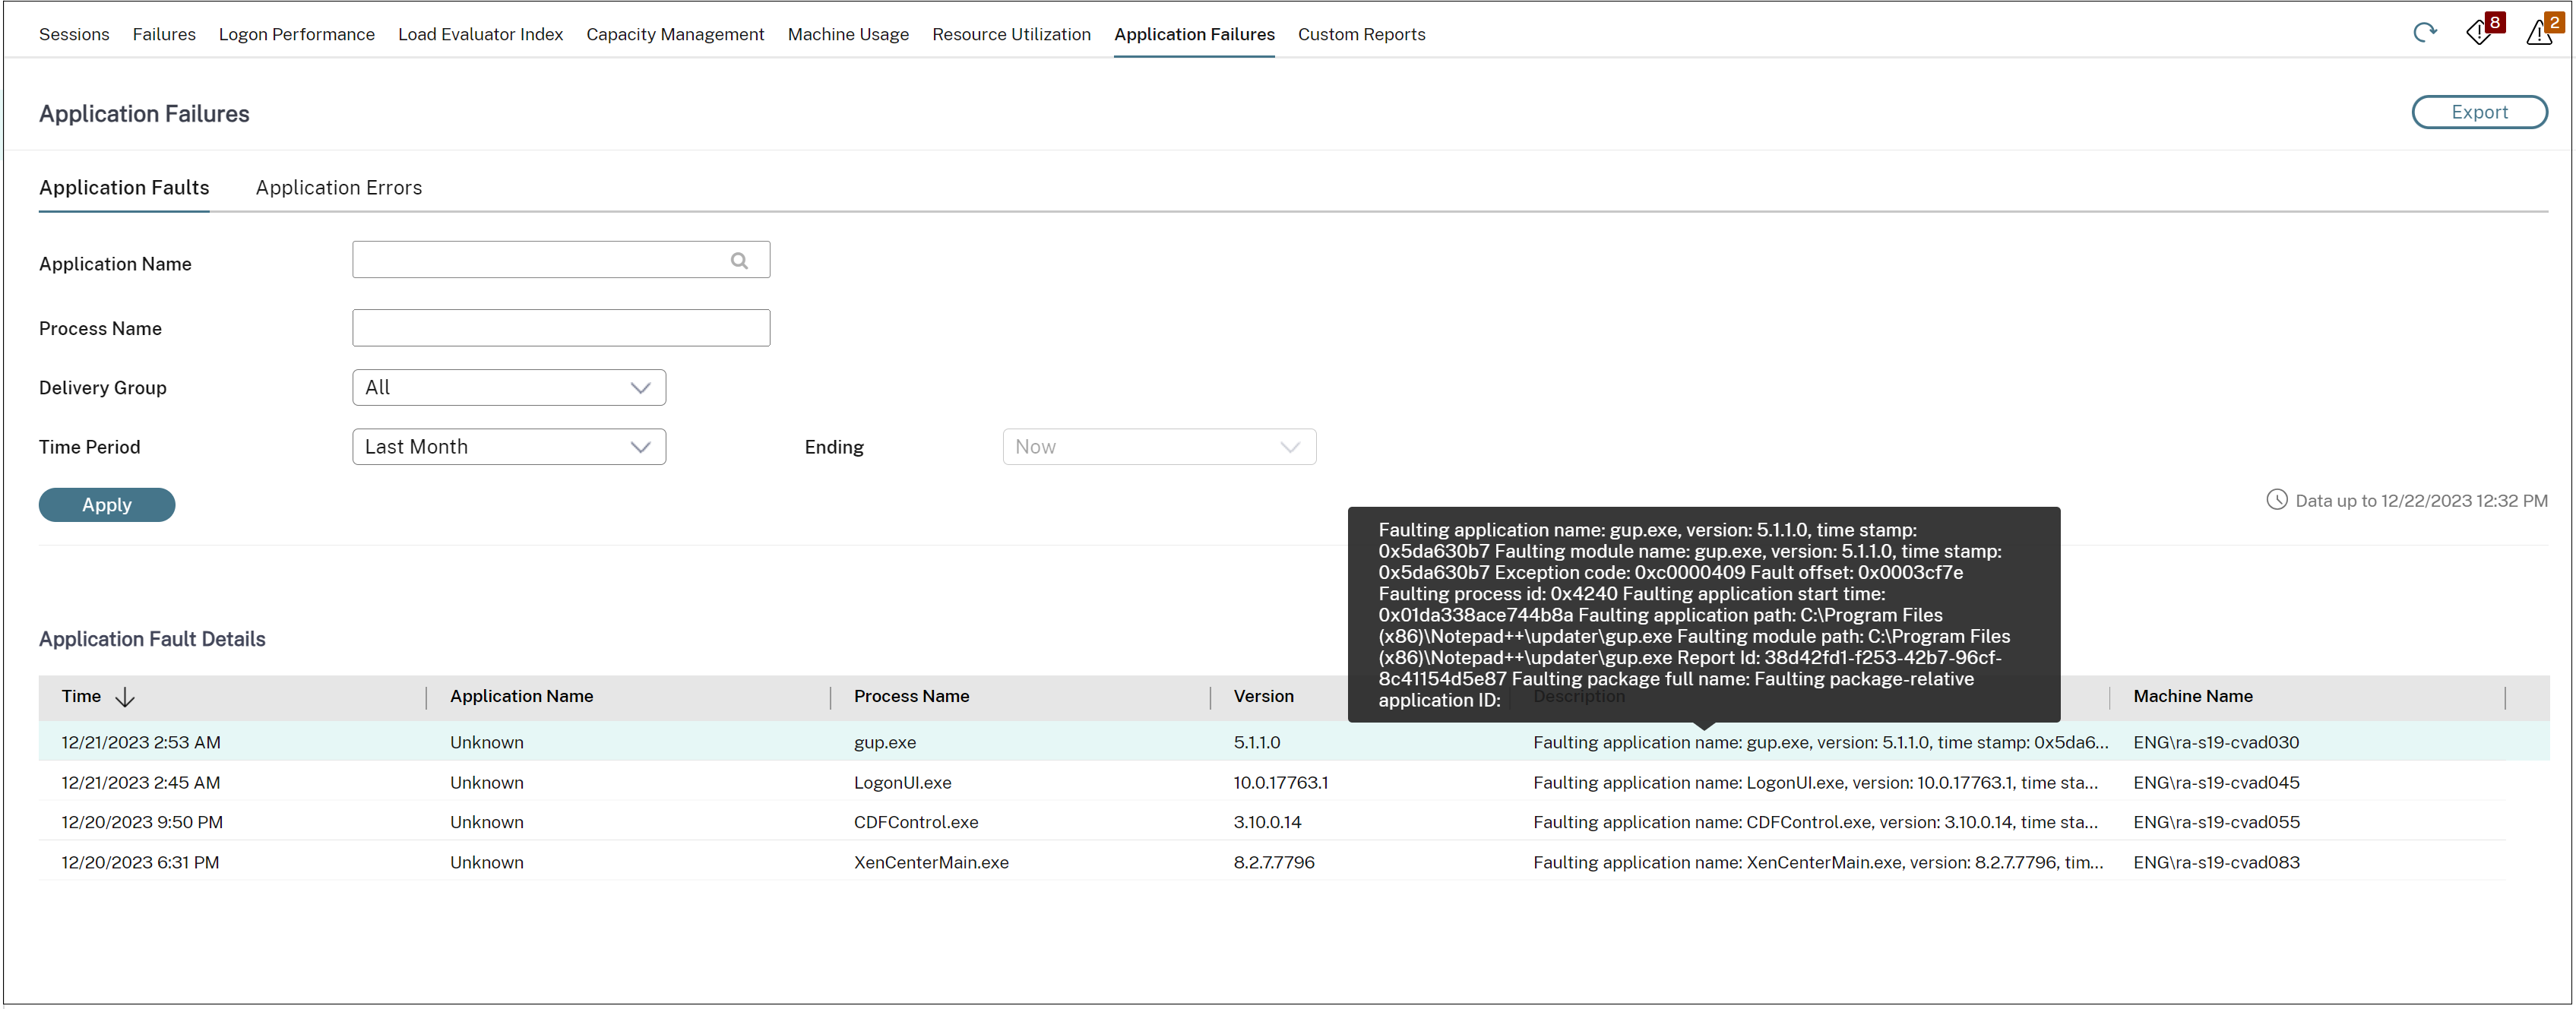
The failures are displayed as Application Faults or Application Errors based on their severity. The Application Faults tab displays failures associated with loss of functionality or data. Application Errors indicate problems that are not immediately relevant; they signify conditions that might cause future problems.
You can filter the failures based on Published Application Name, Process Name or Delivery Group, and Time Period. The table displays the fault or error code and a brief description of the failure. The detailed failure description is displayed as a tooltip.
Note:
The Published Application name is displayed as “Unknown” when the corresponding application name cannot be derived. This typically occurs when a launched application fails in a desktop session or when it fails due to an unhandled exception caused by a dependent executable.
By default, only faults of applications hosted on Multi-session OS VDAs are monitored. You can modify the monitoring settings through the Monitoring Group Policies: Enable monitoring of application failures, Enable monitoring of application failures on Single session OS VDAs, and List of applications excluded from failure monitoring. For more information, see Policies for application failure monitoring in Monitoring policy settings.