Machine Statistics
The Machine statistics page provides a comprehensive view of resource consumption and session experience on the selected machine during the last 24 hours. This information helps administrators correlate high CPU or memory usage occurrences with session failures and experience across the machines in their Apps and Desktops environment. Administrators can view the processes contributing to high resource consumption and get a timeline view of the machine states. This feature helps slice and dice important parameters concerning the machines in the environment and spot inefficiencies easily.
Accessing the Machine statistics page
Click the machine name link from the Self-service view for Machines.
Using the Machine statistics page
The Machine Statistics page displays the machine and session performance statistics in the same view. This view helps analyze machine resources, their usage pattern, and understand if machine resources might have been the bottleneck for poor performance.
The Machine Statistics page displays data for the last 24 hours, by default. However, data is available for the last 14 days. To choose a different 24 hour period, use the calendar. Data is displayed for the last 24 hours from the time that you choose.
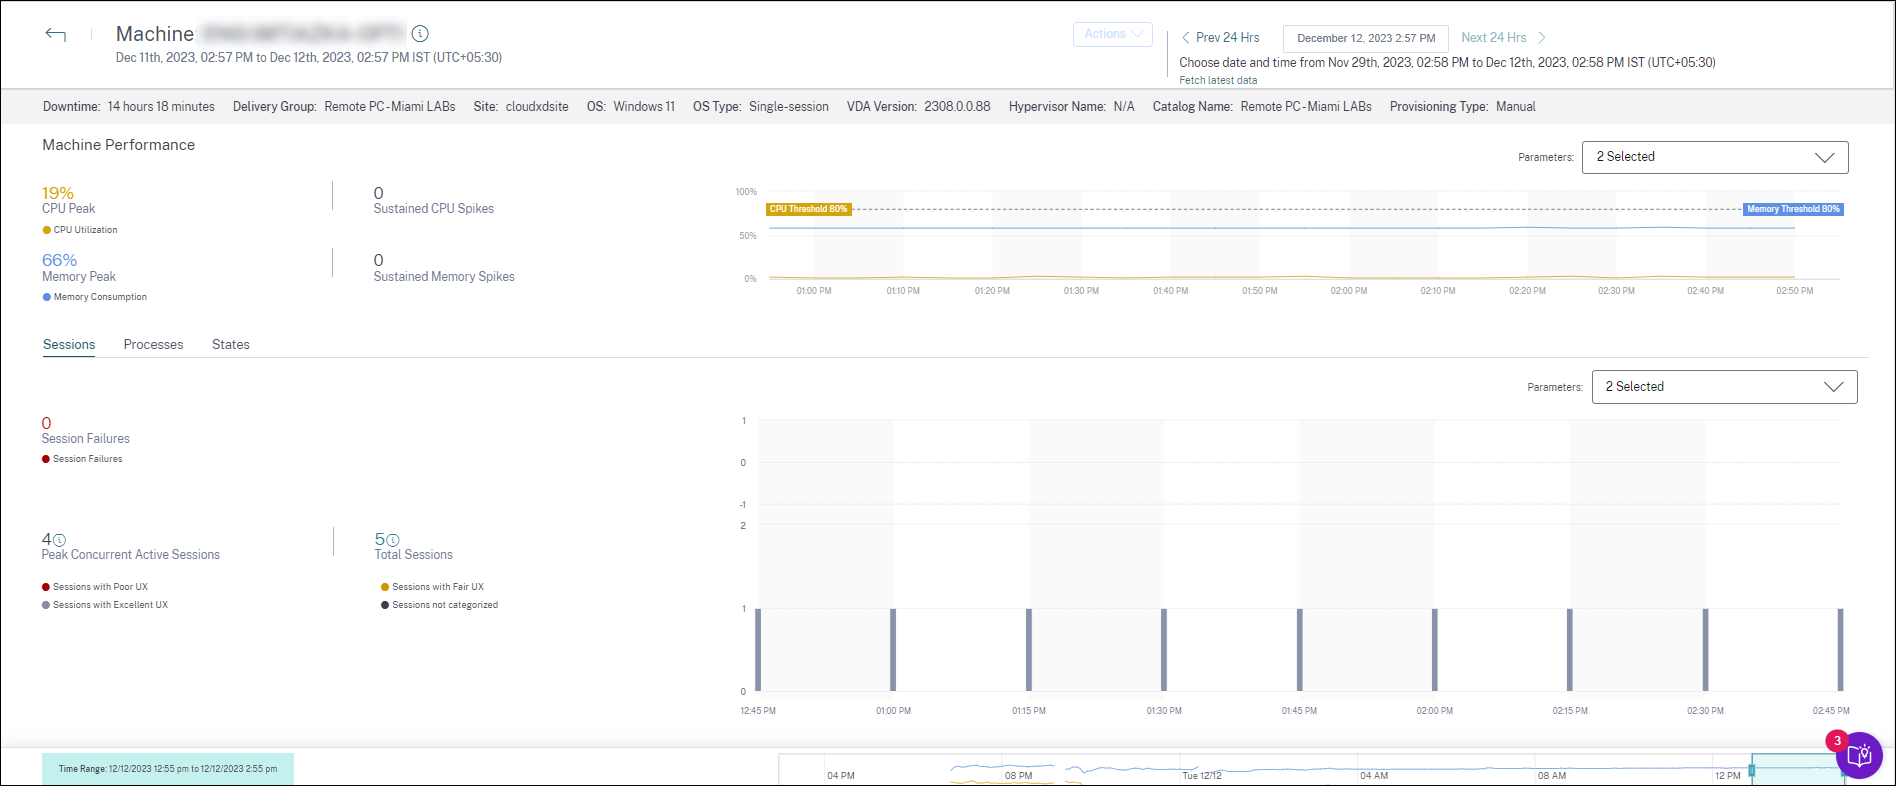
Machine attributes
Key machine attributes are displayed.
- Delivery Group, Site, OS type, OS, VDA version, Hypervisor, Catalog, and Provisioning type of the machine are displayed.
- Downtime shows the period in seconds during which the machine was in
Unregistered,Failed, orPowered offstate in the last 24 hours.
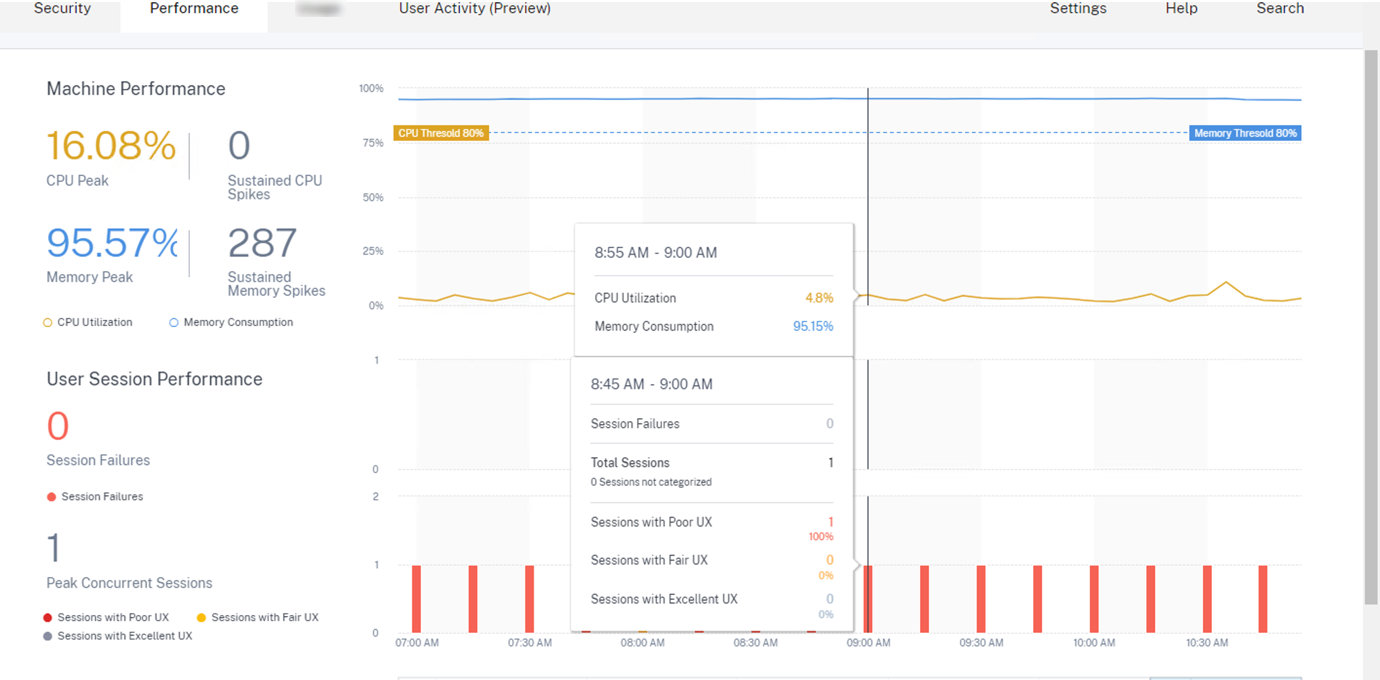
Machine Performance statistics
Key metrics that define the machine performance are displayed.
- CPU Peak represents the maximum CPU utilization in the machine in the last 24 hrs.
- Sustained CPU Spikes represents the number of times CPU utilization crossed the CPU threshold of 80% and sustained for 5 minutes or more.
- Memory Peak represents the maximum memory consumption in the last 24 hrs.
- Sustained Memory Spikes represents the number of times memory consumption crossed the memory threshold of 80% and sustained for 5 minutes or more.
- The Machine Performance trend for a default 4 hour window in the last 24 hours shows CPU utilization and memory consumption plotted at 5 min granularity.
Session Performance Statistics
Key session performance related metrics are displayed.
- Session Failures that occurred on the machine over the last 24 hours.
- Session Failure trend displays the session failures count plotted for a default 4 hour window in the last 24 hours.
- Peak Concurrent Active Sessions represents the maximum number of concurrent sessions that were established on the machine over the past 24 hours.
- Total Sessions represents the total number of sessions that were active during the selected time period on the machine. Clicking the Total Sessions number opens the Sessions self-service view with the corresponding set of sessions displayed. You can further drilldown and inspect the session metrics from the Session Details view.
- The User Session Performance trend shows the classification of sessions based on session experience as Excellent, Fair, or Poor, plotted for a default 4-hour window in the last 24 hours.
You can click the Session Failure number, the bars in the chart displaying the session failures, and the categorized session counts to view the sessions in the Sessions self-service view.
Machine Statistics a comprehensive view displaying all machine-related metrics required to triage and fix issues related to the machine and the sessions running on the machine.
Top resource consuming processes
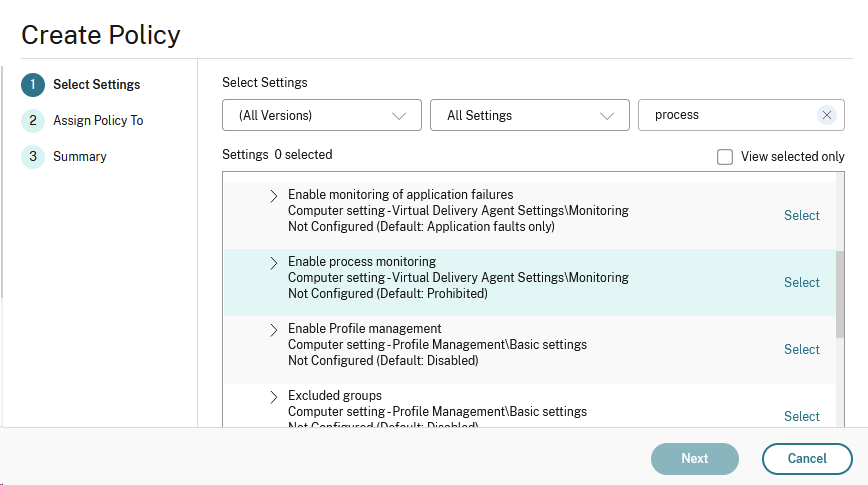
Click the Processes tab to gain visibility into the high resource consuming processes running on the machine in the selected time period. You must enable the Process Monitoring policy from Citrix Studio to see this information. This feature is available multi-session and single-session OS machines on cloud and on-premises sites.
You can choose to view the processes ranked as per CPU Utilization or Memory Consumption.
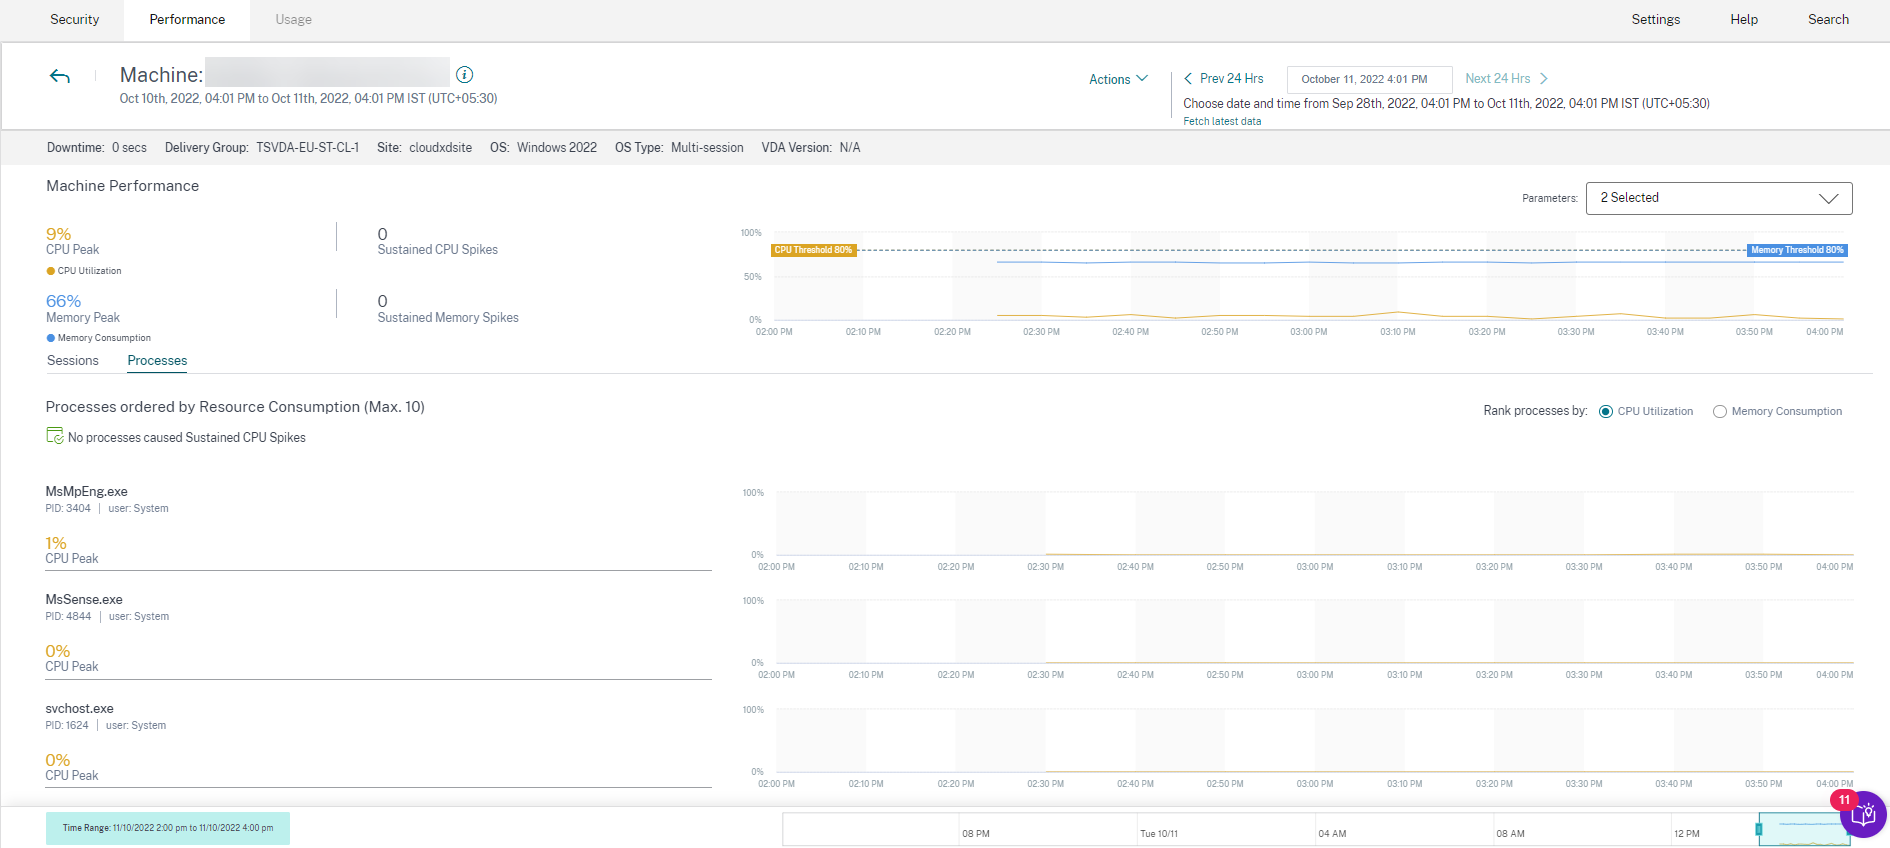
Up to 10 Most Resource Consuming Processes are displayed with percentage CPU or Memory Peak as selected. These are processes that caused sustained CPU or Memory spikes coinciding with high resource consumption on the corresponding machine. The top resource consuming processes are displayed even if there are no memory or CPU spikes during the selected time period. The charts plot CPU Utilization or Memory Consumption by the process across the selected time period. This helps correlate resource consumption by the processes with session failures on the machine. Process visibility is available for multi-session OS machines and single-session OS machines on cloud and on-premises sites. This feature requires that you enable the Process Monitoring policy from Citrix Studio. This policy is disabled by default. You must enable it explicitly to view the processes running on the machine in Performance Analytics.
For more information, see Monitoring policy settings
Note:
In the case of on-premises sites, machines running Citrix Virtual Apps and Desktops™ Version 2203 and later are supported.
It is recommended that you enable process data to Citrix Analytics for Performance only and you enable process data to Director only if needed. For more information about the approximate storage consumption if you choose to enable process data flow to Director, see Process Data.
Use the following PowerShell cmdlet to control the flow of process data.
- To enable process data flow only to Citrix Analytics for Performance™ and not to Director (recommended)
Set-MonitorConfiguration SendProcessDataToCASAndSkipDatabase $trueTo enable process data flow to both Citrix Analytics for Performance and Director.
Set-MonitorConfiguration -SendProcessDataToCASAndDatabase $true
Machine State Visibility
The Machine Statistics page now includes information on Machine States. The States tab shows the timeline of Machine Aggregated State and Machine Power Category for the last 24 hours. The plotting is done at 15 min intervals. This feature helps slice and dice important parameters concerning the machines in the environment and spot inefficiencies easily.
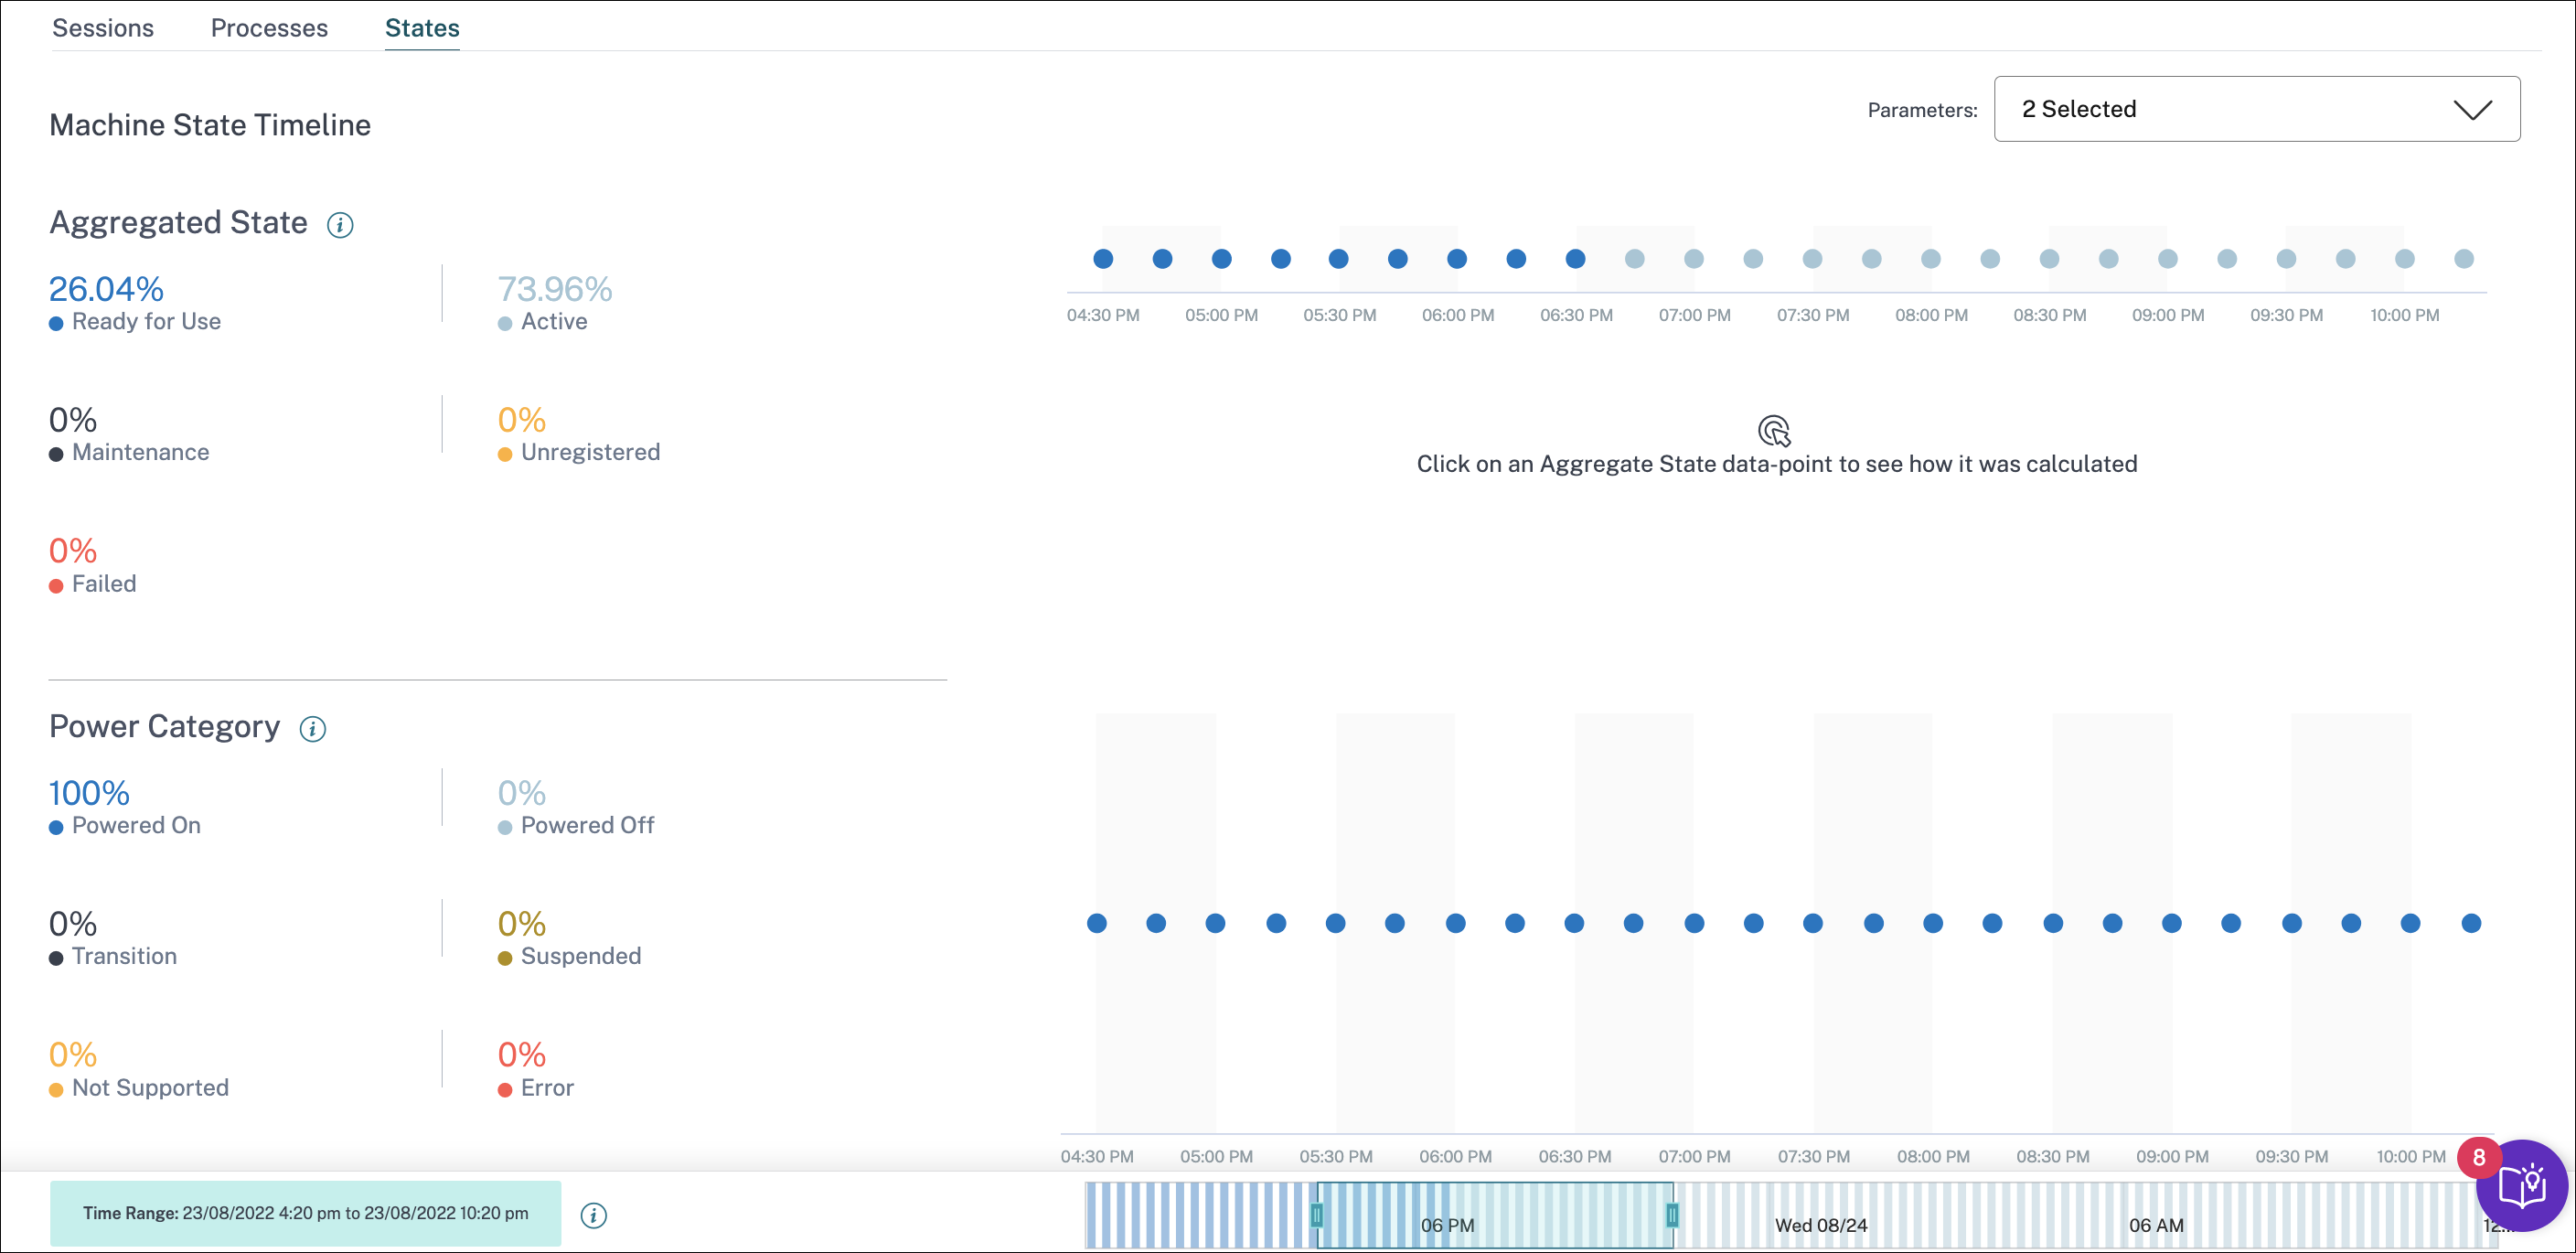
Click an Aggregated State data point to see how it was calculated. A breakdown of the actual values of Machine State and Maintenance Mode that resulted in the plotted Aggregated State is displayed. This helps comprehend the machine’s state changes over time. Failure Type and Deregistration Reason help debug machine issues. Hover over the Power Category data point to see the actual Power State that the machine has been in.
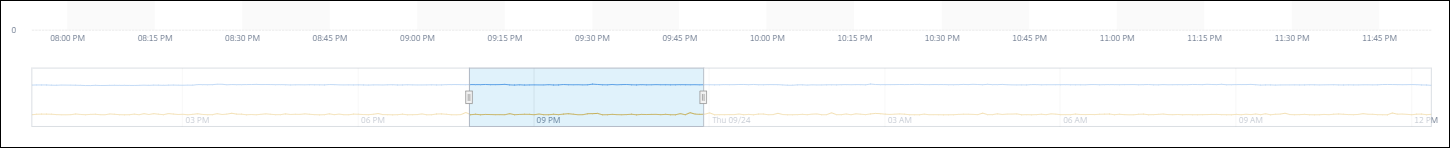
Time navigation bar
The Time navigation bar has the following charts plotted for a default 4-hour window:
- The Machine and User Session Performance trends are plotted when you are in the Sessions or Processes tab
- The Machine Aggregated State trend is plotted when you are in the States tab.
This helps get an overview of the trend and then zoom in to the interested time range. To view data corresponding to any other window in the 24-hour range, move the time navigation bars and choose a different time range. You can zoom in or out in a 2–8 hour window, to view the events corresponding to the selected time range.
Usage Notes
- Machine downtime might cause disrupted plotting of the Machine Performance trend.
- If machines in your on-premises Virtual Apps and Desktops environment were added to the machine catalog before the site was onboarded to Performance Analytics, the OS information of the machine might not be available in the Machine Statistics view. As a workaround, add the machines to the machine catalog after the onboarding the site.
- Statistics of machines in your on-premises Virtual Apps and Desktops environment are available (up to) 24 hours after the onboarding to Performance Analytics has been initiated.
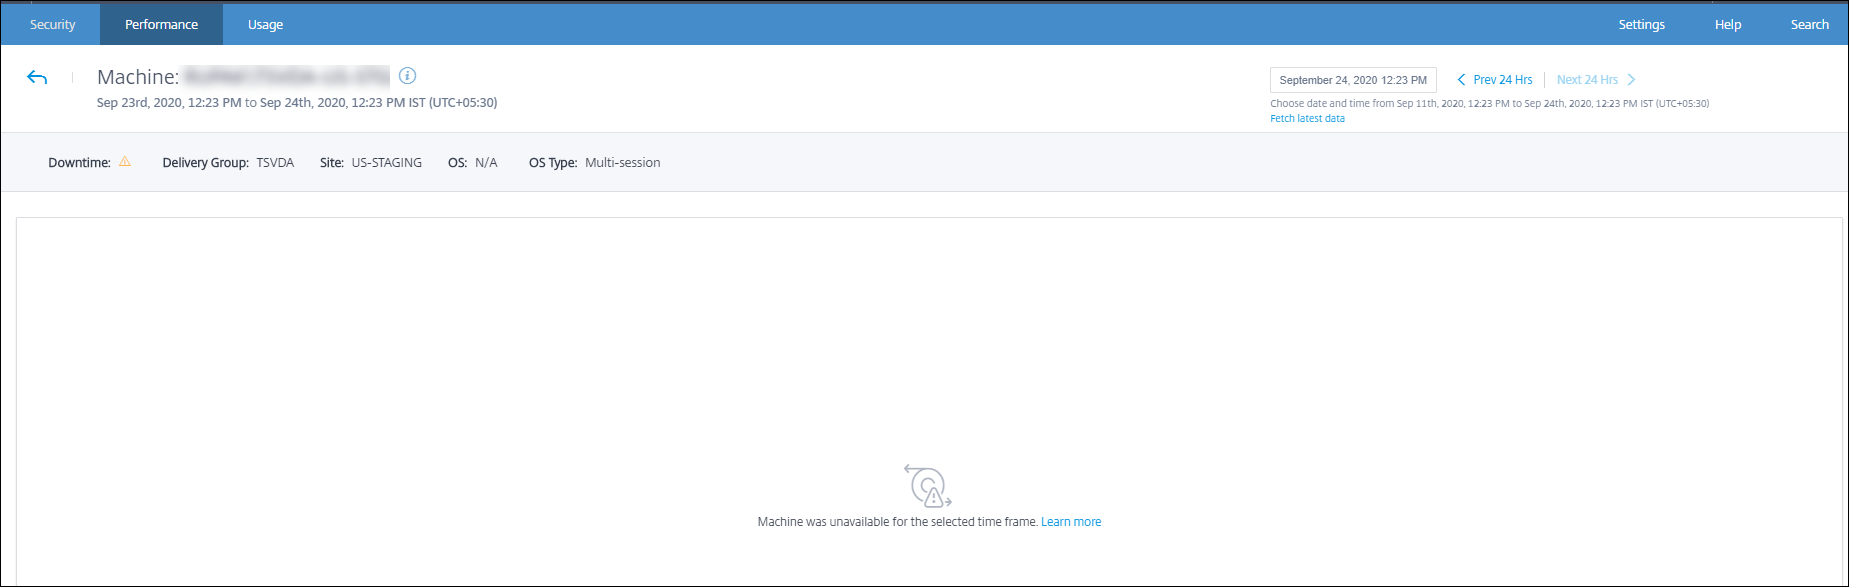
- The Machine Performance trend is not available for the duration when the machine was in
Unregistered,Failed,Powered offstatus, or if it was deleted from the Delivery Group. Statistics are available only for the period when the machine was available. - To determine why a machine was not in the
Activeor theReady for Usestate, click the dotted chart of the Machine Aggregated State trend in the State tab.
Typical use case for Machine Statistics view
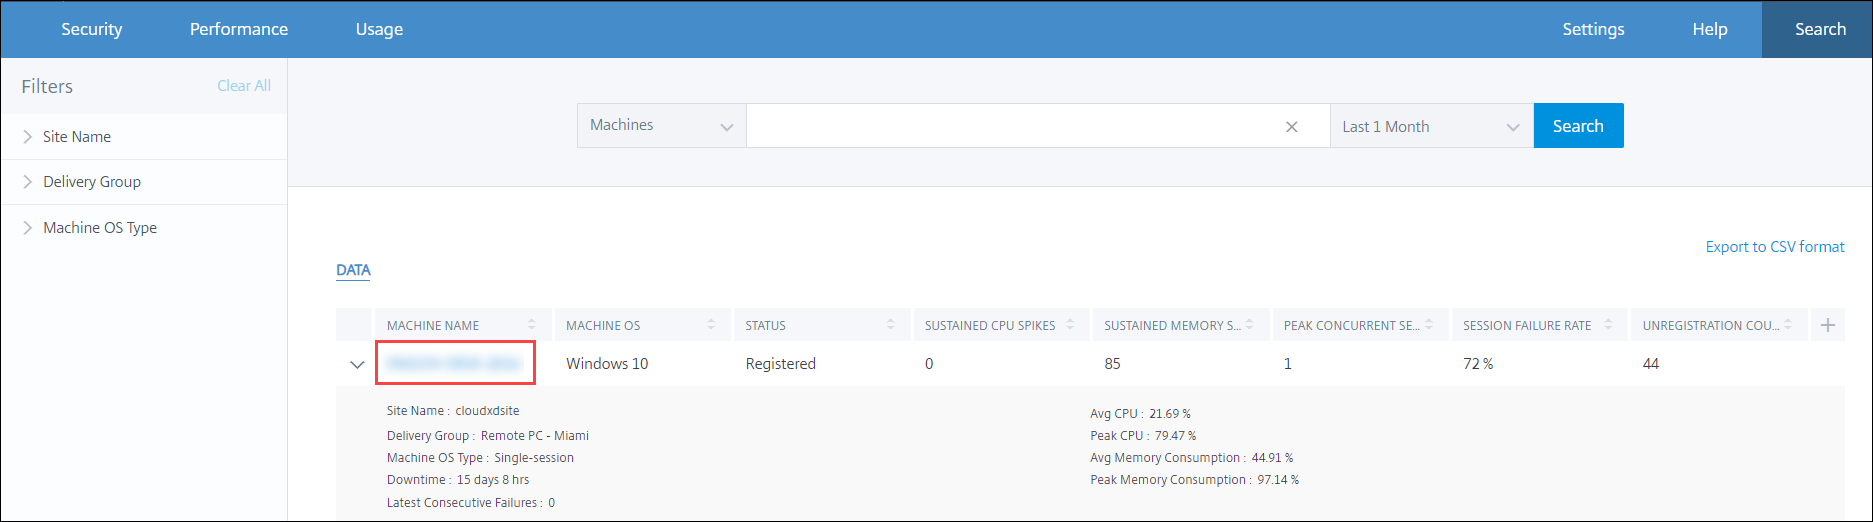
The Machine statistics view provides information to troubleshoot a machine comprehensively. Let us understand the usage of this view with a typical use case starting from the User Experience Dashboard. The Failure insights panel on the User Experience Dashboard, provides a list of black hole machines that resulted in three or more consecutive session failures.
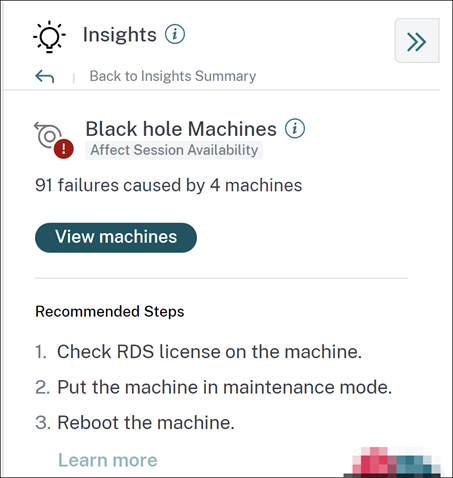
Clicking the black hole machines link leads you to the Machines based self-service view. This view lists all the metrics related to the black hole machines such as the downtime, peak CPU, and peak memory.
Click a machine name in the self-service view for Machines to display the Machine statistics page. This page displays the machine, session performance, and process resource parameters plotted for the same time range. You can use this information to compare resource usage at the time of session failures and get insights on the possibility of resource crunch being a cause for failures.
Machine Actions and Composite Actions
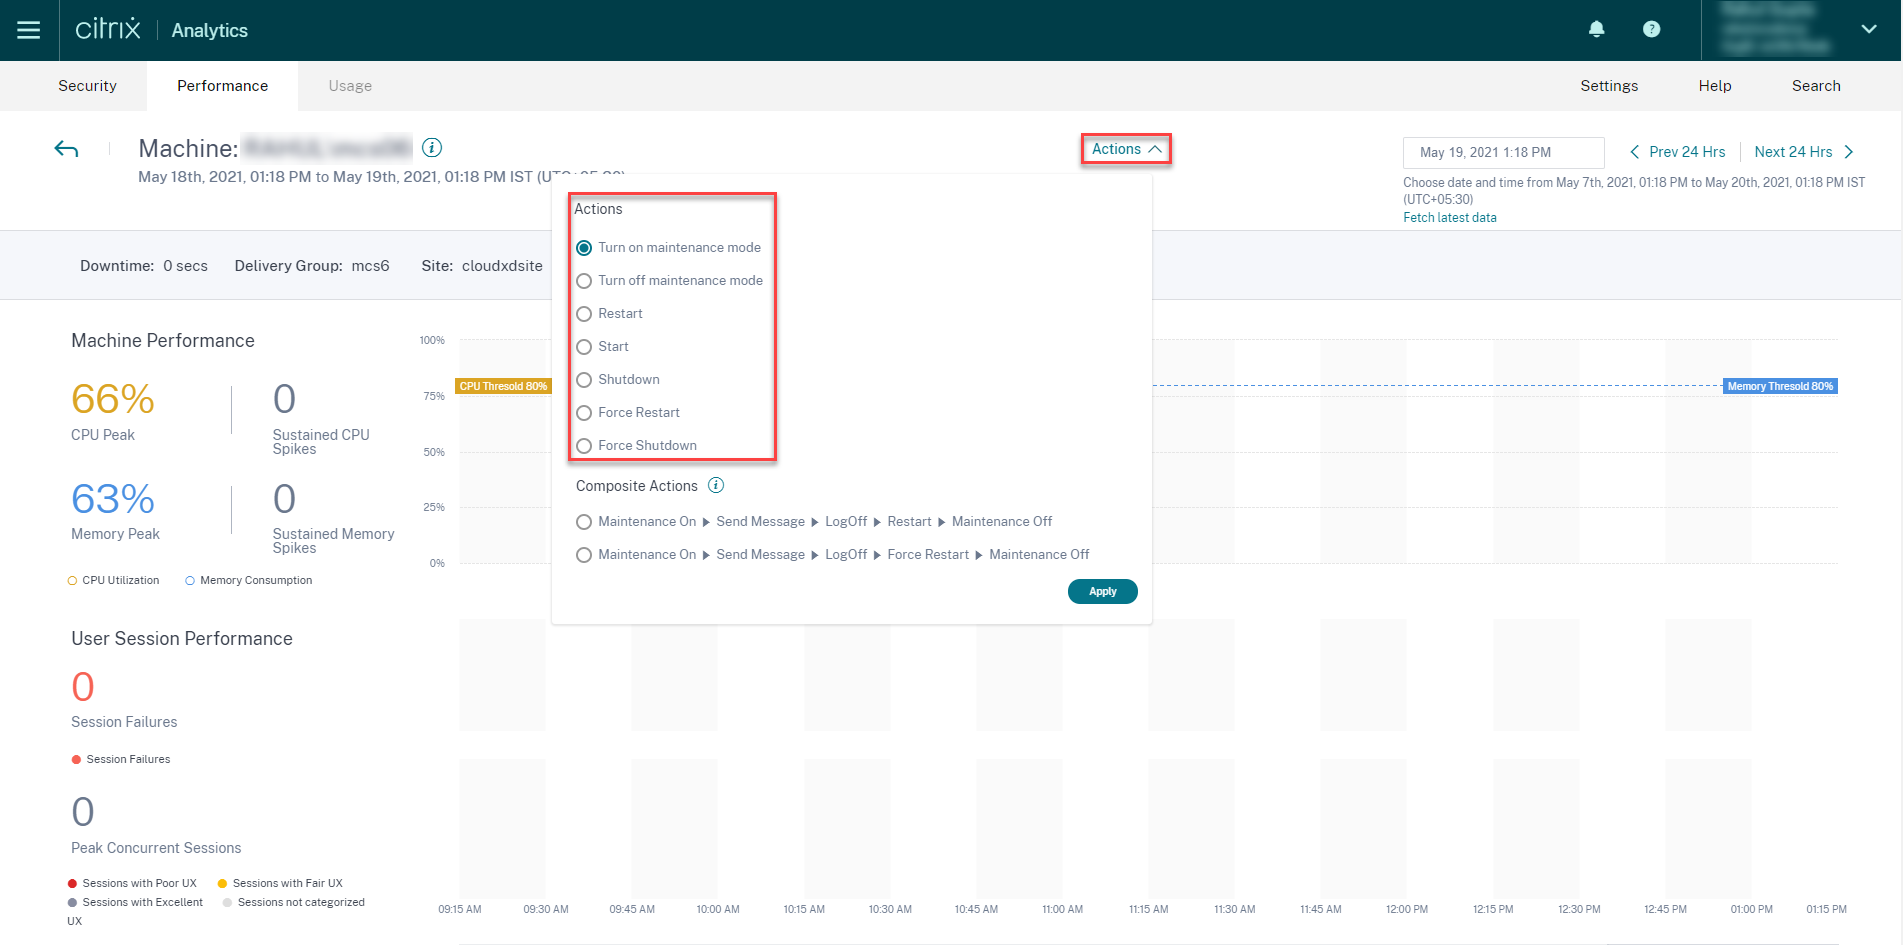
Machine Actions
Machine Actions are available on power managed machines in your Citrix DaaS (formerly Citrix Virtual Apps and Desktops service) sites on cloud. Admins with Full Administrator access can perform the following actions on the machines:
- Turn on maintenance mode
- Turn off maintenance mode
- Restart machine
- Start machine
- Shutdown machine
- Force restart machine
- Force shut down machine
Note:
The Machine Actions option is visible for all machines. However, it works only on MCS or power-managed machines. The Machine Actions are disabled for machines hosted on on-premises sites.
Typical use case for Machine Actions
Machine actions help resolve poor user experience. If a machine is impacted due to high memory usage, you can understand the exact nature of the issue in the Machines self-service view. The Machines self-service view displays the OS, the number of memory spikes, and CPU spikes over a period. You can click individual machines to see the correlation between the resources and the session experience in the Machine Statistics page. A sample screenshot is given here.
As a full administrator, you can put the machine in maintenance so that no more connections or sessions are allowed on this machine. You can then restart the machine or perform other troubleshooting procedures to free up the memory.
You can perform all these actions from within the Machine Statistics view instead of navigating to Web Studio or Citrix Director.
Composite Actions
Composite Actions help perform a sequence of machine actions in a single click from the Machine Statistics view.
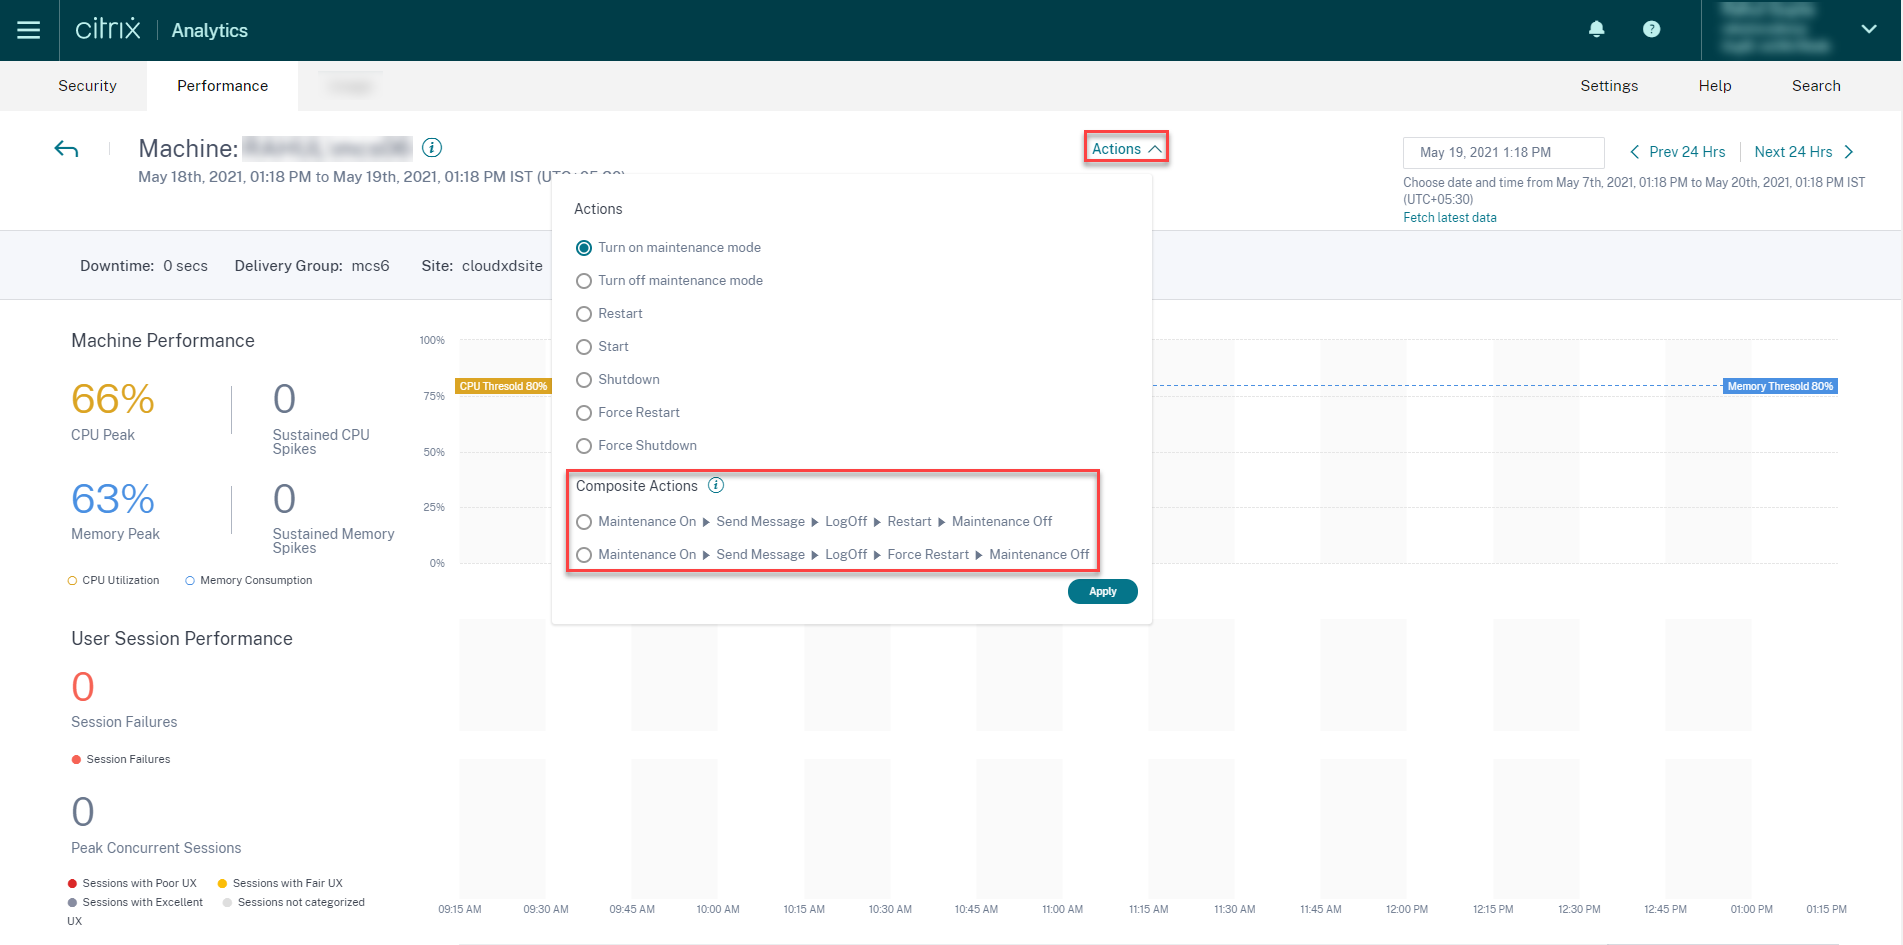
You can use one of the following two sequences of Composite Actions.
-
Maintenance On > Send Message > Logoff > Restart > > Maintenance Off**
- Move the machine to Maintenance On mode.
- Send restart warning messages to all users logged into the machine.
- Wait for a timeout of 30 minutes or wait for all users to log off.
- Restart the machine.
- Move the machine to Maintenance Off mode.
-
Maintenance On > Send Message > Logoff > Force Restart » Maintenance Off
- Move the machine to Maintenance On mode.
- Send restart warning messages to all users logged into the machine.
- Wait for a timeout of 30 minutes or wait for all users to log off.
- Force restart the machine.
- Move the machine to Maintenance Off mode.
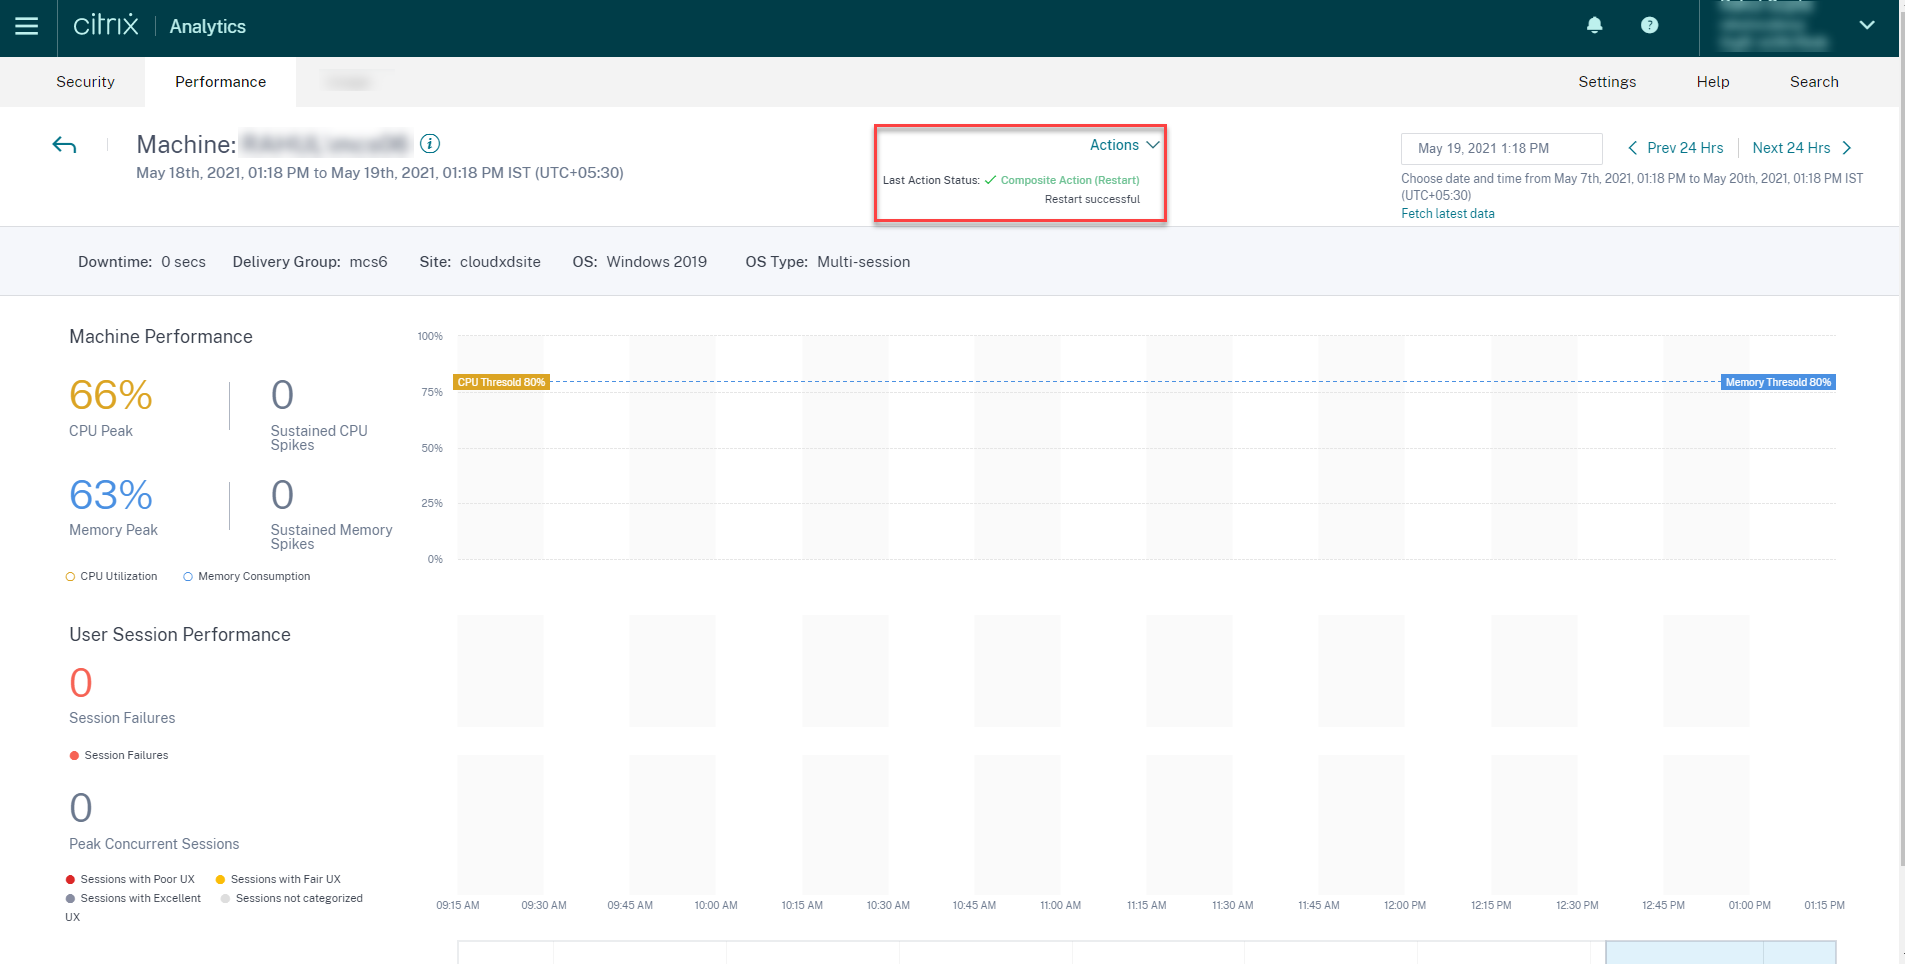
The overall status of the action and that of the individual steps are displayed under the Actions link.
WEM Tasks Health Check
You can perform WEM Health Checks on machines from Performance Analytics. Workspace Environment Management™ (WEM) is a user environment management tool that helps optimize desktops for the best possible user experience.
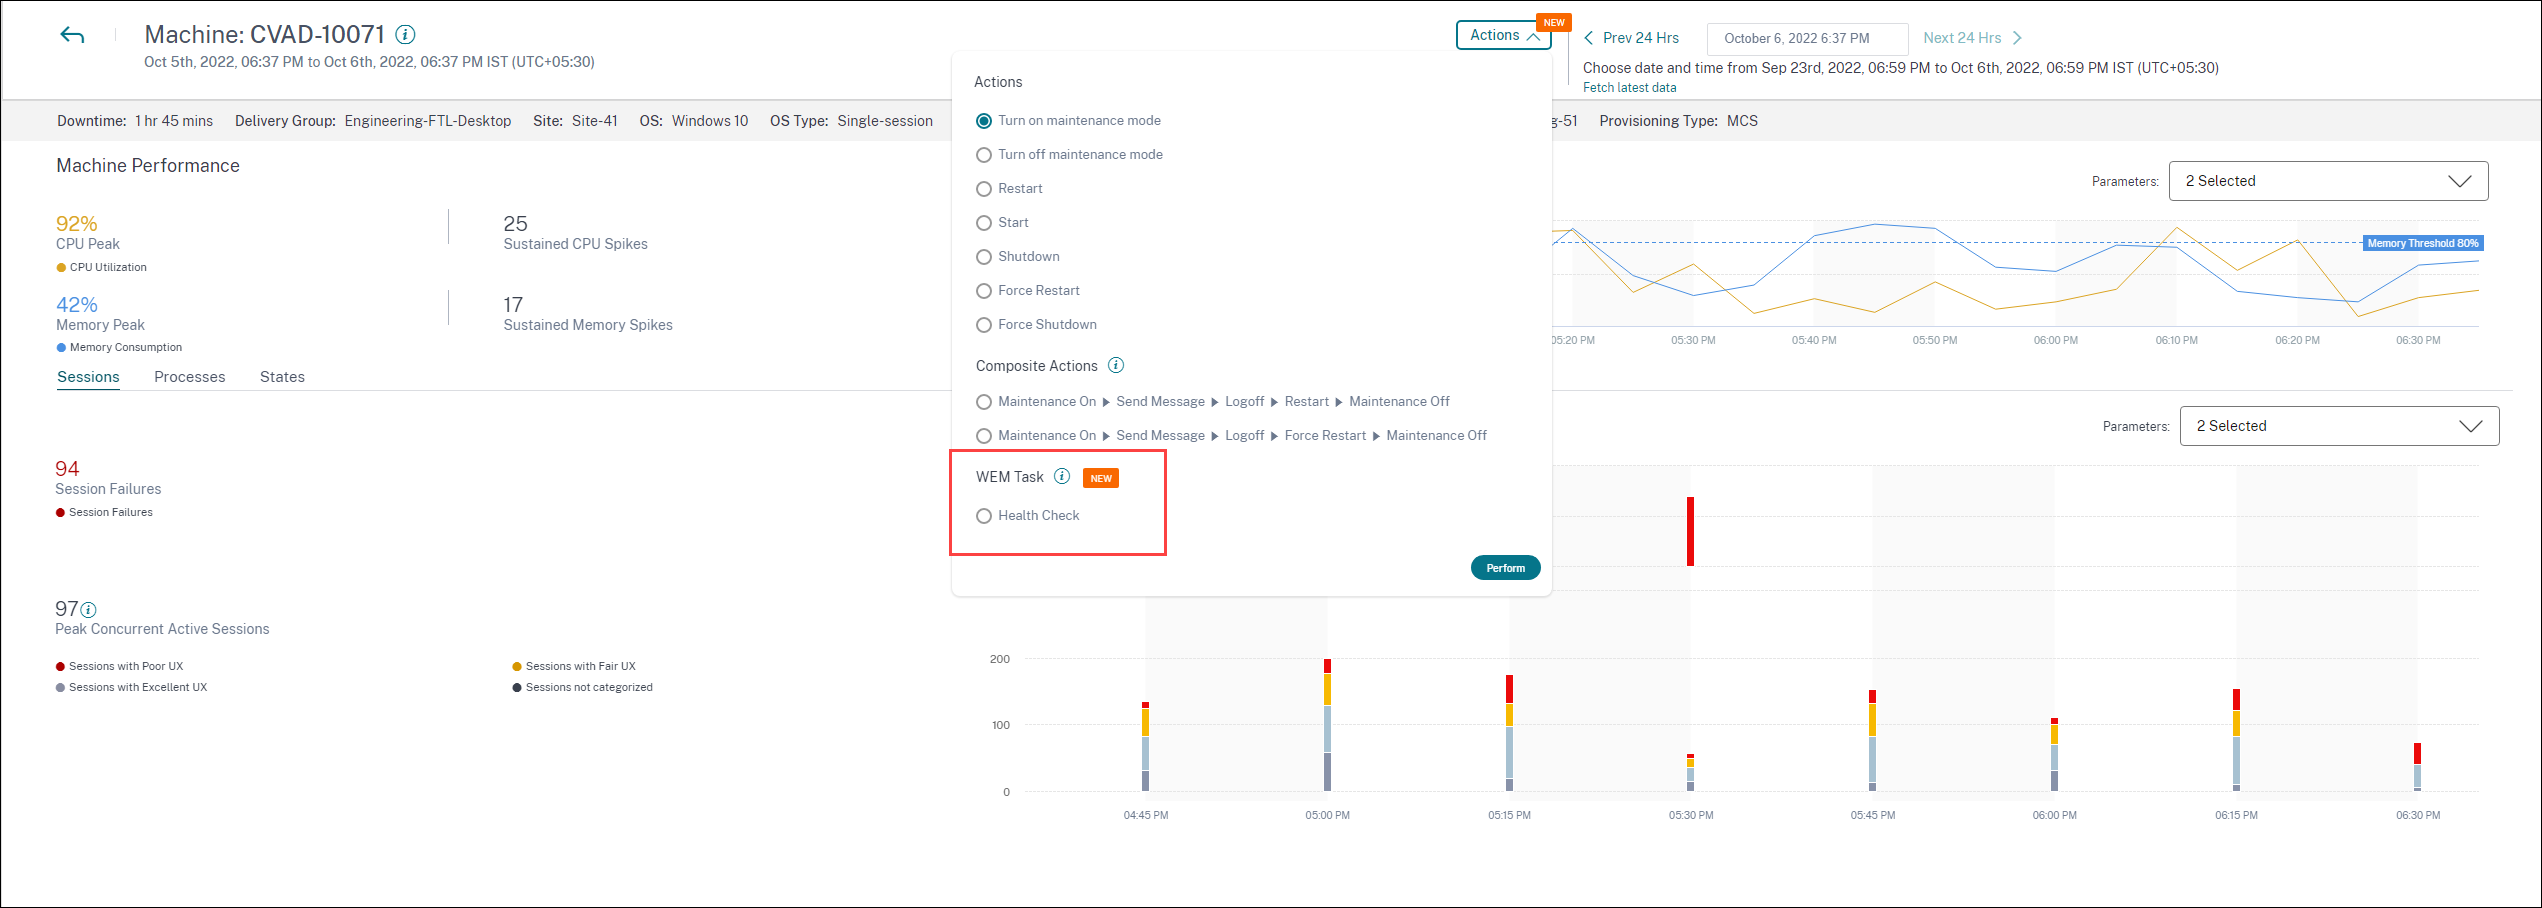
Select the WEM Task -> Health Check action. This action runs the WEM Cloud Health Check script to get information on the availability of machines. This feature helps root cause common machine issues with the machine configuration, connectivity or policies easily within Performance Analytics.
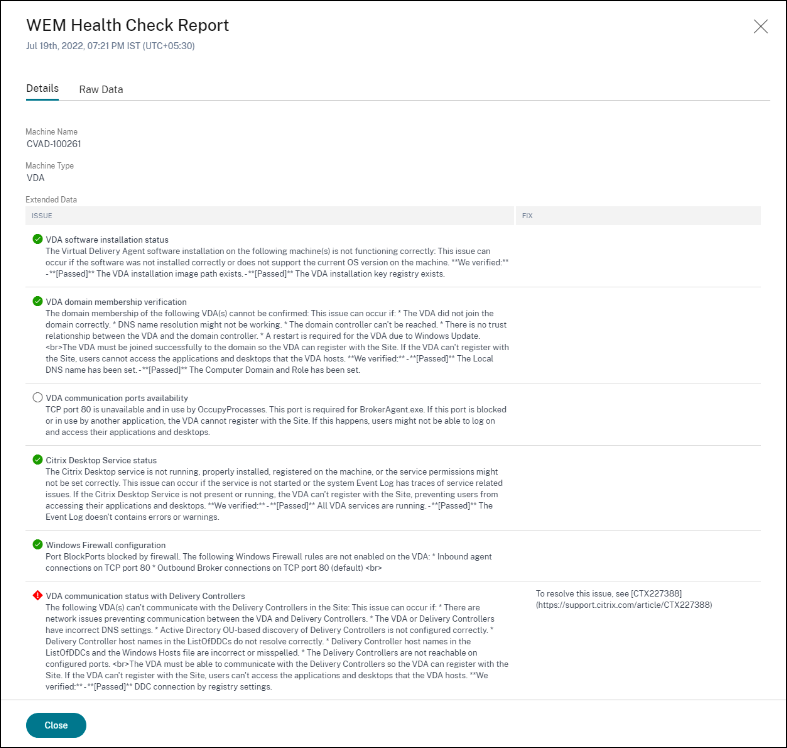
The overall status of the WEM Cloud Health Check action is displayed. A link to a report is displayed once the script runs successfully. Clicking this link opens a detailed report containing the results of the WEM Cloud Health Check and possible actions that can be performed to fix them is also provided on Performance Analytics.
Note:
WEM Tasks are enabled for Cloud admins with full access and valid entitlement to WEM.
For more information regarding the WEM Task Health Check, see Scripted Tasks article in the Workspace Environment Management documentation.