User Experience Score
What does the User Experience represent?
The User Experience is a comprehensive measurement of the quality of the session established by the user while using Apps and Desktops. The User Experience (UX) score indicates the quality of user experience. UX score is calculated using performance factors that define the quality of a user session. The factor metrics are analyzed and processed using statistical methods over a time period to arrive at a score out of 100. This score is a quantitative reflection of the actual experience a user has while using Apps and Desktops.
The performance factor metrics represent the experience of a session through its life cycle from session launch to the session end.
-
Session Logon Duration factor represents the session launch experience.
-
Session Responsiveness factor represents the in-session responsiveness or sluggishness.
-
Session Availability represents the success rate of establishing a session connection when attempted by the user.
-
Session Resilience measures the reconnection rate when the user is connected over a sluggish network.
The performance factors are further divided into subfactors/types. For example, Session Logon Duration is calculated using individual phases that occur during logon, such as the GPOs, Interactive session, and Profile load. The factor and subfactor thresholds are calibrated to classify users and sessions as Excellent, Fair, or Poor.
UX scores are benchmarked into the following categories:
-
Excellent: UX score of 71-100
-
Fair: UX score of 41-70
-
Poor: UX score of 1-40
How are dynamic thresholds calculated
The concept of dynamic thresholds is used to benchmark the Session Logon Duration and the Session Responsiveness factors and their subfactors individually for every customer. Statistical techniques are used to periodically calculate thresholds that classify users as Excellent, Fair, or Poor.
-
Calculation of thresholds for factors and subfactors is done on a per customer basis. This method of calculation ensures that the specific configuration and range of accepted behavior for every customer is accommodated for.
-
Thresholds are calculated for each customer based on metrics collected during the past 30 days.
-
Thresholds are recalibrated every seven days to reflect any changes in the environment, such as, reconfiguration of machines or a network upgrade. The recalibrated thresholds represent the resulting changes in factor measurements.
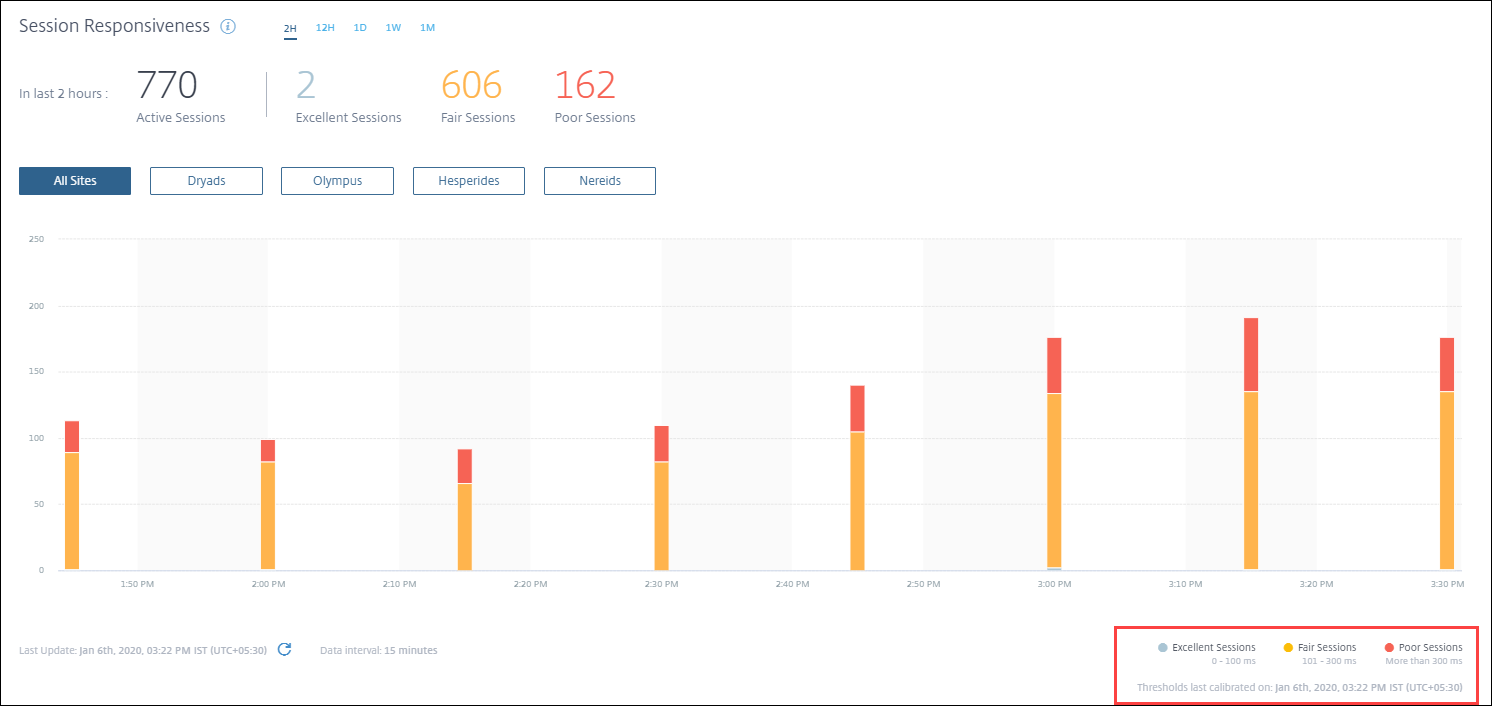
In this example, the chart legend indicates the dynamic thresholds of Session Responsiveness as:
- Excellent session - 0–100 ms
- Fair session - 101–300 ms
- Poor session - greater than 300 ms
Time stamp of the last thresholds update is displayed below the chart legend. The chart is replotted based on the latest thresholds.
Dynamic thresholds ensure that the classification of session and users reflects the environment that is being analyzed precisely. Users with poor experience in any customer environment are highlighted accurately for further troubleshooting.
How is the UX score calculated
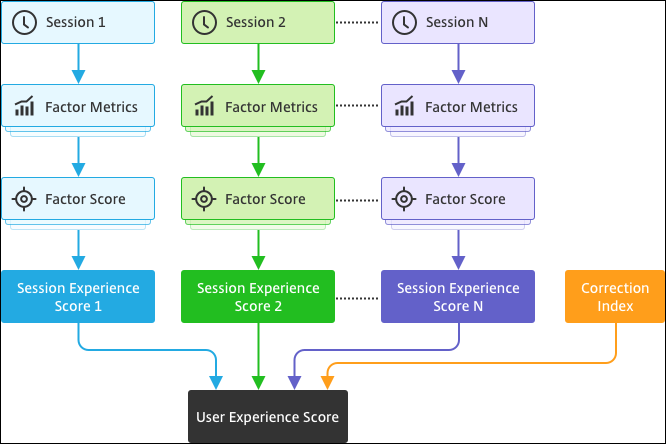
The User Experience score is calculated from the contributing factor scores using the bottom up approach.
-
Benchmark factors:
For each session, Session Logon Duration and Session Responsiveness factors and their subfactors are calibrated dynamically once every seven days. Based on these thresholds, sessions are classified as Excellent, Fair, or Poor. The measurements are used to arrive at factor scores (out of 100) for each session.
-
Relative weights of factors:
The severity by which the factors impact the user experience might differ. For example, the impact of Session Resiliency on the session experience is more than the impact of Session Logon Duration. So, a relative weight is applied on each factor.
-
Session Experience score:
The session experience score is calculated as the weighted average of various factor scores applicable for the selected duration.
Next, the session experience scores of individual sessions applicable to the user are collated.
-
Correction factor:
The Session Availability factor indicates the success rate of getting a session connection when attempted. The impact of this factor is at the user level and not at the session level. Hence, the Session Availability score is applied as a correction factor to the sum of the individual session scores to arrive at the User Experience (UX) score.
The UX score gives you actionable insights about the user experience. Drilling down further into metrics of users with a poor user experience score helps identify a particular factor or subfactor that is causing the poor experience.