Citrix Virtual Apps and Desktops™ and Citrix DaaS data source
The Apps and Desktops data source represents on-premises Citrix Virtual Apps and Desktops and Citrix DaaS (formerly Citrix Virtual Apps and Desktops service) in your organization.
Citrix Analytics for Security™ supports both the offerings and receives user events from the data source. This article walks you through the prerequisites and the procedures to enable Analytics on both the offerings.
Citrix Analytics for Security receives user events from the following components of the Citrix Virtual Apps and Desktops and Citrix DaaS™ data source:
-
Citrix Workspace™ app installed on the user devices
-
Citrix Director for on-premises deployment
-
Citrix Monitor service
-
Session recording servers
The user events are received in real time in Citrix Analytics for Security when users use virtual apps or virtual desktops.
Supported client versions
Citrix Analytics receives user events when a supported client version is used on the user endpoints. If users are using any unsupported client versions, they must upgrade their clients to one of the following versions:
-
Citrix Workspace app for Windows 1907 or later
-
Citrix Workspace app for Mac 1910.2 or later
-
Citrix Workspace app for HTML5 2007 or later
-
Citrix Workspace app for Chrome-Latest version available in Chrome Web Store
-
Citrix Workspace app for Android-Latest version available in Google Play
-
Citrix Workspace app for iOS-Latest version available in Apple App Store
-
Citrix Workspace app for Linux 2006 or later
Enable Analytics on Citrix DaaS
Prerequisites
-
Subscribe to Citrix DaaS offered on Citrix Cloud. To learn how to get started with Citrix DaaS, see Install and configure.
-
Review the System Requirements section and ensure that you met the requirements.
View the data source and turn on data processing
Citrix Analytics automatically discovers Citrix DaaS associated with your Citrix Cloud™ account.
To view the data source:
From the top bar, click Settings > Data Sources > Security.
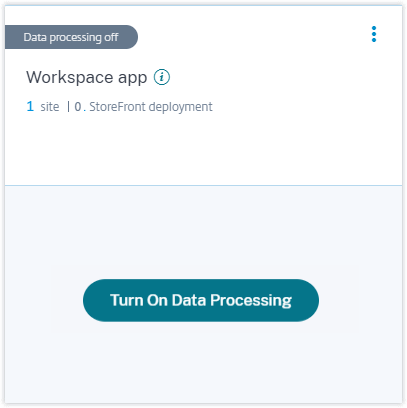
The Apps and Desktops- Workspace app site card appears on the Data Sources page. Click Turn On Data Processing to allow Citrix Analytics to begin processing data for this data source.
View cloud site, users, and received events
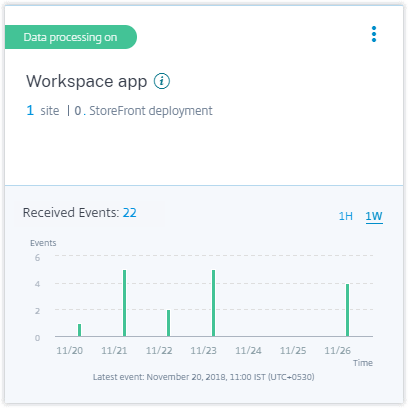
The site card displays the number of Apps and Desktops users, the discovered cloud site, and the received events for the last one hour, which is the default time selection. You can also select 1 week (1 W) and view the data.
Click the number of received events to view the events on the self-service search page.
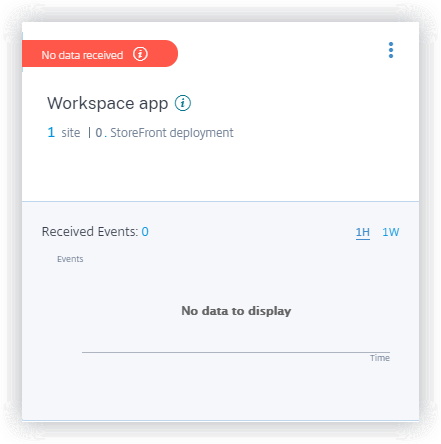
After you have enabled data processing, the site card might display the No data received status. This status appears for two reasons:
-
If you have turned on data processing for the first time, the events take some time to reach the event hub in Citrix Analytics. When Citrix Analytics receives the events, the status changes to Data processing on. If the status does not change after some time, refresh the Data Sources page.
-
Analytics has not received any events from the data source in the last one hour.
Enable Analytics on Citrix Virtual Apps and Desktops on-premises
Citrix Analytics receives user events from on-premises sites added to Workspace and sites accessed through StoreFront™ deployments.
If your organization is using on-premises sites, you must use one of the following methods to onboard your sites so that Analytics discovers the sites:
Prerequisites
-
You must have a license to use the Citrix Virtual Apps and Desktops on-premises solution. To learn how to get started with Citrix Virtual Apps and Desktops on-premises, see Install and configure.
-
Review the System Requirements section and ensure that you met the requirements.
-
Your Director is on version 1912 CU2 or later. For more information, see Feature compatibility matrix.
-
Subscription to Citrix Workspace. If you want to add your sites to Citrix Workspace, you must require a Workspace subscription.
To purchase a Citrix Workspace subscription, visit https://www.citrix.com/products/citrix-workspace/get-started.html and contact a Citrix Workspace expert who can help you.
-
Sites added to Workspace. Citrix Analytics automatically discovers the sites added to Citrix Workspace. Add your sites to Citrix Workspace before proceeding with onboarding on Citrix Analytics. This process is known as Site aggregation.
Site aggregation requires you to install Cloud Connector, configure NetScaler Gateway STA servers for internal and external connectivity to Workspace resources, and then add the sites to Workspace. For detailed instructions on site aggregation, see Aggregate on-premises virtual apps and desktops in workspaces.
-
StoreFront version. If you are using a StoreFront deployment for your sites, ensure that the StoreFront version is 1906 or later.
Onboard Citrix Virtual Apps and Desktops on-premises sites using StoreFront
For information about the prerequisites and the onboarding steps, see the Citrix Virtual Apps and Desktops data source article on the Citrix Analytics platform documentation.
Onboard Citrix Virtual Apps and Desktops on-premises sites using Workspace
Sites already added to Citrix Workspace
Citrix Analytics automatically discovers the on-premises sites that are already added to Citrix Workspace and displays them on the data source site card.
To view the data source:
From the top bar, click Settings > Data Sources > Security.
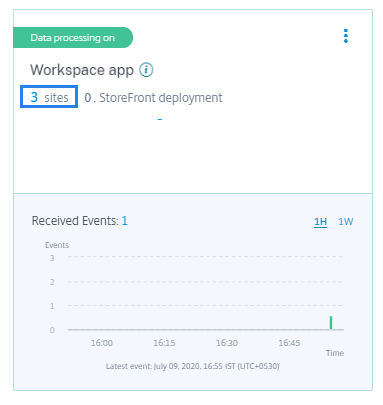
The Apps and Desktops site card displays the number of sites added to Workspace and the users connected to these sites. Click the site count to view the discovered sites. Click the user count to view the discovered users on the Users page.
Sites not added to Citrix Workspace
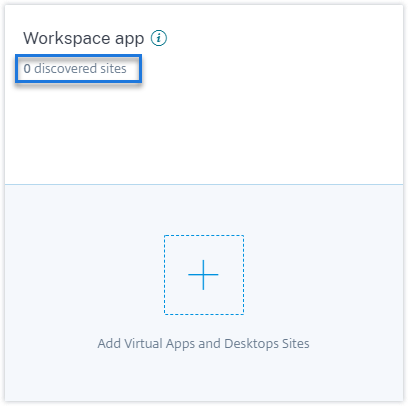
If you have not already added your on-premises sites to Workspace, Analytics cannot discover your sites. The site card displays 0 discovered sites.
To add a site to Workspace:
-
Click + on the site card.
-
On the Workspace Configuration page, click +Add Site.
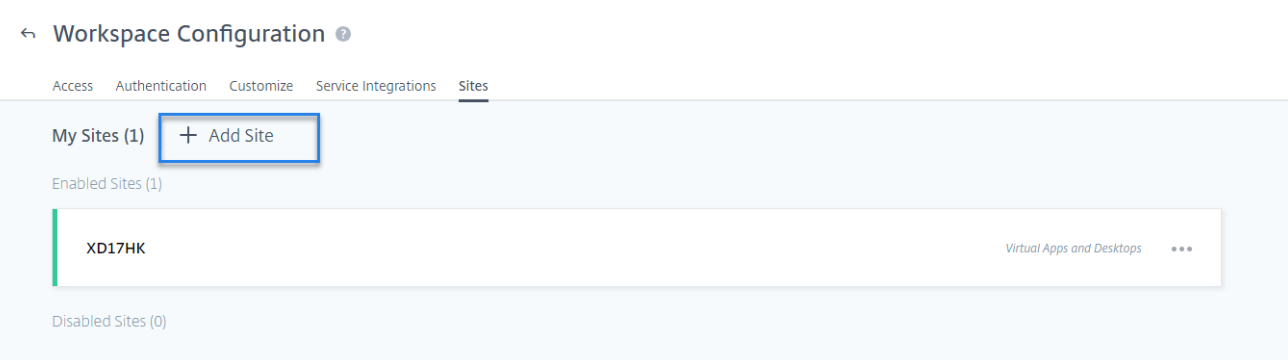
-
Follow the on-screen instructions to add a Site. For more information, see Aggregate on-premises virtual apps and desktops in workspaces.
-
After adding the site, log back to Citrix Analytics and refresh the Data Sources page to view the recently added site on the site card.
Turn on data processing and view received events
To allow Analytics to begin processing data for the discovered sites, click Turn On Data Processing on the site card and follow the prompts on the screen.
If you have multiple sites added to the same Workspace, Analytics processes and stores data for all the sites in the Workspace. You get a success message when Analytics is successfully enabled on all your sites.

The site card displays the received events for the last one hour, which is the default time selection. You can also select 1 week (1 W) and view the data. Click the number of received events to view the events on the corresponding self-service search page.
After you have enabled data processing, the site card might display the No data received status. This status appears for two reasons:
-
If you have turned on data processing for the first time, the events take some time to reach the event hub in Citrix Analytics. When Citrix Analytics receives the events, the status changes to Data processing on. If the status does not change after some time, refresh the Data Sources page.
-
Analytics has not received any events from the data source in the last one hour.
Add a site
If you want to add another on-premises site to Workspace, you can add it from Analytics:
-
On the Workspace Configuration page, click +Add Site.
-
Follow the on-screen instructions to add a site. For more information, see Aggregate on-premises virtual apps and desktops in workspaces.
-
After adding the site, go to Citrix Analytics and refresh the Data Sources page to view the recently added site on the site card.
Connect to Citrix Director for on-premises sites
Citrix Director is a monitoring and troubleshooting console for Citrix Virtual Apps and Desktops. You can use Director to configure your on-premises sites for Citrix Analytics for Security (Security Analytics). After the sites are configured, Director sends monitoring events to Security Analytics.
If you are using Citrix DaaS, the Citrix Monitor service sends events from your cloud site to Security Analytics.
In a hybrid environment where you have both cloud and on-premises deployments, Security Analytics receives events from the Citrix Monitor service and the sites onboarded on Citrix Director.
Prerequisite and configuration steps
Notes
Currently, the Director user interface displays the configuration steps related to Citrix Analytics for Performance™ (Performance Analytics). These configuration steps are also applicable for Citrix Analytics for Security (Security Analytics). If you have an active Citrix Cloud entitlement for Security Analytics, you can connect to Citrix Director by following those steps.
If your Citrix Cloud account has active entitlements for both Security Analytics and Performance Analytics and you have already configured your site for Performance Analytics, you do not need to configure Director again for Security Analytics.
For information on the prerequisites and configuration steps, see Citrix Analytics for Performance documentation.
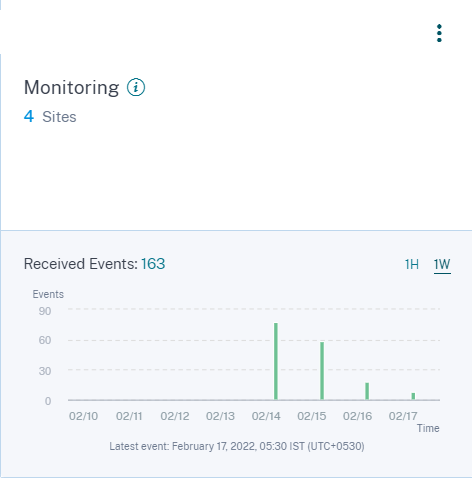
View your connected sites and received events
-
In Citrix Analytics, go to the Data Sources page.
-
Click the Security tab.
-
On the Apps and Desktops- Monitoring site card, you can view your on-premises sites or the cloud site (which ever is applicable). You also view the events received from the sites.
Notes
-
The first time you configure an on-premises site on Director, events from the site might take some time (approximately an hour) to get processed; causing a delay in the display of the connected site on the Apps and Desktops- Monitoring site card.
-
On the Monitoring site card, the data processing for the Monitor service or the Director data source is enabled by default. You can also turn off the data processing depending on your requirement. However, it is recommended to keep the data processing on to get maximum benefits from Security Analytics.
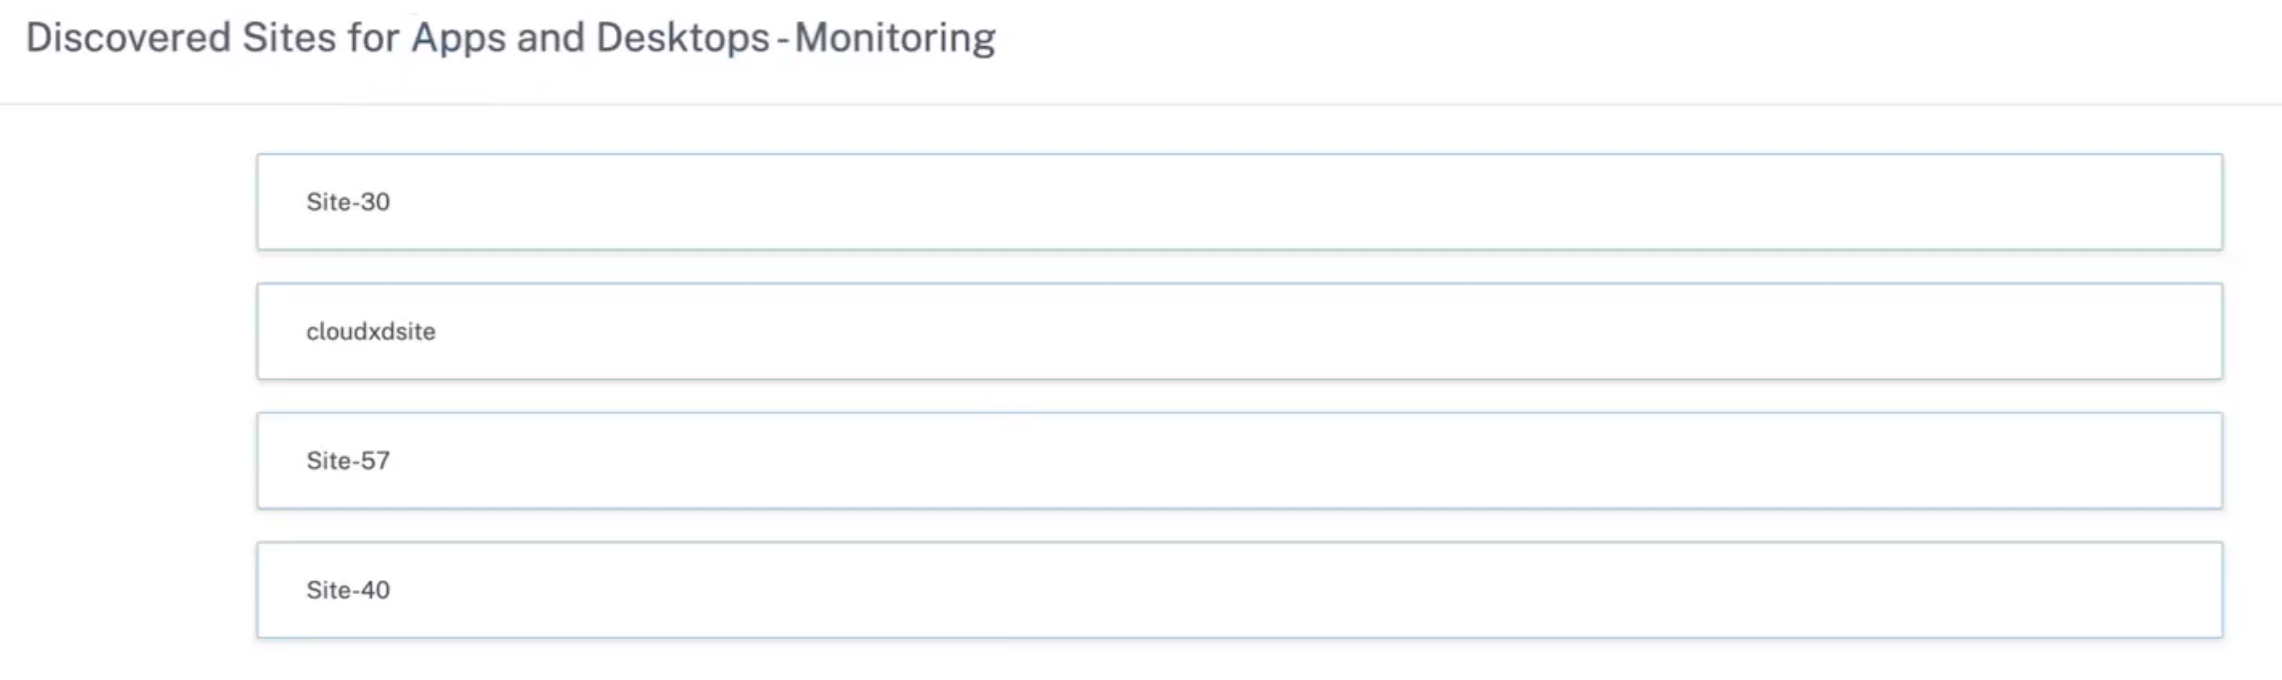
-
-
Click the site to view the details.
Connect to Session Recording deployment
Session Recording allows you to record the on-screen activity of any user session in Citrix Virtual Apps and Desktops and Citrix DaaS. You can configure the Session Recording servers to send the user events to Citrix Analytics for Security. The user events are processed to provide actionable insights into the users’ risky behaviors.
Prerequisites
Before you begin, ensure the following:
-
Your Session Recording server and the VDA agent must be 2103 or later.
-
The Session Recording server must be able to connect to the required addresses. For more information on the URLs, see Network requirements.
-
The Session Recording deployment must have port 443 open for outbound internet connections. Any proxy servers on the network must allow this communication with Citrix Analytics for Security.
-
If you are using Citrix Virtual Apps and Desktops 7 1912 LTSR, the supported Session Recording version is 2103 or later.
Note
Ensure to verify the additional connectivity requirements while using the Session Recording service.
Configure your Session Recording server
-
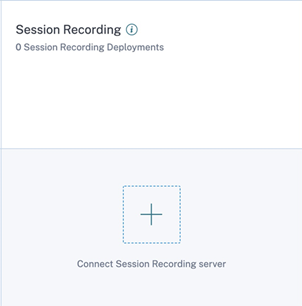
On the Apps and Desktops- Session Recording site card, click Connect Session Recording server.
-
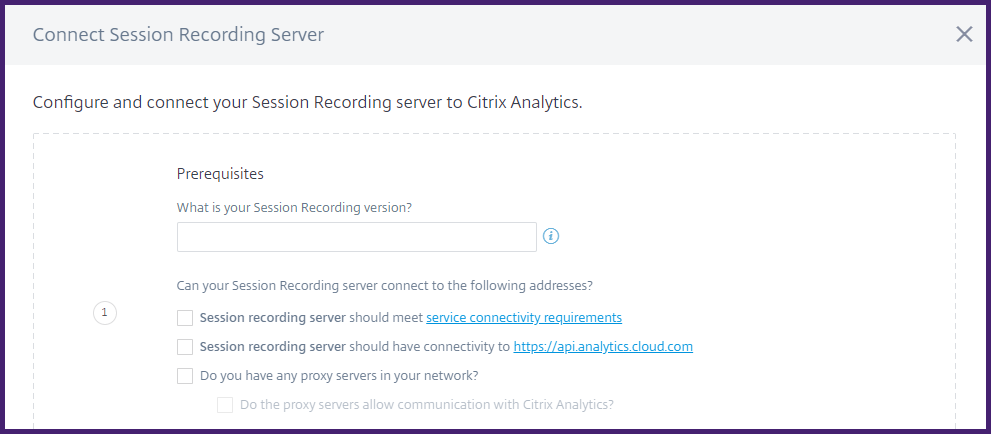
On the Connect Session Recording Server page, review the checklist, and select all the mandatory requirements. If you do not select a mandatory requirement, the Download File option is disabled.
-
If you have proxy servers in your network, enter the proxy address in the SsRecStorageManager.exe.config file in your Session Recording server.
The configuration file is located at
<Session Recording Server installation path>\bin\SsRecStorageManager.exe.configFor example:
C:\Program Files\Citrix\SessionRecording\Server\Bin\SsRecStorageManager.exe.config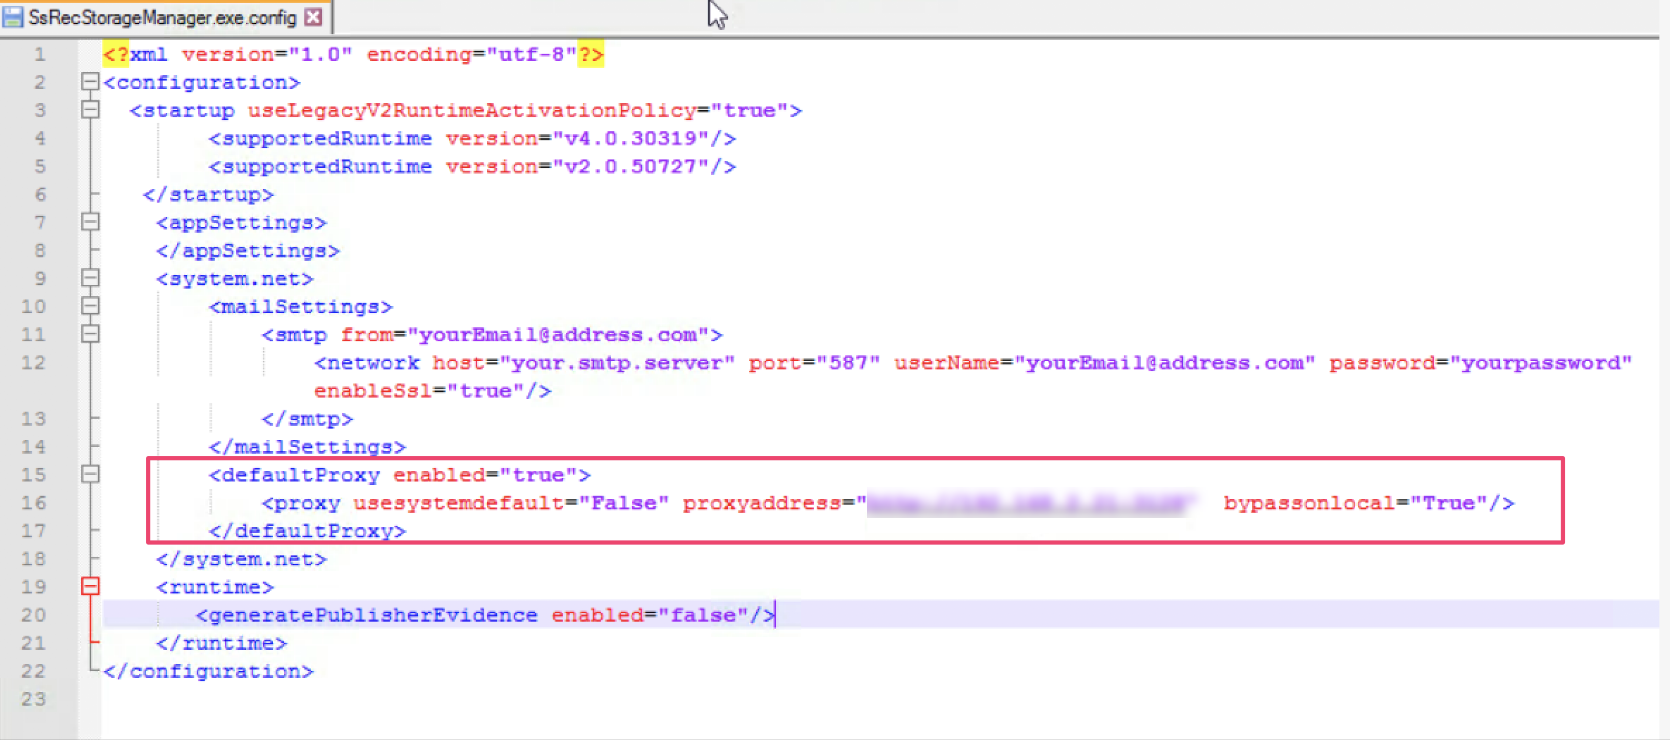
-
Click Download File to download the SessionRecordingConfigurationFile.json file.
Note
The file contains sensitive information. Keep the file in a safe and secure location.
-
Copy the file to the Session Recording server that you want to connect to Citrix Analytics for Security.
-
If you have multiple Session Recording servers in your deployment, you must copy the file in each server that you want to connect and follow the steps to configure each server.
-
On the Session Recording server, run the following command to import the settings:
<Session Recording Server installation path>\bin\SsRecUtils.exe -Import_SRCasConfigurations <configuration file path>For example:
C:\Program Files\Citrix\SessionRecording\Server\bin\ SsRecUtils.exe -Import_SRCasConfigurations C:\Users\administrator \Downloads\SessionRecordingConfigurationFile.json -
Restart the following services:
-
Citrix Session Recording Analytics Service
-
Citrix Session Recording Storage Manager
-
-
After configuration is successful, go to Citrix Analytics for Security to view the connected Session Recording server. Click Turn On Data Processing to allow Citrix Analytics for Security to process the data.
Note
If you are using Session Recording server version 2103 or 2104, you must first launch an Apps and Desktops session to view the connected Session Recording server on Citrix Analytics for Security. Otherwise the connected Session Recording server fails to get displayed. This requirement is not applicable for Session Recording server version 2106 and later.
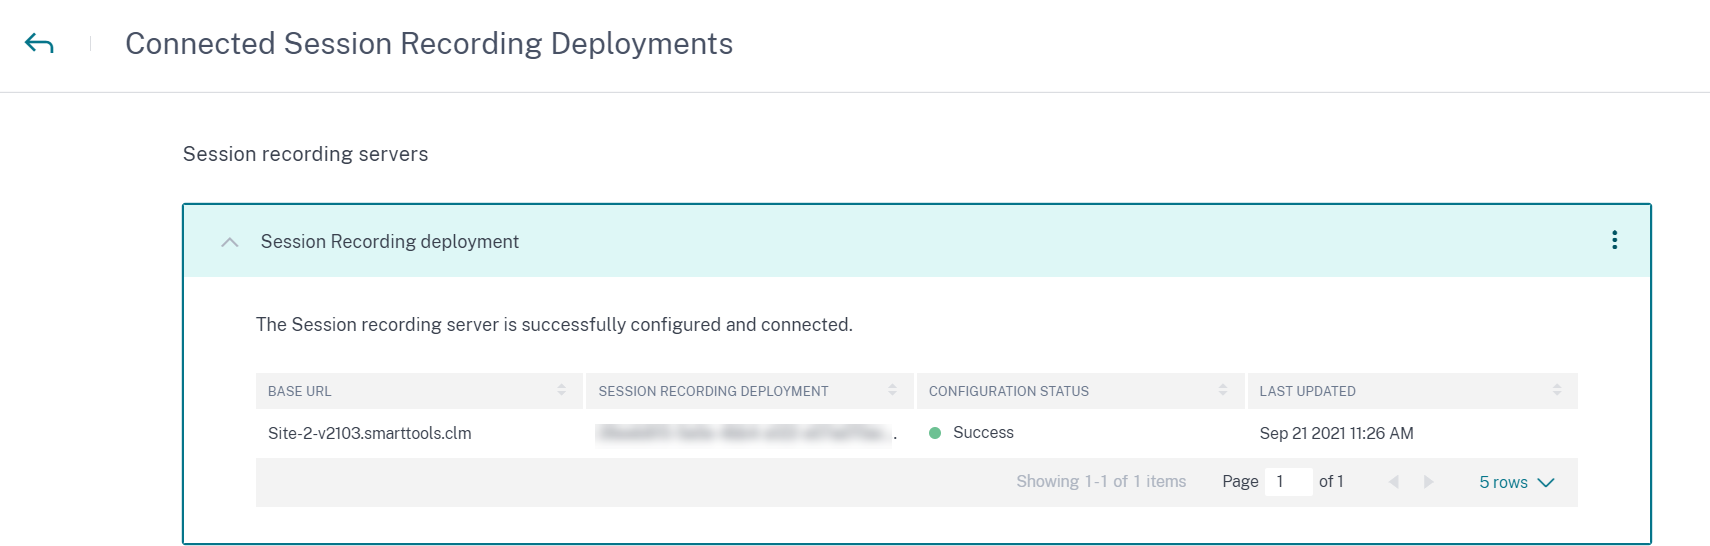
View the connected deployments
The server deployments appear on the Session Recording site card only if the configuration is successful. The site card shows the number of configured servers that have established connections with Citrix Analytics for Security.
If you don’t see your Session Recording servers even after the configuration was successful, refer to the Troubleshooting article.
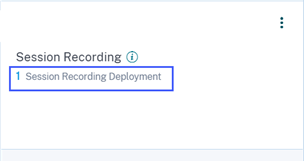
On the site card, click the number of deployments to view the connected server groups with Citrix Analytics for Security. For example, click 1 Session Recording Deployment to view the connected server or server groups. Each Session Recording server is represented by a base URL and a ServerGroupID.
View received events
The site card displays the connected Session Recording deployments and the events received from these deployments for the last one hour, which is the default time selection. You can also select 1 week (1 W) and view the data. Click the number of received events to view the events on the self-service search page.
After you have enabled data processing, the site card might display the No data received status. This status appears for two reasons:
-
If you have turned on data processing for the first time, the events take some time to reach the event hub in Citrix Analytics. When Citrix Analytics receives the events, the status changes to Data processing on. If the status does not change after some time, refresh the Data Sources page.
-
Citrix Analytics has not received any events from the data source in the last one hour.
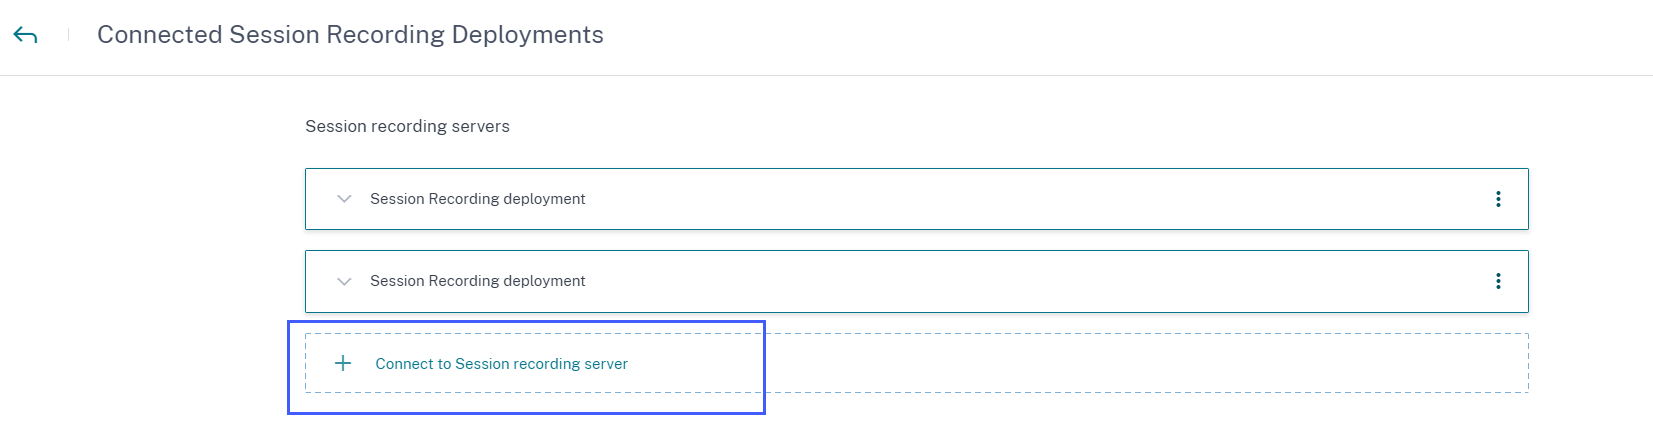
Add Session Recording servers
To add a Session Recording server, do one of the following:
-
On the Connected Session Recording Deployments page, click Connect to Session recording server.
-
On the Apps and Desktops- Session Recording site card, click the vertical ellipsis (⋮) and then select Connect Session Recording server.
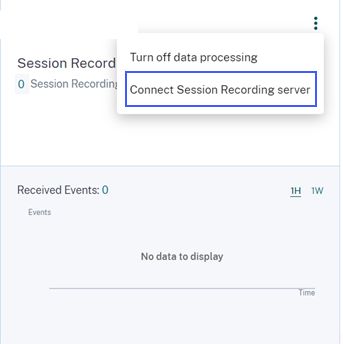
Follow the steps to download the configuration file and configure a Session Recording server.
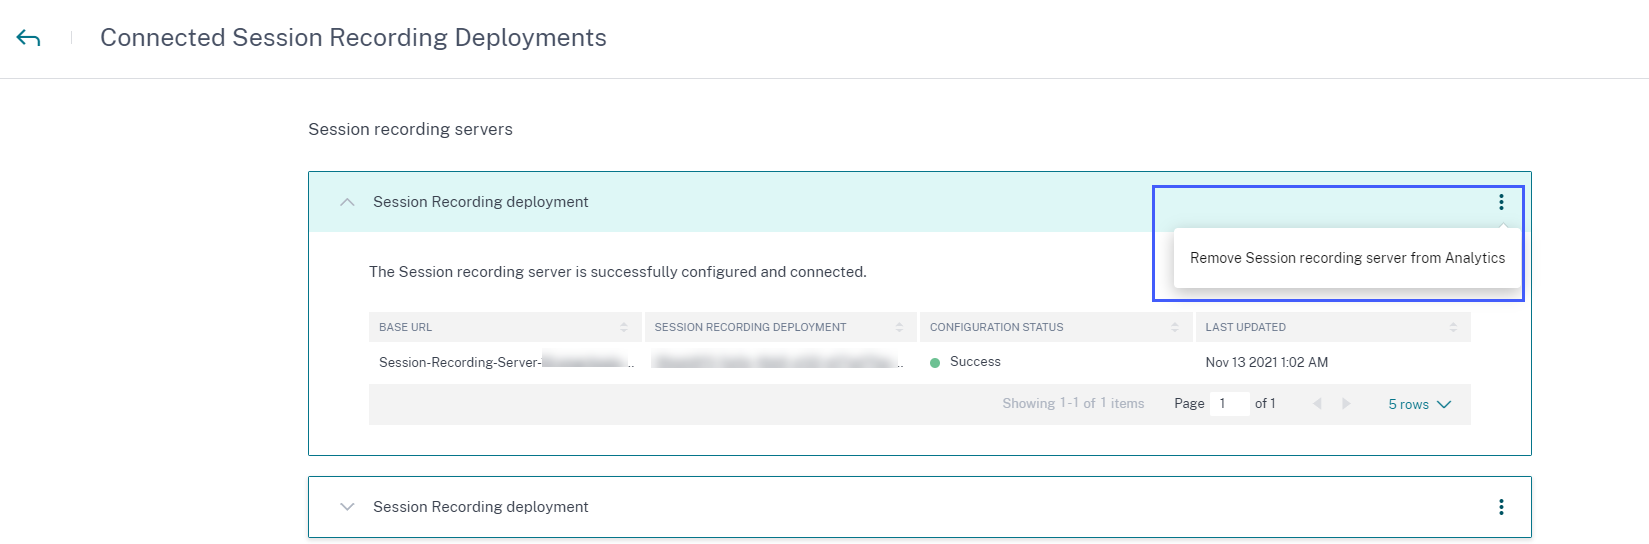
Remove Session Recording servers
To remove a Session Recording server:
-
On Citrix Analytics for Security, go to the Connected Session Recording Deployments page and select the server deployment that you want to remove.
-
Click the vertical ellipses (⋮) and select Remove Session Recording server from Analytics.
-
On the Session Recording server that you have removed from Citrix Analytics, run the following command:
<Session Recording Server installation path>\bin\SsRecUtils.exe -Remove_SRCasConfigurationsFor example:
C:\Program Files\Citrix\SessionRecording\Server\bin\ SsRecUtils.exe -Remove_SRCasConfigurations
Enabling print telemetry for Citrix DaaS
When users perform printing jobs in Citrix DaaS (formerly Citrix Virtual Apps and Desktops service), you can view the logs related to these printing jobs in Citrix Analytics for Security. These printing logs provide vital information about the printing activities such as printer names, print file names, and total printed copies.
Note
This feature is only supported for Citrix DaaS.
In Citrix Analytics for Security, on the Search page, you can select the Apps and Desktops data source to view the printing logs. As a security administrator, you can use these logs for risk analysis and investigation of your users.
By default, the print telemetry feature, which is the collection and transmission of these printing logs, is disabled on the Virtual Delivery Agents (VDAs).
To enable the print telemetry and transmission of printing logs to Citrix Analytics for Security, you need to create registry keys and configure your VDA.
Important
This configuration is only applicable for the Windows VDAs.
Prerequisites
-
Your VDA version must be the same as the baseline version for Citrix Virtual Apps and Desktops 7 2203 LTSR or later. For more information, see Citrix Virtual Apps and Desktops 7 2203 baseline components.
-
You must have full access permissions to perform the registry key updates.
Enable print telemetry in power managed machines
The power-managed machines include virtual machines or blade PCs with the following scenarios:
- Existing master image
- New master image
Enable print telemetry for an existing master image where the VDA version is lower than Citrix Virtual Apps and Desktops 7 2203 LTSR
-
Log in to the master VDA machine and create a snapshot of the current state.
-
Enable print service logs by adding the following registry keys:
- Microsoft-Windows-PrintService/Operational
- ShowJobTitleInEventLogs
For more information about the registry keys, see Create registry keys.
-
Upgrade the VDA to a baseline version for Citrix Virtual Apps and Desktops 7 2203 LTSR or later. For more information, see Citrix Virtual Apps and Desktops 7 2203 baseline components.
-
Power off the machine and take a snapshot of the latest state.
-
Log in to Citrix Cloud. Select the machine catalog, click Update Machines, and follow the on-screen instructions. For more information, see Create machine catalogs.
-
Wait for 24 hours. The configuration is pushed automatically within 24 hours. If the configuration is already completed, you need not wait.
-
Start a desktop session using Citrix Workspace app. All the triggered print events using the client printer are visible on the Search page in Citrix Analytics for Security.
Enable print telemetry for an existing master image where the VDA version is the same as Citrix Virtual Apps and Desktops 7 2203 LTSR or later
Option 1: Add the print registry keys in the master VDA and update virtual desktops.
- Log in to the master VDA machine and create a snapshot of the current state.
- Enable print service logs by adding the following registry keys:
- Microsoft-Windows-PrintService/Operational
- ShowJobTitleInEventLogs
For more information about the registry keys, see Create registry keys.
- Power off the VDA machine and take a snapshot of the latest state.
- Log in to Citrix Cloud, select the machine catalog, click Update Machines, and follow the on-screen instructions.
- Start a desktop session using Citrix Workspace app. All the triggered print events using the client printer are visible on the Search page in Citrix Analytics for Security.
Option 2: Move the virtual desktop to the organizational unit (OU) and create registry keys using GPO
Note
Option 2 method only works for static machines. For random machines, you must follow the option 1 method (as mentioned above).
- Log in to the Domain Controller machine.
-
Enable print service logs by adding the following registry keys:
- Microsoft-Windows-PrintService/Operational
- ShowJobTitleInEventLogs
For more information about the registry keys, see Create registry keys.
Note
In any domain controller, creating the registry keys is a one-time task.
- Restart the VDA machine from Citrix Cloud.
- Start a desktop session using Citrix Workspace app. All the triggered print events using the client printer are visible on the Search page in Citrix Analytics for Security.
Enable print telemetry in a new master image
- Create a virtual machine (VM) by using the hypervisor’s management tool. This VM is treated as a master VDA.
- Ensure that the master VDA is added to the required domain.
- Log in to the master VDA and enable the print service logs by adding the following registry keys:
- Microsoft-Windows-PrintService/Operational
- ShowJobTitleInEventLogs
For more information, see Create registry keys.
- Install the VDA version for Citrix Virtual Apps and Desktops 7 2203 LTSR or later. While installing the VDA, select the Master Image option. For more information, see Citrix Virtual Apps and Desktops 7 2203 baseline components.
- Ensure that the hosting connection is added to Citrix Cloud. For more information, see Create machine catalogs.
- Create a machine catalog using the master image. For more information, see Create machine catalogs.
- Create a delivery group and add the machine catalog. For more information, see Create delivery groups.
- Wait for 24 hours. The configuration is pushed automatically within 24 hours by the group policy engine.
- Start a desktop session using Citrix Workspace app. All the triggered print events using the client printer are visible on the Search page in Citrix Analytics for Security.
Enable print telemetry in machines that are not power managed
The non-power managed machines include the physical computers with the following scenarios:
- Existing physical VDA
- New physical VDA
Enable print telemetry for an existing physical VDA where the VDA version is lower than Citrix Virtual Apps and Desktops 7 2203 LTSR
-
Enable print service logs by adding the following registry keys:
- Microsoft-Windows-PrintService/Operational
- ShowJobTitleInEventLogs
For more information, see Create registry keys.
-
Upgrade the VDA to a baseline version for Citrix Virtual Apps and Desktops 7 2203 LTSR or later. For more information, see Citrix Virtual Apps and Desktops 7 2203 baseline components.
-
Wait for 24 hours. The configuration is pushed automatically within 24 hours. If the configuration is already completed, then you need not wait.
-
Start a desktop session using Citrix Workspace app. All the triggered print events using the client printer are visible on the Search page in Citrix Analytics for Security.
Enable print telemetry for a new physical VDA
- Create a physical VM and change the domain to the required domain name.
- Log in to the VM and enable the print service logs by adding the following registry keys:
- Microsoft-Windows-PrintService/Operational
- ShowJobTitleInEventLogs
For more information, see Create registry keys.
- Install the VDA version for Citrix Virtual Apps and Desktops 7 2203 LTSR release or later. While installing VDA, select the Remote PC Access option.
-
Create a machine catalog. For more information, see Create machine catalogs.
Note
Machine management must be selected as Machines that are not power managed (for example, physical machines).
-
Create a delivery group and add the machine catalog. For more information, see Create delivery groups.
-
Wait for 24 hours. The configuration is pushed automatically within 24 hours by the group policy engine.
- Start a desktop session using Citrix Workspace app. All the triggered print events using the client printer are visible in the Search page in Citrix Analytics for Security.
Create registry keys
In your VDA, do one of the following options:
-
Create registry keys manually. Use this method for master VDAs and having a smaller number of physical VDAs in your deployment.
-
Create registry keys by using group policy object (GPO). Use this method when your deployment has a greater number of physical VDA machines and must enable the print telemetry in all of them.
Registry keys details
| SL | Registry key name | Purpose of the key | Registry details |
|---|---|---|---|
| 1 | Microsoft-Windows-PrintService/Operational | Enables print service logs in the event viewer. | Registry path: HKLM:\SYSTEM\CurrentControlSet\Services\EventLog |
| 2 | ShowJobTitleInEventLogs | Controls whether the print job name is included in print event logs, otherwise considers the generic job name “Print Document. | Registry Hive: HKEY_LOCAL_MACHINE |
| Registry Path: Software\Policies\Microsoft\Windows NT\Printers | |||
| Value Name: ShowJobTitleInEventLogs | |||
| Value Type: REG_DWORD | |||
| Value: 1 |
Create registry keys manually in a VDA machine
Use this approach to create the registry key in the VDA master image. Adding keys to the master image helps to keep the keys persistent for all types of VDAs that are created by using the master image.
- Sign in to the VDA master machine.
- Open Run and type Regedit to open the Windows registry.
- Go to location HKEY_LOCAL_MACHINE\SYSTEM\CurrentControlSet\Services\EventLog
-
Right-click EventLog and select New > Key.
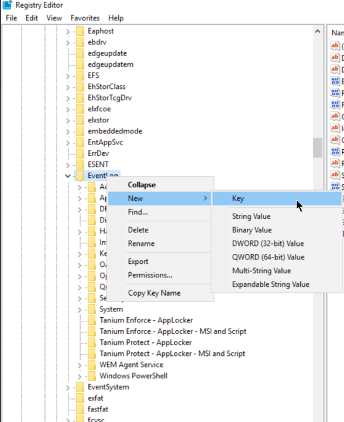
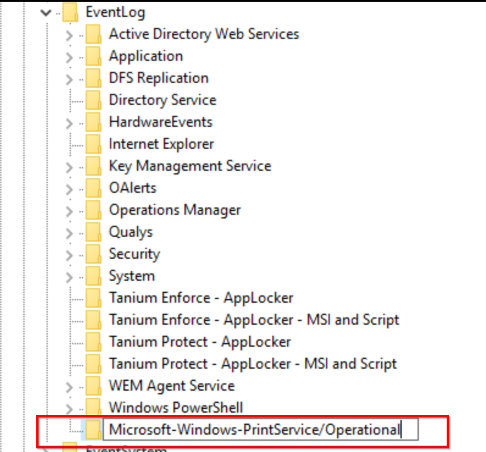
-
Create a key with the name Microsoft-Windows-PrintService/Operational. This key enables the print service logs.
-
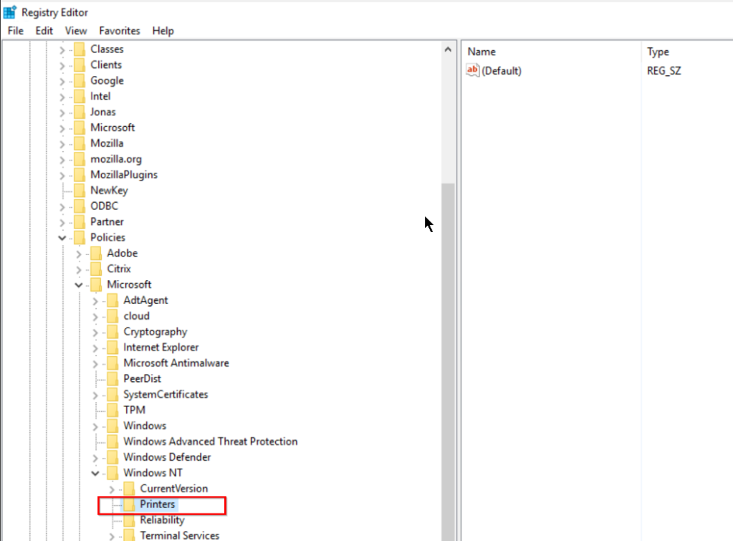
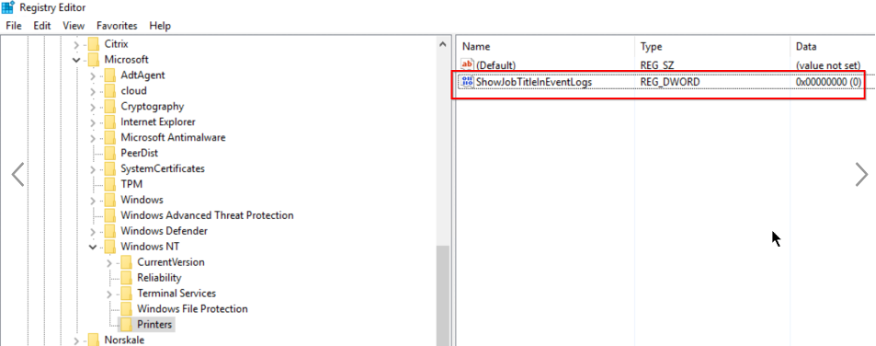
Go to the location HKEY_LOCAL_MACHINE\Software\Policies\Microsoft\Windows NT\Printers.
Note
If the Printers folder is not available, then create a key with the name Printers in the Windows NT folder.
-
Right-click the Printers folder and select New > DWORD (32-bit) Value.
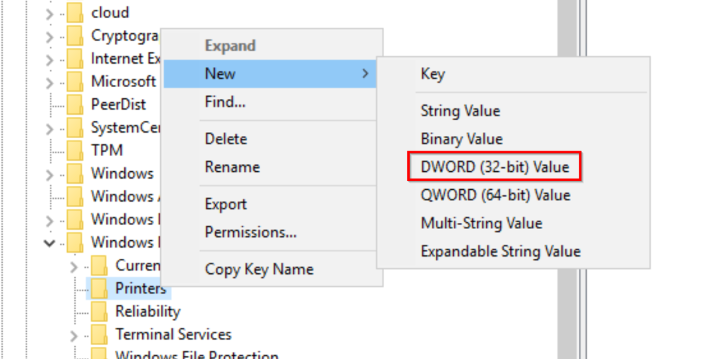
-
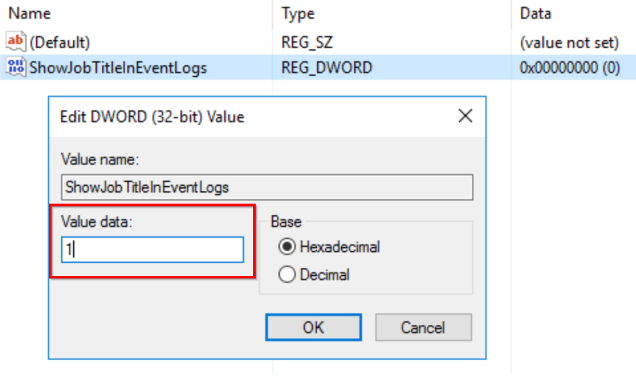
Create a value with the name ShowJobTitleInEventLogs.
-
Right-click ShowJobTitleInEventLogs and select Modify. Enter the Value data as 1 and click OK.
Create registry keys in multiple VDAs using GPO
This approach works only for the persistent VDAs and requires restart of the VDAs after creation of the registry keys. A persistent VDA is a machine that maintains its state after a restart. The users’ data are not lost after the restart.
Create registry GPO with the registry keys
-
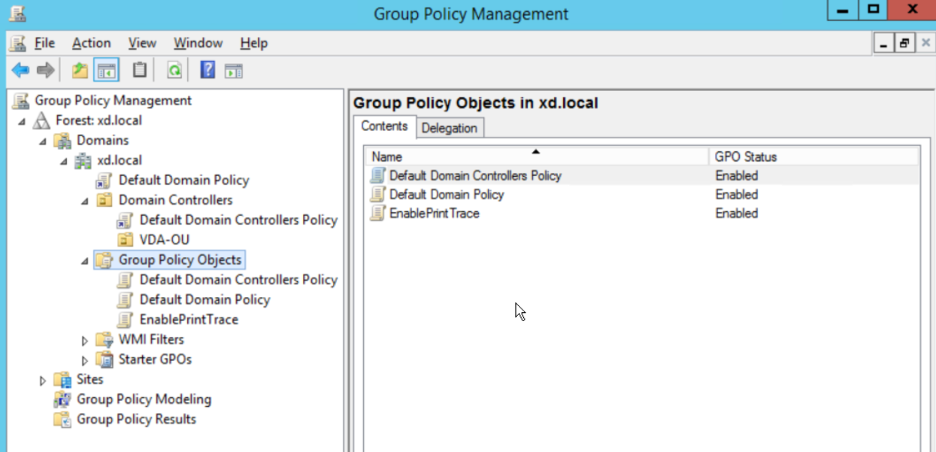
Open Group Policy Management and right-click Group Policy Objects.
-
In the New GPO window, enter the values in the following fields:
- Name: Enable Print Trace
- Source Starter GPO: (none)
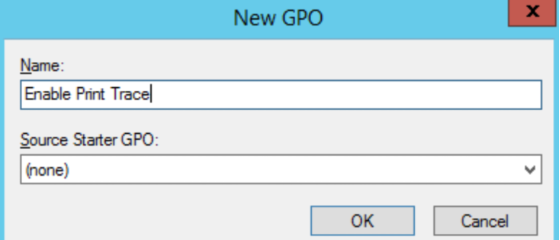
- Select OK.
-
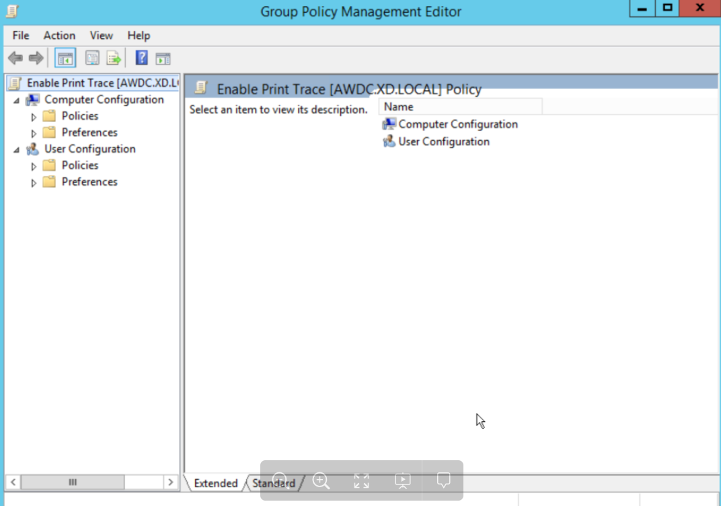
Right-click the Enable Print Trace object that you created and select Edit.
-
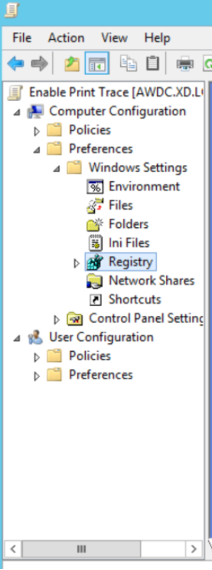
In the Computer Configuration list, select Preferences > Windows Settings.
-
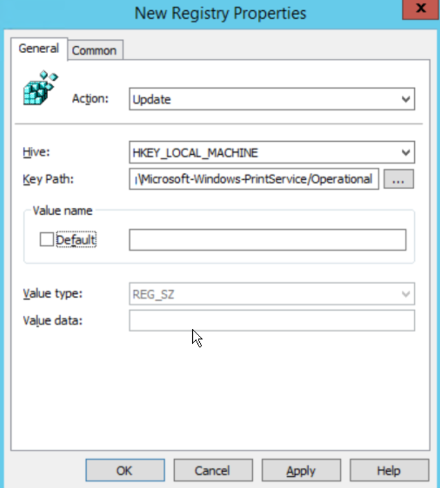
Right-click Registry, select New > Registry Item. Enter the following properties to enable print logs:
- Action: Update
- Hive: HKEY_LOCAL_MACHINE
- Key Path: SYSTEM\CurrentControlSet\Services\EventLog\Microsoft-Windows-PrintService/Operational
-
Select Apply and then select OK.
-
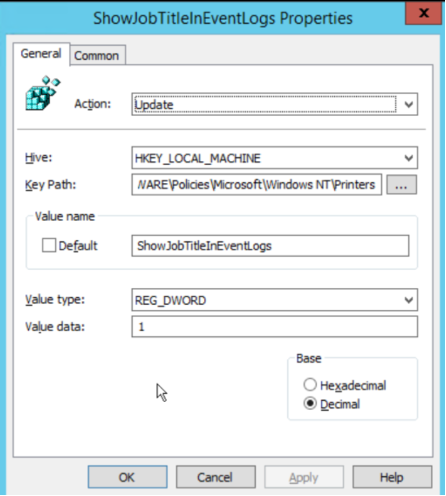
Again, right-click Registry, select New > Registry Item. Enter the following properties to enable print job names:
- Action: Update
- Hive: HKEY_LOCAL_MACHINE
- Key Path: SOFTWARE\Policies\Microsoft\Windows NT\Printers
- Value Name: ShowJobTitleInEventLogs
- Value Type: REG_DWORD
- Value Data: 1
- Base: Decimal
Enable print trace for the organizational unit
-
Open Group Policy Management and select the domain (for example - xd.local) or the OU if VDAs are part of it (for example - VDA-OU).
-
Right-click the domain (xd.local) or OU (VDA-OU) and select Link an Existing GPO.
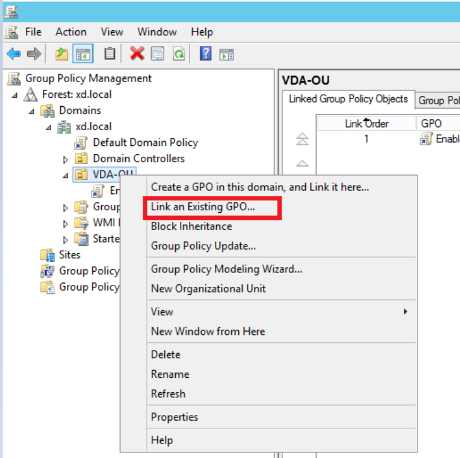
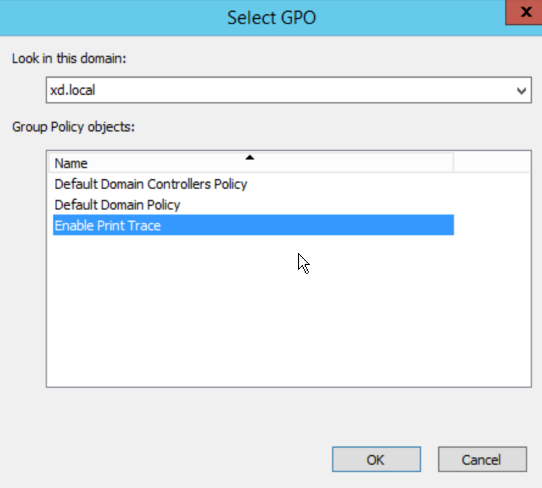
-
In the Select GPO dialog box, select Enable Print Trace and select OK.
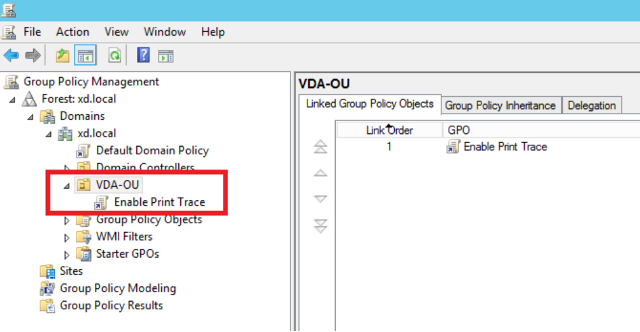
-
Verify that the Enable Print Trace GPO is linked to the OU.
Note
- When you do a VDA restart, any events in the queue are lost and will not be available in Citrix Analytics.
- This restart has a low impact on a single session VDA because only one session can be active at a given time, accordingly the number of events are less.
- This restart has a high impact on a multi-session VDA as all the active sessions are terminated during the restart and the events that are in the queue are lost.
Enabling clipboard telemetry for Citrix DaaS
Citrix DaaS (formerly known as Citrix Virtual Apps and Desktops service) allows users to perform clipboard operations, and the related logs can be viewed in Citrix Analytics for Security. These clipboard logs provide valuable information such as the VDA name, clipboard size, clipboard format type, client IP, clipboard operation, clipboard operation direction, and whether the clipboard operation was permitted.
As a security administrator, you can use these logs for risk analysis and investigations by selecting the Apps and Desktops data source on the Search page in Citrix Analytics for Security.
Note
- By default, the collection and transmission of these clipboard logs is enabled on the Virtual Delivery Agents (VDAs).
- This configuration is only applicable for the Windows VDAs.
Prerequisites
- Your VDA version must be the same as the baseline version for Citrix Virtual Apps and Desktops 7 2305 or later. For more information, see Citrix Virtual Apps and Desktops 7 2305.
- Ensure that the Client Clipboard Redirection setting on the Web Studio Policies page is not configured to a prohibited state. For more information, see Client clipboard redirection.
You can use the Clipboard place metadata collection for Security monitoring policy to enable or disable the clipboard telemetry. By default, this policy is enabled. To disable, you must go to the Policy page > select Security under the VDA Data Collection > check the policy > click Disable.
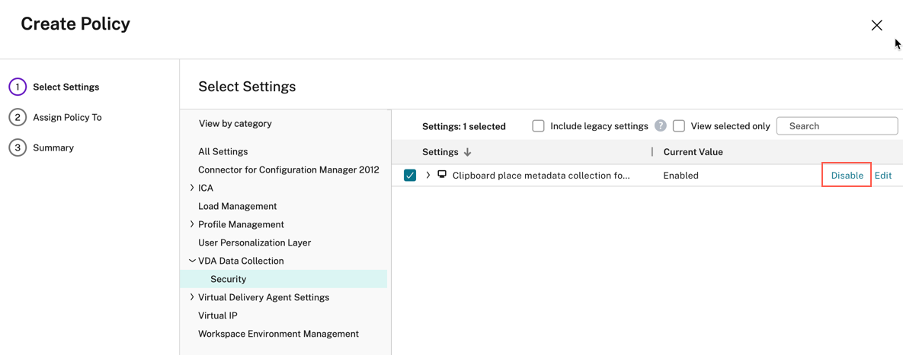
For more information, see Clipboard place metadata collection for Security monitoring.
Turn on or off data processing on the data source
You can stop the data processing at any time for a particular data source- Director and Workspace app. On the data source site card, click the vertical ellipsis (⋮) > Turn off data processing. Citrix Analytics stops processing data for that data source. You can also stop the data processing from the Apps and Desktops site card. This option applies to both data sources- Director and Workspace app.
To enable data processing again, click Turn On Data Processing.
In this article
- Supported client versions
- Enable Analytics on Citrix DaaS
- Enable Analytics on Citrix Virtual Apps and Desktops on-premises
- Connect to Citrix Director for on-premises sites
- Connect to Session Recording deployment
- Enabling print telemetry for Citrix DaaS
- Enabling clipboard telemetry for Citrix DaaS
- Turn on or off data processing on the data source