-
-
-
-
-
View graphical event statistics for each recording
-
This content has been machine translated dynamically.
Dieser Inhalt ist eine maschinelle Übersetzung, die dynamisch erstellt wurde. (Haftungsausschluss)
Cet article a été traduit automatiquement de manière dynamique. (Clause de non responsabilité)
Este artículo lo ha traducido una máquina de forma dinámica. (Aviso legal)
此内容已经过机器动态翻译。 放弃
このコンテンツは動的に機械翻訳されています。免責事項
이 콘텐츠는 동적으로 기계 번역되었습니다. 책임 부인
Este texto foi traduzido automaticamente. (Aviso legal)
Questo contenuto è stato tradotto dinamicamente con traduzione automatica.(Esclusione di responsabilità))
This article has been machine translated.
Dieser Artikel wurde maschinell übersetzt. (Haftungsausschluss)
Ce article a été traduit automatiquement. (Clause de non responsabilité)
Este artículo ha sido traducido automáticamente. (Aviso legal)
この記事は機械翻訳されています.免責事項
이 기사는 기계 번역되었습니다.책임 부인
Este artigo foi traduzido automaticamente.(Aviso legal)
这篇文章已经过机器翻译.放弃
Questo articolo è stato tradotto automaticamente.(Esclusione di responsabilità))
Translation failed!
View graphical event statistics for each recording
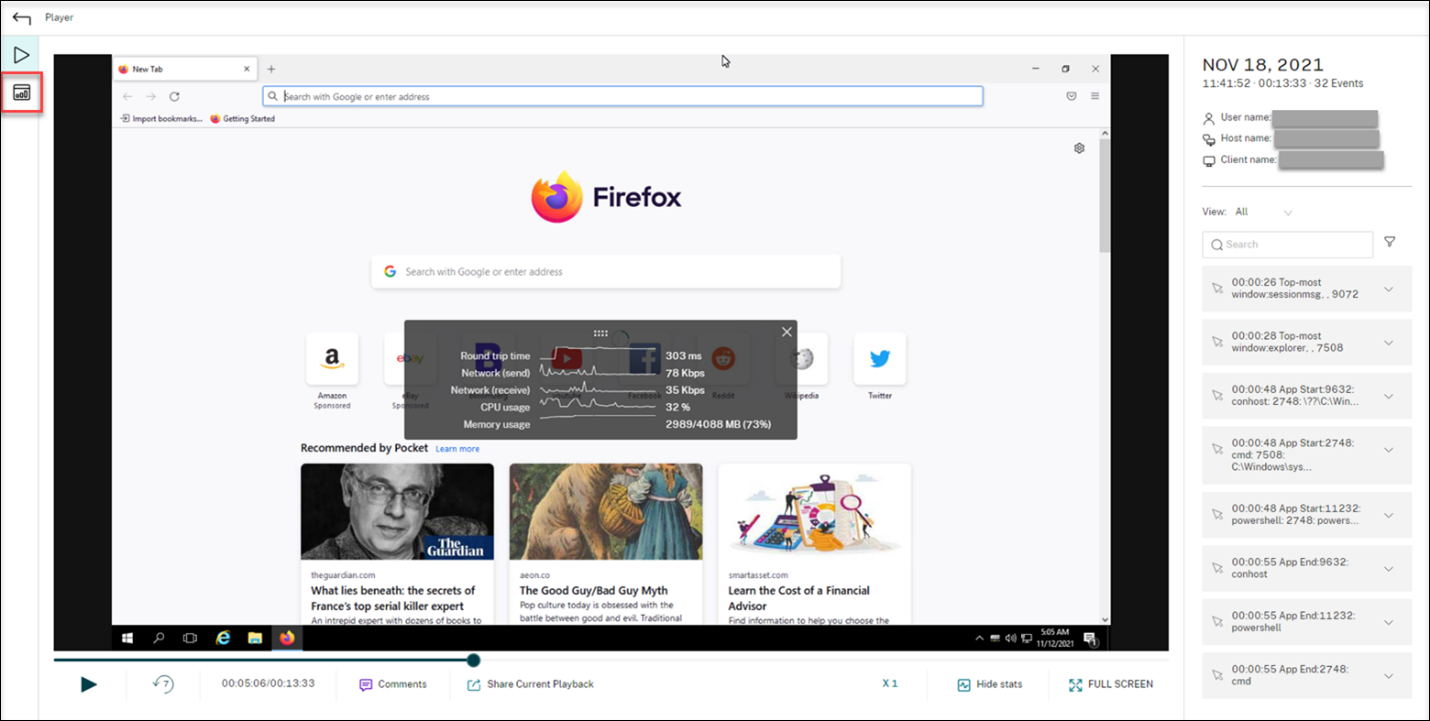
Event data visualization is available in the web player for each recording. It provides graphical event statistics for you to quickly comprehend the events inserted in recordings.
To view graphical event statistics, complete the following steps:
-
Open and play a recording.
-
In the upper left corner of the playback page, click the statistics icon.
-
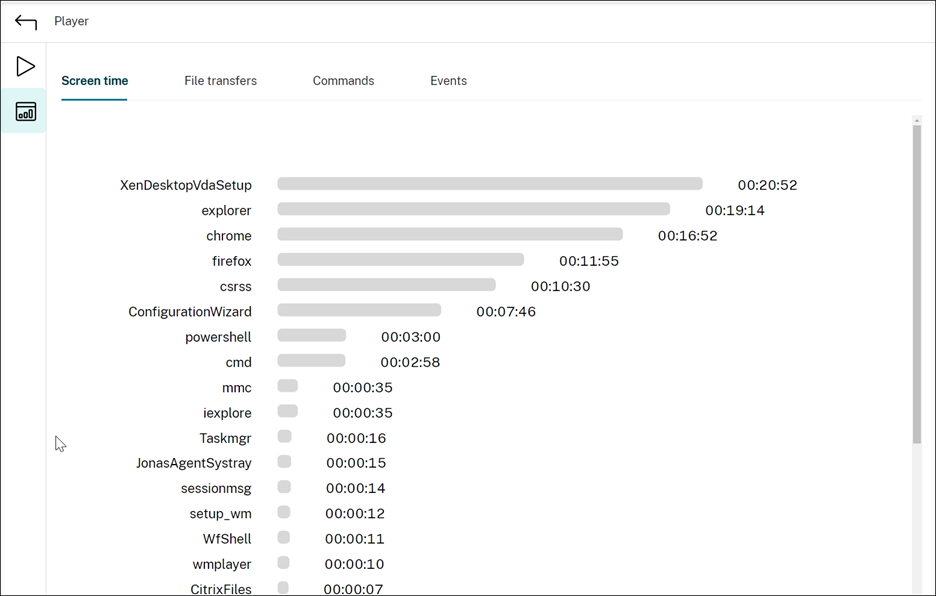
Switch between the Screen time, File transfers, Commands, and Events tabs to view statistics from different perspectives.
-
Screen time
The Screen time tab lets you know the cumulative time an application window is in focus (active window).
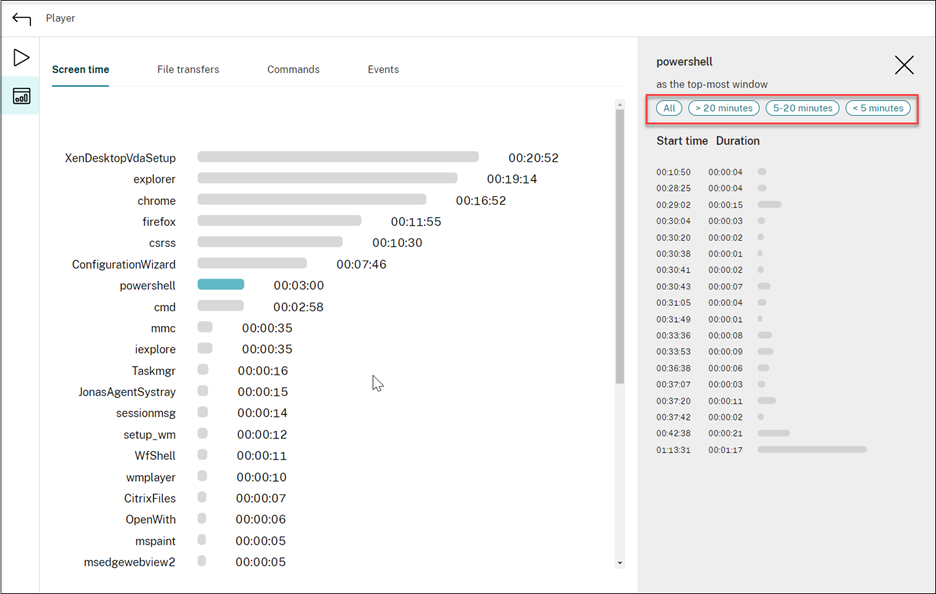
There is a horizontal time bar next to each application. Click the bar to view the start time and duration each time an application becomes and stays in focus, respectively. You can narrow down your search range by specifying a duration range other than the default All option. For example:
-
File transfers
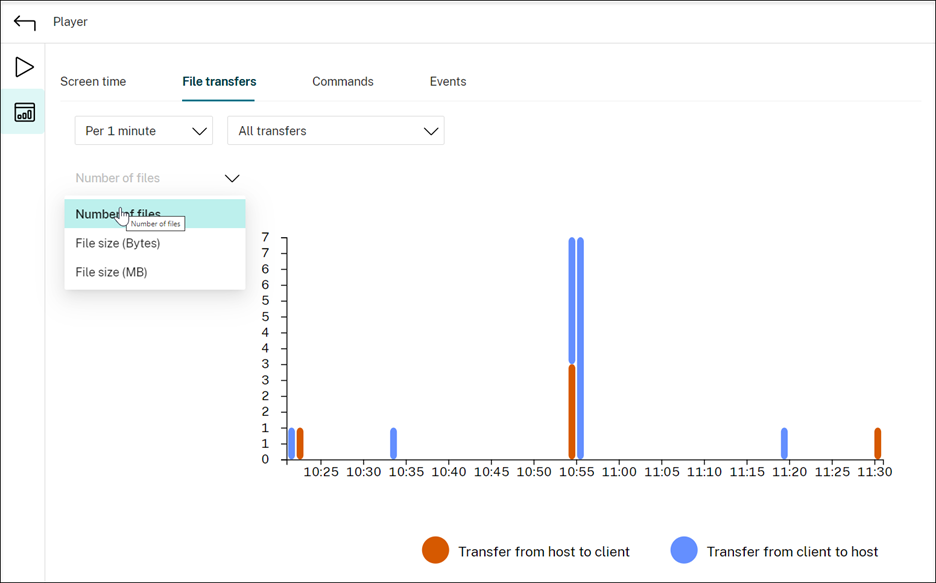
The File transfers tab provides graphical statistics about bidirectional file transfers between the VDA hosting the recorded session and the client device where the session runs. You can customize the visualization by using the following settings:
- Time granularity: Per 1 minute, Per 10 minutes, Per hour
- File transfer destination: All transfers, Transfer from host to client, Transfer from client to host
- Number or size (Bytes or MB) of transferred files
The X axis represents the absolute time in the 24-hour system.
-
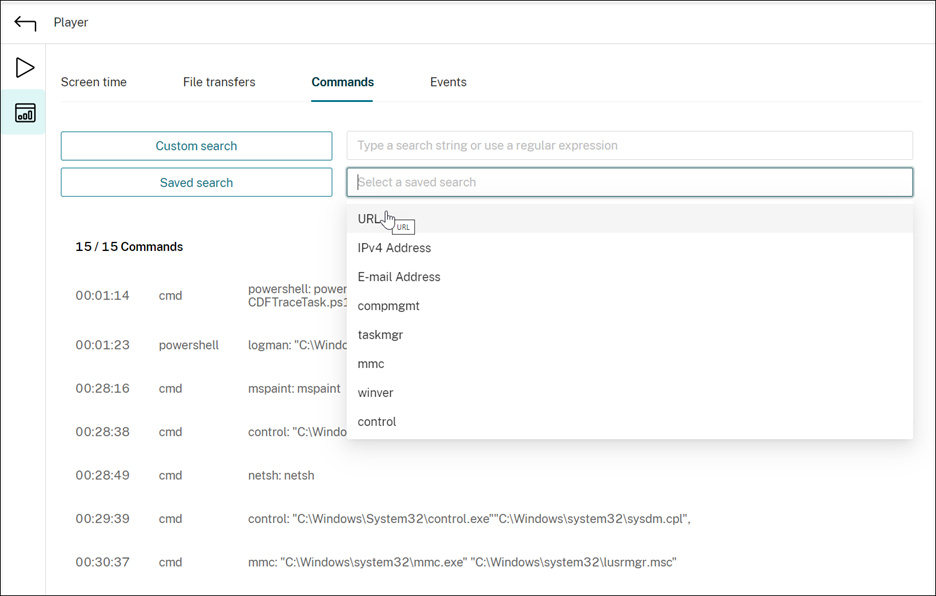
Commands
The Commands tab shows CMD and PowerShell commands that are run during the recorded session. You can customize the data display by typing your custom search in Custom search or selecting a saved search from Saved search. The “OR” logical operator is used to compute the final action.
-
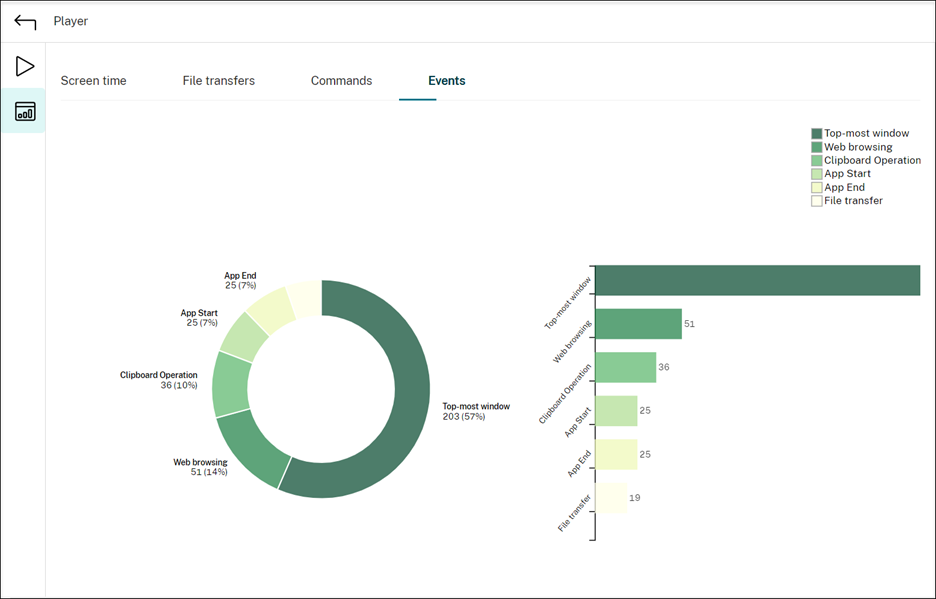
Events
The Events tab shows the proportions and numbers of all types of events in the recorded session.
-
Share
Share
In this article
This Preview product documentation is Citrix Confidential.
You agree to hold this documentation confidential pursuant to the terms of your Citrix Beta/Tech Preview Agreement.
The development, release and timing of any features or functionality described in the Preview documentation remains at our sole discretion and are subject to change without notice or consultation.
The documentation is for informational purposes only and is not a commitment, promise or legal obligation to deliver any material, code or functionality and should not be relied upon in making Citrix product purchase decisions.
If you do not agree, select I DO NOT AGREE to exit.