This content has been machine translated dynamically.
Dieser Inhalt ist eine maschinelle Übersetzung, die dynamisch erstellt wurde. (Haftungsausschluss)
Cet article a été traduit automatiquement de manière dynamique. (Clause de non responsabilité)
Este artículo lo ha traducido una máquina de forma dinámica. (Aviso legal)
此内容已经过机器动态翻译。 放弃
このコンテンツは動的に機械翻訳されています。免責事項
이 콘텐츠는 동적으로 기계 번역되었습니다. 책임 부인
Este texto foi traduzido automaticamente. (Aviso legal)
Questo contenuto è stato tradotto dinamicamente con traduzione automatica.(Esclusione di responsabilità))
This article has been machine translated.
Dieser Artikel wurde maschinell übersetzt. (Haftungsausschluss)
Ce article a été traduit automatiquement. (Clause de non responsabilité)
Este artículo ha sido traducido automáticamente. (Aviso legal)
この記事は機械翻訳されています.免責事項
이 기사는 기계 번역되었습니다.책임 부인
Este artigo foi traduzido automaticamente.(Aviso legal)
这篇文章已经过机器翻译.放弃
Questo articolo è stato tradotto automaticamente.(Esclusione di responsabilità))
Translation failed!
Troubleshoot machines
In the Filters > Machines view, select Desktop OS Machines or Server OS Machines to see the machines configured in the Site. The Server OS Machines tab includes the load evaluator index , which indicates the distribution of performance counters and tool tips of the session count if you hover over the link.
Click the Failure Reason of a failed machine to get a detailed description of the failure and actions recommended to troubleshoot the failure. The failure reasons and the recommended actions for machine and connection failures are available in the Citrix Director 7.12 Failure Reasons Troubleshooting Guide.
Click the machine name link to go to the Machine Details page. The Machine Details page lists the machine details, infrastructure details, and details of the hotfixes applied on the machine. The Machine Utilization panel displays the machine utilization graphs.
Machine-based real-time resource utilization
The Machine Utilization panel displays graphs showing real-time utilization of CPU and memory . In addition, disk and GPU monitoring graphs are available for Sites with Delivery Controller(s) and VDA versions 7.14 or later.
Disk monitoring graphs, average IOPS, and disk latency are important performance measurements that help you monitor and troubleshoot issues related to VDA disks. The Average IOPS graph displays the average number of reads and writes to a disk. Select Disk Latency to see a graph of the delay between a request for data and its return from the disk, measured in milliseconds.
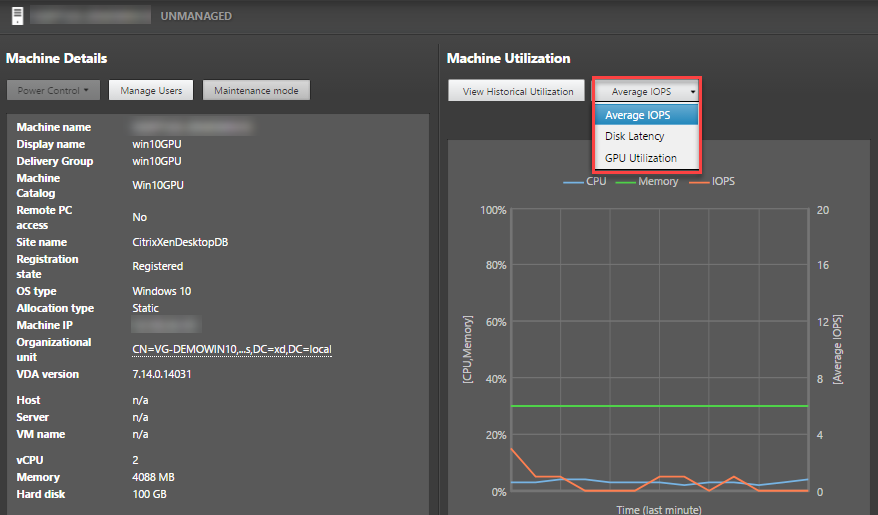
Select GPU Utilization to see percentage utilization of the GPU, the GPU memory, and of the Encoder and the Decoder to troubleshoot GPU-related issues on Server or Desktop OS VDAs. The GPU Utilization graphs are available only for VDAs running 64-bit Windows with NVIDIA Tesla M60 GPUs, and running Display Driver version 369.17 or later. The VDAs must have HDX™ 3D Pro enabled to provide GPU acceleration. For more information, see GPU acceleration for Windows Desktop OS and GPU acceleration for Windows Server OS. When a VDA accesses more than one GPU, the utilization graph displays the average of the GPU metrics collected from the individual GPUs. The GPU metrics are collected for the entire VDA and not for individual processes.
Machine-based historical resource utilization
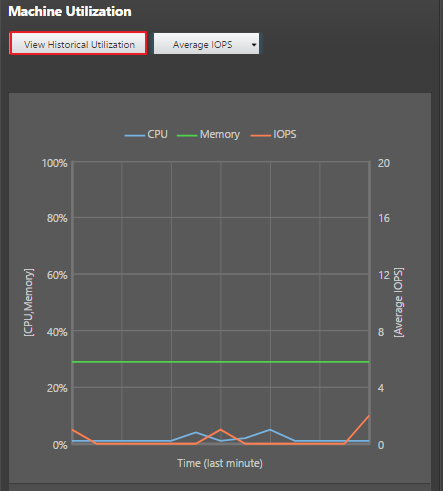
In the Machine Utilization panel, click View Historical Utilization to view the historical usage of resources on the selected machine. The utilization graphs include critical performance counters of CPU, memory, peak concurrent sessions, average IOPS, and disk latency.
Note: The Monitoring policy setting, Enable Process Monitoring, must be set to Allowed to collect and display data in the Top 10 Processes table on the Historic Machine Utilization page. The collection is prohibited by default.
The CPU and memory utilization, average IOPS, and disk latency data is collected by default. You can disable the collection by using the Enable Resource Monitoring policy setting.
-
From the Machine Utilization panel in the Machine Details view, select View Historical Utilization. This opens the Historical Machine Utilization page.
-
Set Time Period to view usage for the last 2 hours, 24 hours, 7 days, month, or year. Note: Average IOPS and disk latency usage data are available only for the last 24 hours, month, and year ending now. Custom end time is not supported.
-
Click Apply and select the required graphs.
-
Hover over different sections of the graph to view more information for the selected time period.
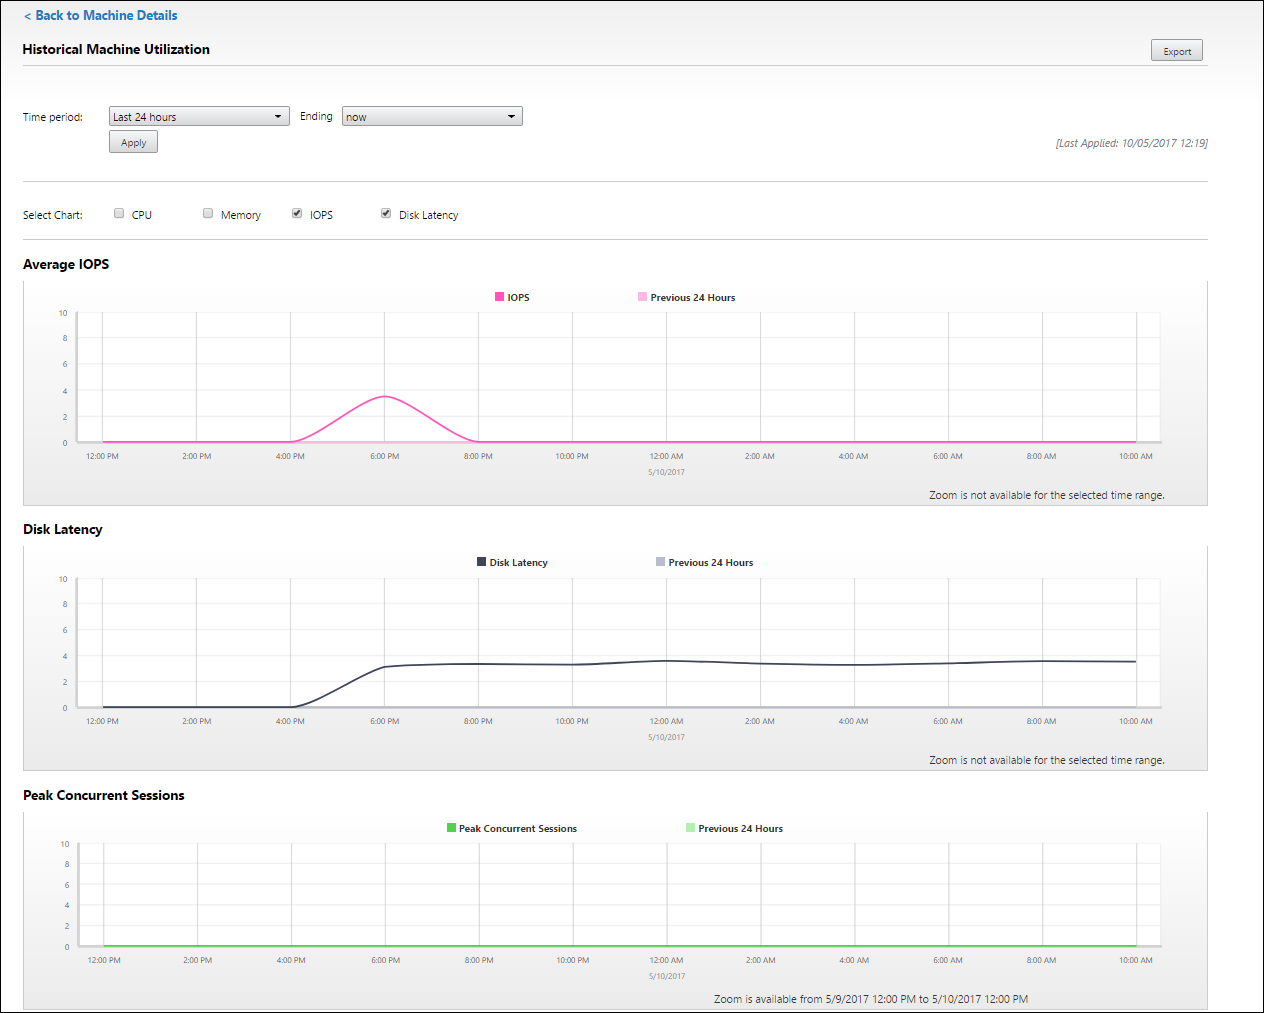
For example, if you select Last 2 hours, the baseline period is the 2 hours prior to the selected time range. View the CPU, memory, and session trend over the last 2 hours and the baseline time. If you select Last month, the baseline period is the previous month. Select to view the Average IOPS and disk latency over the last month and the baseline time.
-
Click Export to export the resource utilization data for the selected period. For more information, see Export reports section in Monitor Deployments.
-
Below the graphs, the table lists the top 10 processes based on CPU or memory utilization. You can sort by any of the columns, which show Application Name, User Name, Session ID, Average CPU, Peak CPU, Average Memory, and Peak Memory over the selected time range. The IOPS and Disk Latency columns cannot be sorted.
Note: The session ID for system processes is displayed as “0000”.
-
To view the historical trend on the resource consumption of a particular process, drill into any of the Top 10 processes.
Share
Share
This Preview product documentation is Citrix Confidential.
You agree to hold this documentation confidential pursuant to the terms of your Citrix Beta/Tech Preview Agreement.
The development, release and timing of any features or functionality described in the Preview documentation remains at our sole discretion and are subject to change without notice or consultation.
The documentation is for informational purposes only and is not a commitment, promise or legal obligation to deliver any material, code or functionality and should not be relied upon in making Citrix product purchase decisions.
If you do not agree, select I DO NOT AGREE to exit.