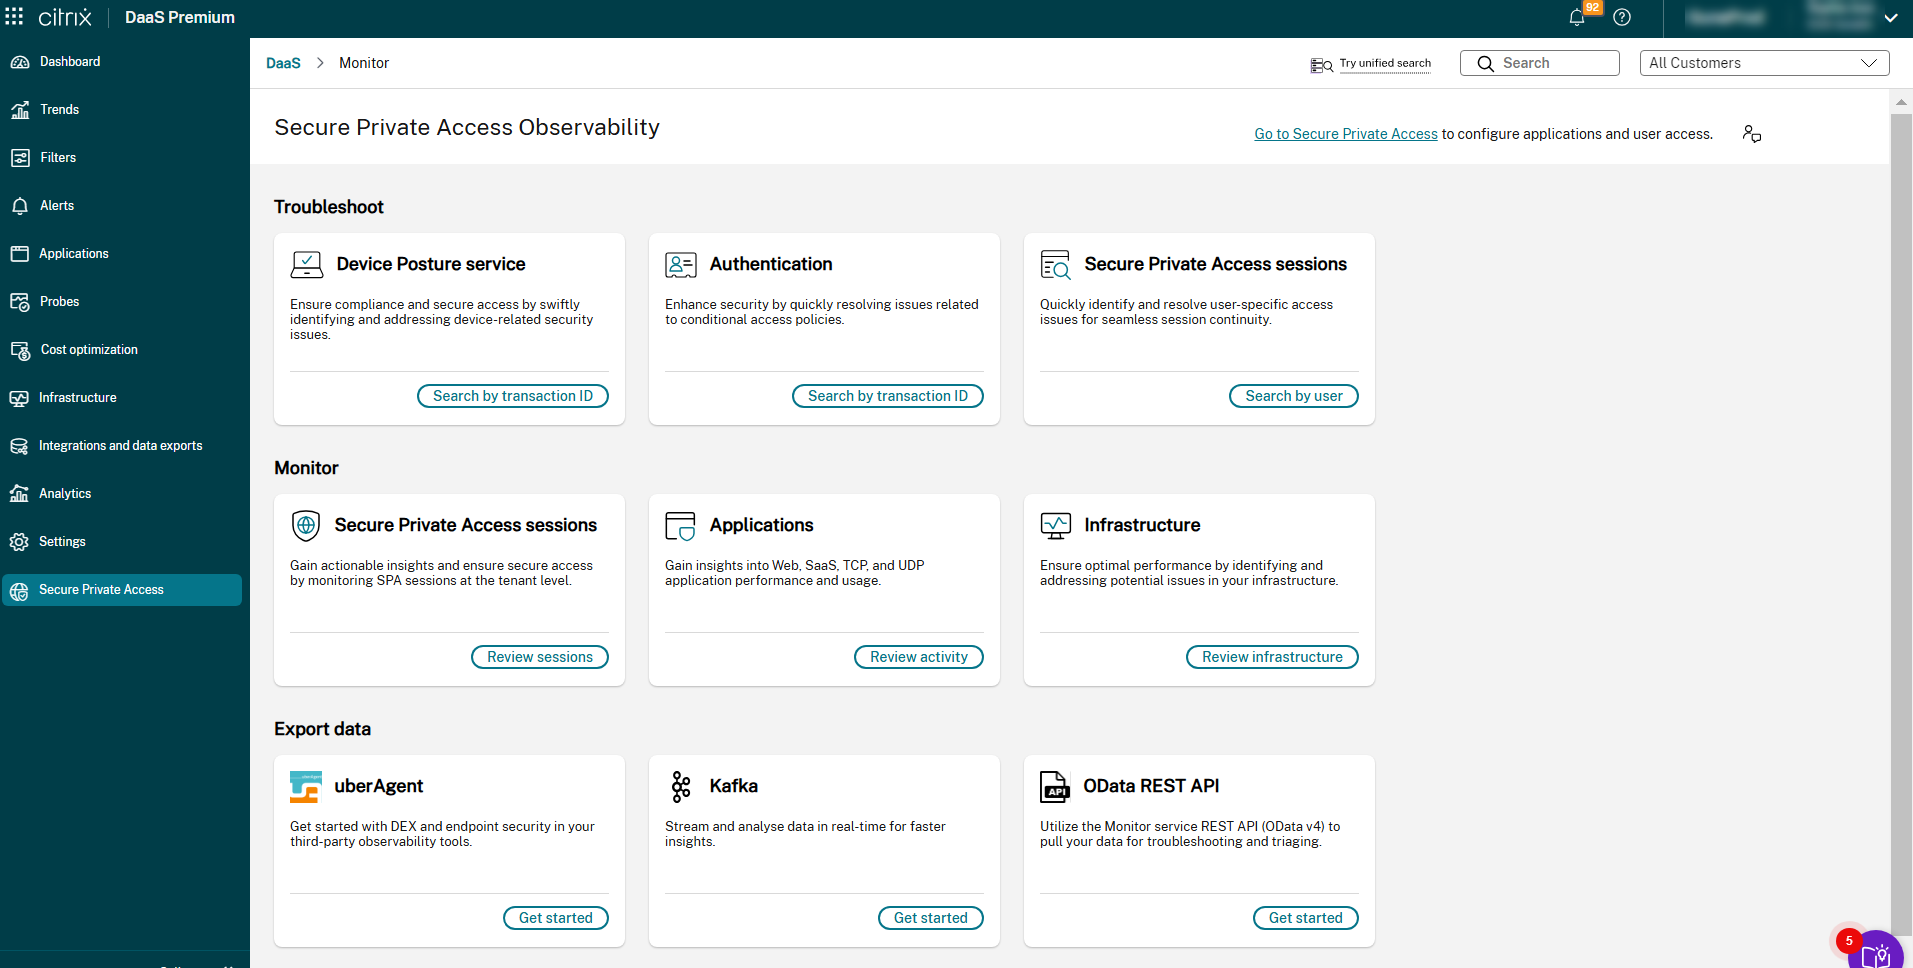
Citrix SecurAccess™ ZTNA tab on Monitor
The SecurAccess ZTNA tab on Monitor provides a dedicated place for all new features related to SecurAccess ZTNA. This tab offers details on the supported functions for SecurAccess ZTNA, giving administrators a central location to access and manage these features.
Key benefits
-
Centralized information: Administrators can easily see all supported troubleshooting features for SecurAccess ZTNA in one place.
-
Enhanced observability: The new left navigation bar in the Monitor UI lists all SecurAccess ZTNA services, including SecurAccess ZTNA sessions, applications, and device posture, providing better observability.
-
Improved navigation: The SecurAccess ZTNA tab includes hyperlinks to different pages, making it easier for administrators to navigate to various features and functions.
Requirements
-
The SecurAccess ZTNA tab is visible to all customer admins.
-
SecurAccess ZTNA-specific cards (SecurAccess ZTNA sessions and applications) are clickable only when the customer has SecurAccess ZTNA entitlement and the admin has SecurAccess ZTNA full admin or read-only admin permissions.
To view the SecurAccess ZTNA page, click the SecurAccess ZTNA tab from the Monitor UI.
Visibility for SecurAccess ZTNA Service
To provide detailed monitoring and visibility for SecurAccess ZTNA applications and users, Monitor is now enhanced to include SecurAccess ZTNA session visibility. The Filters tab and Dashboard provide detailed SecurAccess ZTNA session information.
Key features
-
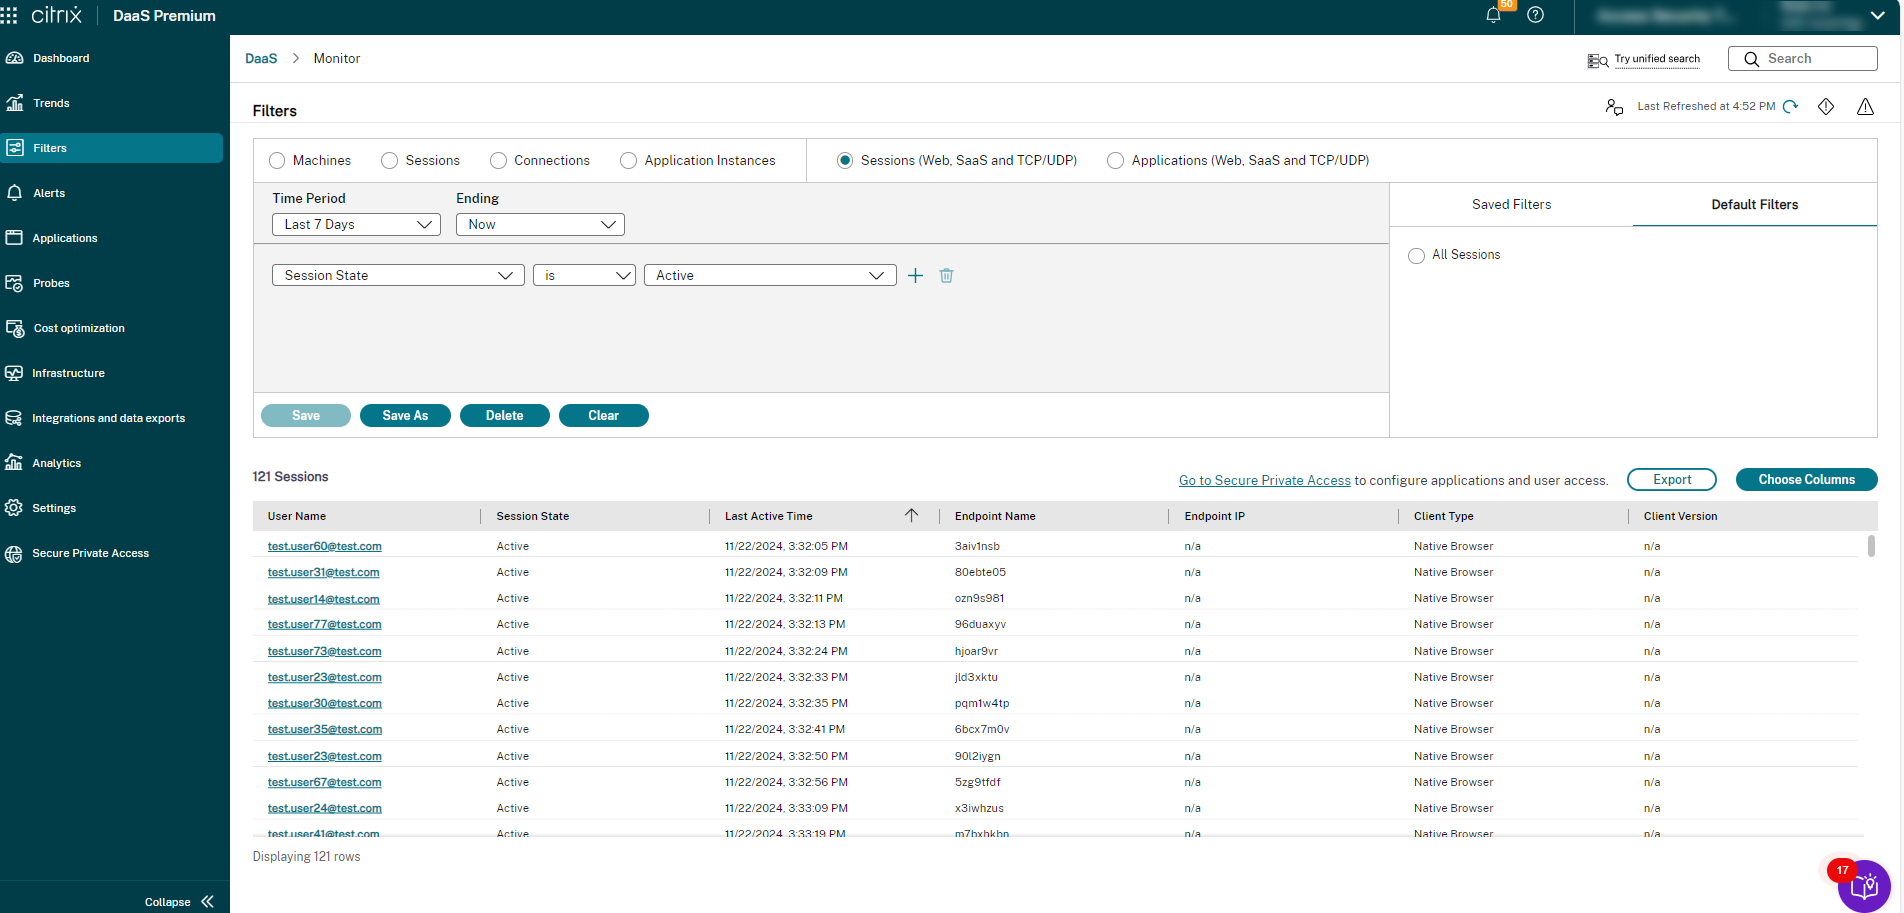
Filter SecurAccess ZTNA Sessions: You can now filter SecurAccess ZTNA sessions in the Filters > Sessions (Web, SaaS, and TCP/UDP) tab.
-
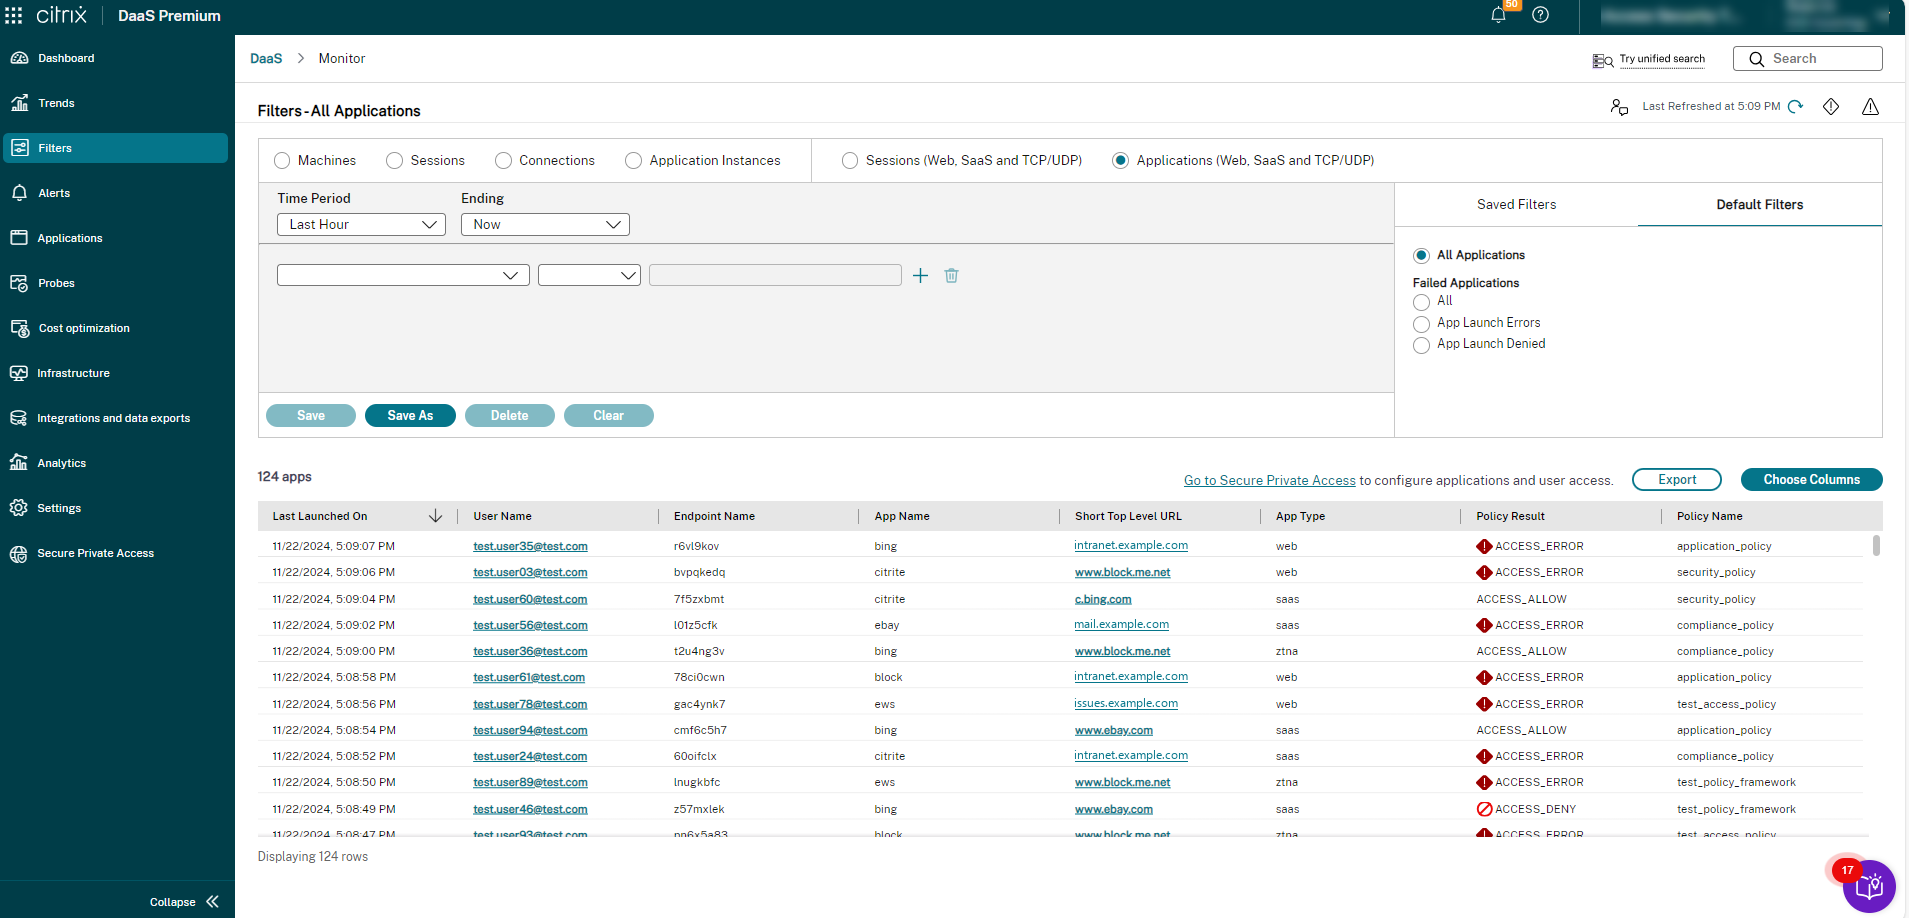
Filter SecurAccess ZTNA Applications: You can also filter SecurAccess ZTNA applications in the Filters > Applications (Web, SaaS, and TCP/UDP) tab.
-
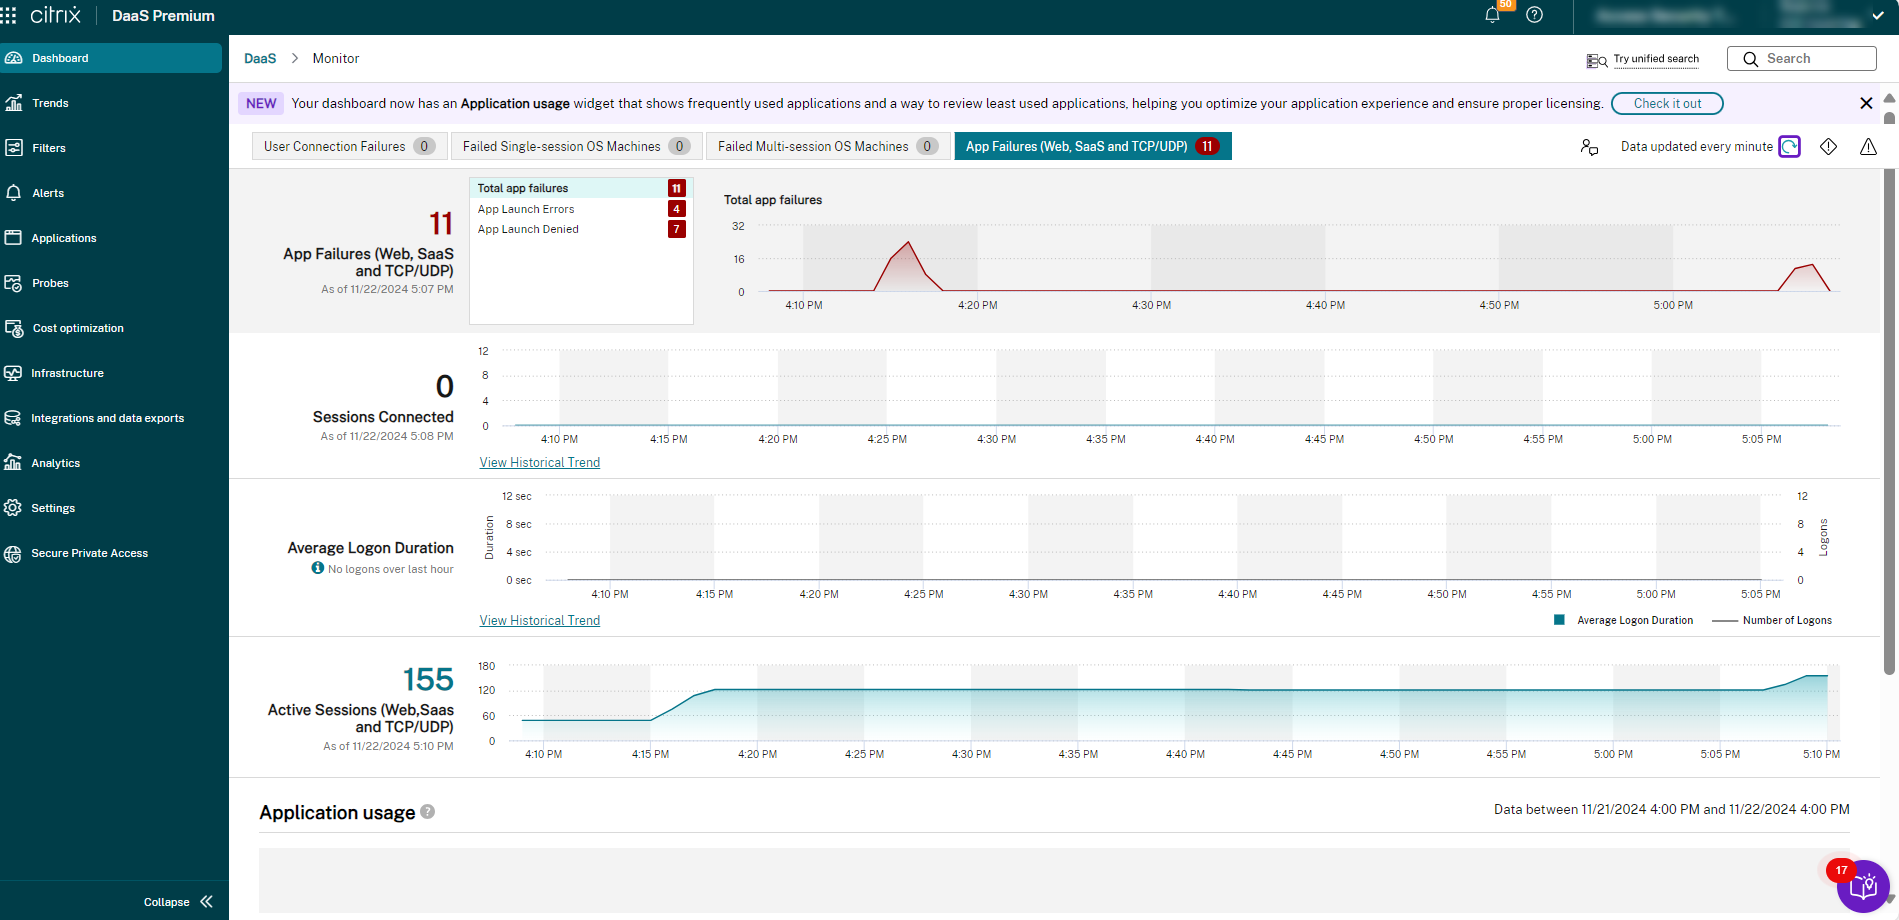
App Failures and Active Sessions: Monitor app failures for web/SaaS and TCP/UDP apps, and view active sessions for web/SaaS apps in the Dashboard.
Dashboard:
Note:
-
The number displayed in the dashboard next to App Failures (Web, SaaS, and TCP/UDP) represents the number of application failures in the last hour.
-
The number displayed in the dashboard next to Active Sessions (Web, SaaS, and TCP/UDP) represents the current number of active SecurAccess ZTNA sessions in the last hour.
Filter all SecurAccess ZTNA Sessions:
Filter all SecurAccess ZTNA Applications: