Infrastructure dashboard
You can see the health values for your components in the Infrastructure Monitoring page. These results help to analyze and troubleshoot issues proactively regarding your infrastructure.
You can filter the Infrastructure Monitoring page by:
- Host name - Select the host name
- Reachability - Select Up (server is reachable) or Down (Server isn’t reachable) checkbox
- Errors - Select Show rows with errors only checkbox.
Use the Manage columns option to choose the data to be seen in your dashboard.
Provisioning Service health metrics
Click the Infrastructure tab and then select Provisioning Service. The Infrastructure dashboard for Provisioning Service appears:
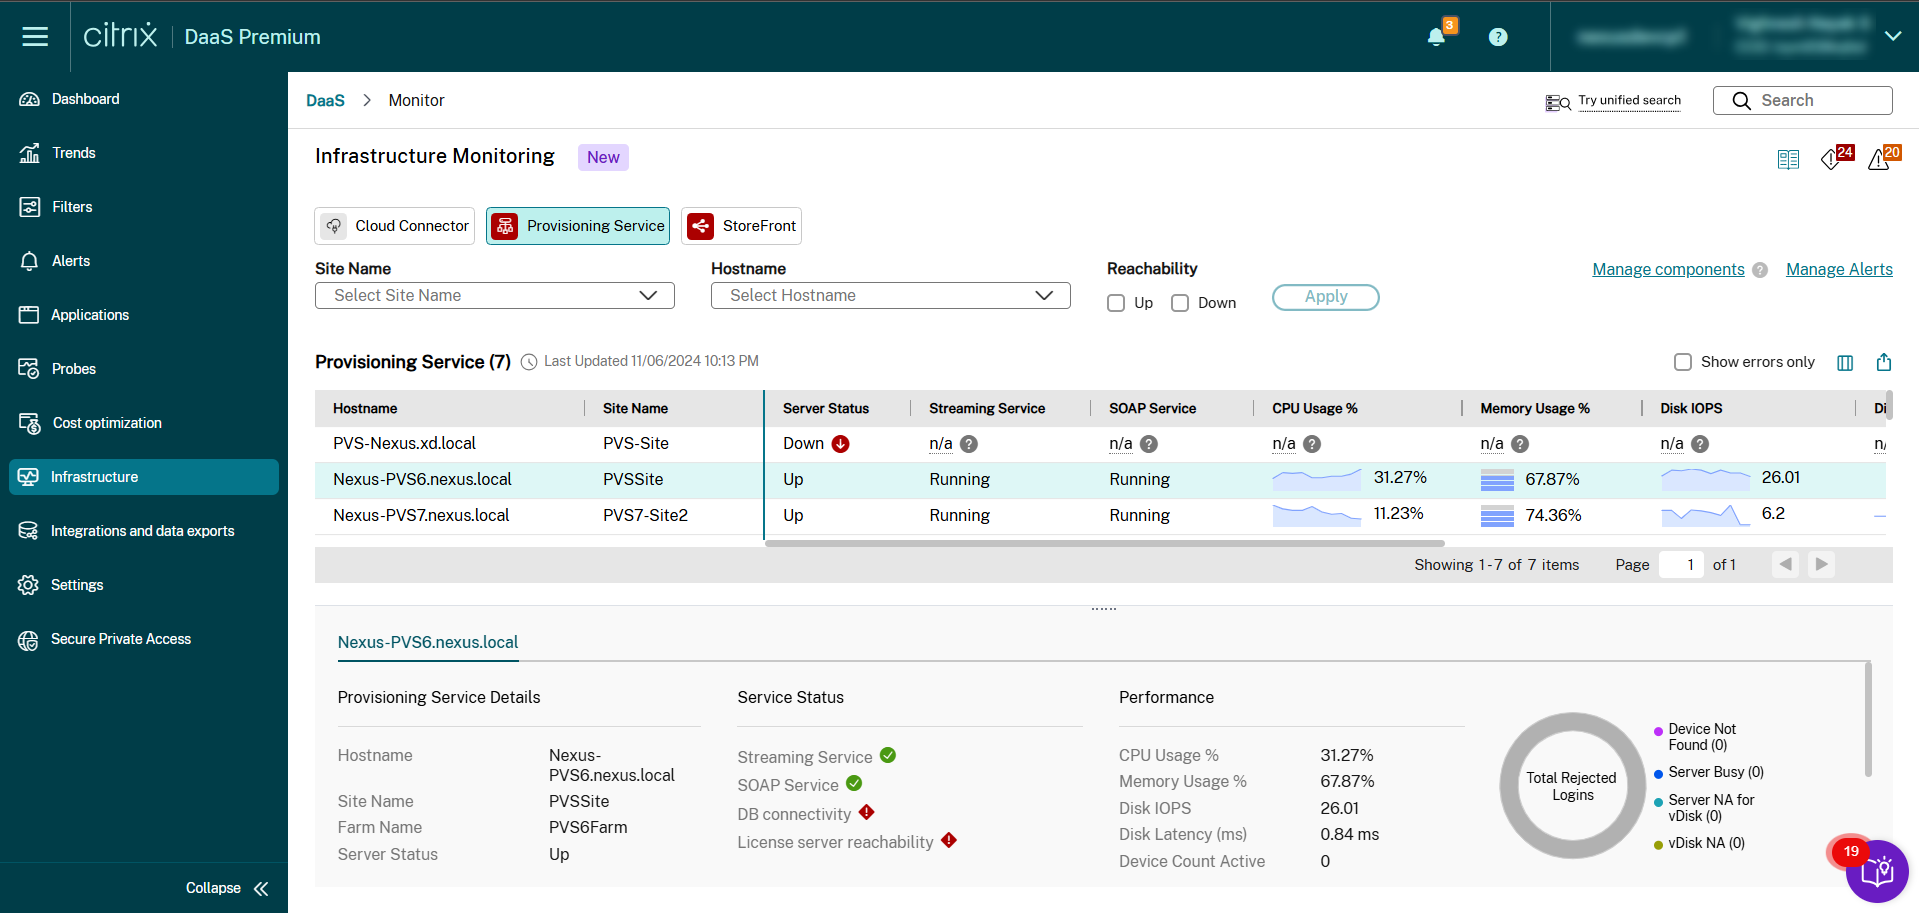
The following details are monitored for Provisioning Service servers:
| Category | Metrics | Description |
|---|---|---|
| Reachability
|
Host name | The name of the Provisioning Service machine where Citrix Infrastructure Monitor is installed. This metric is a string value. |
| Provisioning Service Site Name | The name of the Provisioning Service site. This metric is a string value. | |
| Provisioning Service Farm Name | The name of the Provisioning Service farm. This metric is a string value. | |
| Provisioning Service Site ID | Displays the site ID of the Provisioning Service server. This metric is a string value. | |
| Provisioning Service Farm ID | Displays the farm ID of the Provisioning Service server. This metric is a string value. | |
| Server Status | Shows the reachability state of the given server. Possible values are Up, Down, and Unknown. | |
| Last Boot Time | Displays the time when the Provisioning Service server was last booted. | |
| Last updated | Displays the time when the data was collected from the Provisioning Service server. | |
| Dependent Services
|
Streaming Service | Displays the status of the streaming service. This metric shows the Windows services status. The possible values are: Not running, Running, Not Installed, and n/a (with help icon). |
| SOAP Service | Displays the status of the Simple Object Access Protocol (SOAP) service. This metric shows the Windows services status. The possible values are: Not running, Running, Not Installed, and n/a (with help icon). | |
| DB Connectivity | Displays the status of the database connectivity. If you are using a Citrix Provisioning server version 2402 or earlier, you might get an unknown error. The possible values are Not Connected, Connected, Unknown, and n/a (with help icon). | |
| License Server Reachability | Displays whether the license server is reachable or not. If you’re using the Citrix Provisioning server version 2402 or earlier, you might get an unknown error. The possible values are Not Connected, Connected, Unknown, and n/a (with help icon). | |
| Resource Utilization
|
CPU Usage % | Displays the usage of CPU in percentage using a line chart. The value displayed is the latest one at the end of the last 5 mins. |
| Avg CPU % | Displays the average CPU percentage of the Provisioning Service server aggregated over the last 10 mins. | |
| Peak CPU % | Displays the peak CPU percentage of the Provisioning Service server in the last 5 mins. | |
| Memory Usage % | Displays the usage of memory in percentage using a stack chart. The value displayed is the latest one at the end of the last 5 mins. | |
| Avg Memory % | Displays the average memory percentage of the Provisioning Service server aggregated over the last 10 mins. | |
| Peak Memory % | Displays the peak memory percentage of the Provisioning Service server in the last 5 mins. | |
| Disk IOPS | Displays the input and output value of the disk using a line chart. | |
| Avg Disk IOPS % | Displays the average disk IOPS of the Provisioning Service server aggregated over the last 10 mins. | |
| Peak Disk IOPS % | Displays the peak disk IOPS percentage of the Provisioning Service server in the last 10 mins. | |
| Disk Latency (Ms) | Displays the latency value of the disk using a line chart. | |
| Avg Disk Latency % | Displays the average disk latency of the Provisioning Service server aggregated over the last 10 mins. | |
| Peak Disk Latency % | Displays the peak disk latency percentage of the Provisioning Service server in the last 5 mins. | |
| Impact
|
Total Rejected Logins | Number of total failure logins divided by the number of total logins trials. |
| Device Count Active | Displays the total number of active devices in the Provisioning Service server. This metric is an integer value. |
StoreFront™ health metrics
Click the Infrastructure tab and then select StoreFront. The Infrastructure dashboard for StoreFront appears:
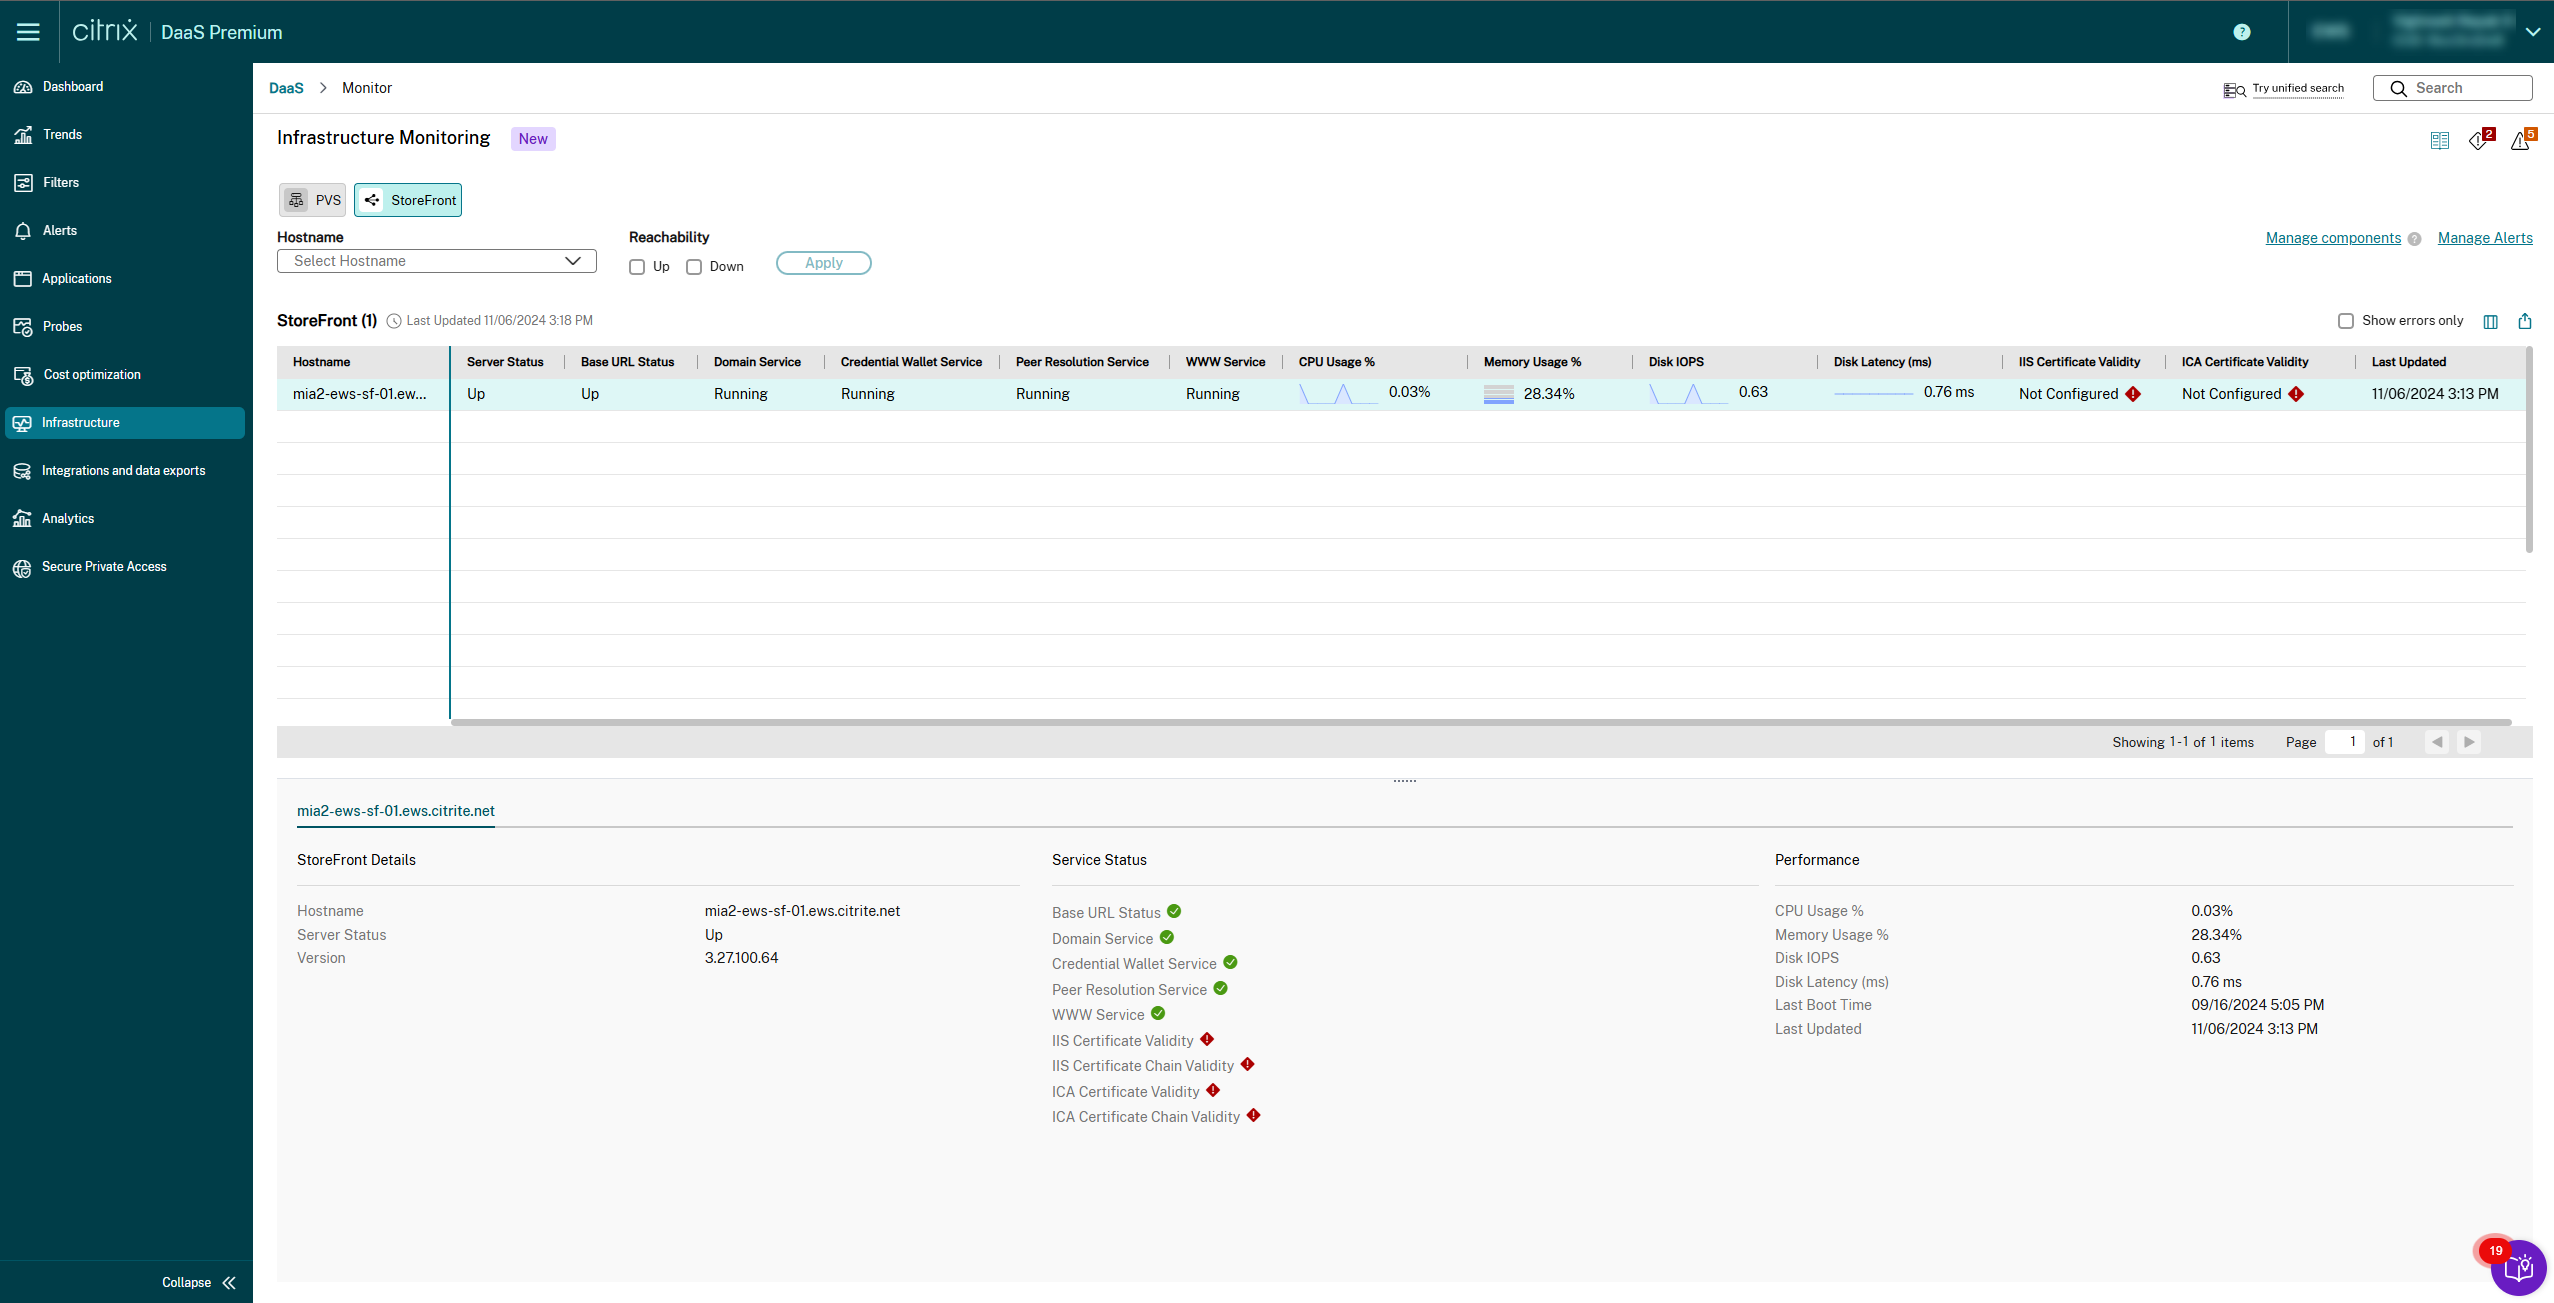
The following details are monitored for StoreFront servers:
| Category | Metrics | Description |
|---|---|---|
| Reachability
|
Host name | Displays the name of the StoreFront server. This metric is a string value. |
| Server Status | Displays the status of the StoreFront server. This metric shows the Windows services status. The possible values are: Not running, Running, Not Installed, and n/a (with help icon). | |
| Base URL Status | Displays the health of the base URL. If the HTTP status code is 200, the status is UP. Else, the value is Down. | |
| Last Boot Time | Displays the time when the StoreFront server was last booted. | |
| Last updated | Displays the time when the data was collected from the StoreFront server. | |
| Dependent Services
|
Domain Service | Health of windows service named as domain service. This metric shows the Windows services status. The possible values are: Not running, Running, Not Installed, and n/a (with help icon). |
| Credential Wallet Service | This service is a windows service that is used for storing encrypted passwords. The possible values are: Not running, Running, Not Installed, and n/a (with help icon). | |
| Peer Resolution Service | This service is a windows service which is responsible for inter-server group network communication forming a peer mesh of StoreFront servers. The possible values are: Not running, Running, Not Installed, and n/a (with help icon). | |
| WWW Service | This metric is the web service of the StoreFront server. This metric shows the Windows services status. The possible values are: Not running, Running, Not Installed, and n/a (with help icon). | |
| Resource Utilization
|
CPU Usage % | Displays the usage of CPU in percentage using a line chart. The value displayed is the latest one at the end of the last five mins. |
| Avg CPU % | Displays the average CPU percentage of the StoreFront server aggregated over the last 10 mins. | |
| Peak CPU % | Displays the peak CPU percentage of the StoreFront server in the last five mins. This value helps to decide on the maximum required capacity for a CPU. | |
| Memory Usage % | Displays the usage of memory in percentage using a stack chart. The value displayed is the latest one at the end of the last 5 mins. | |
| Avg Memory % | Displays the average memory percentage of the StoreFront server aggregated over the last 10 mins. | |
| Peak Memory % | Displays the peak memory percentage of the StoreFront server in the last 5 mins. | |
| Disk IOPS | Displays the input and output value of the disk using a line chart. | |
| Avg Disk IOPS % | Displays the average disk IOPS of the StoreFront server using a float. | |
| Peak Disk IOPS % | Displays the peak disk IOPS percentage of the StoreFront server aggregated over the last 10 mins. | |
| Disk Latency (Ms) | Displays the latency value of the disk using a line chart. | |
| Avg Disk Latency % | Displays the average disk latency of the StoreFront server aggregated over the last 10 mins. | |
| Peak Disk Latency % | Displays the peak disk latency percentage of the StoreFront server in the last five mins. | |
| Impact
|
ICA® Certificate Validity | Displays the validity of the ICA certificate. The possible values are Expired, Expiring, Valid, and Not Found. |
| ICA Certificate Chain Validity | Displays StoreFront ICA Certificate Chain is valid or not. The possible value is Yes or No. | |
| IIS Certificate Validity | Displays the validity of the IIS certificate. The possible values are Expired, Expiring, Valid, and Not Found. | |
| IIS Certificate Chain Validity | Displays StoreFront IIS Certificate Chain is valid or not. The possible value is Yes or No. |
Cloud Connector health metrics
The Cloud Connector component is added by default as part of Infrastructure monitoring. The Cloud Connector component that is connected to the Citrix DaaS™ site is auto onboarded for monitoring.
This feature enables customers to monitor Cloud Connector’s health under the infrastructure monitoring dashboard and configure alerts for it. The alerting functionality enables customer admins to get alerted if any of the policies created for Cloud Connectors are in the critical or warning stage.
You can select the required Component type and the details are displayed according to the selected site name. You can also select the Resource location.
Note:
The
citrixinframonitor.msifile is not required for monitoring Cloud Connectors.
You can monitor both single-site and multi-site details for the infrastructure details.
Click the Infrastructure tab and then select Cloud Connector. The infrastructure dashboard for Cloud Connector appears:
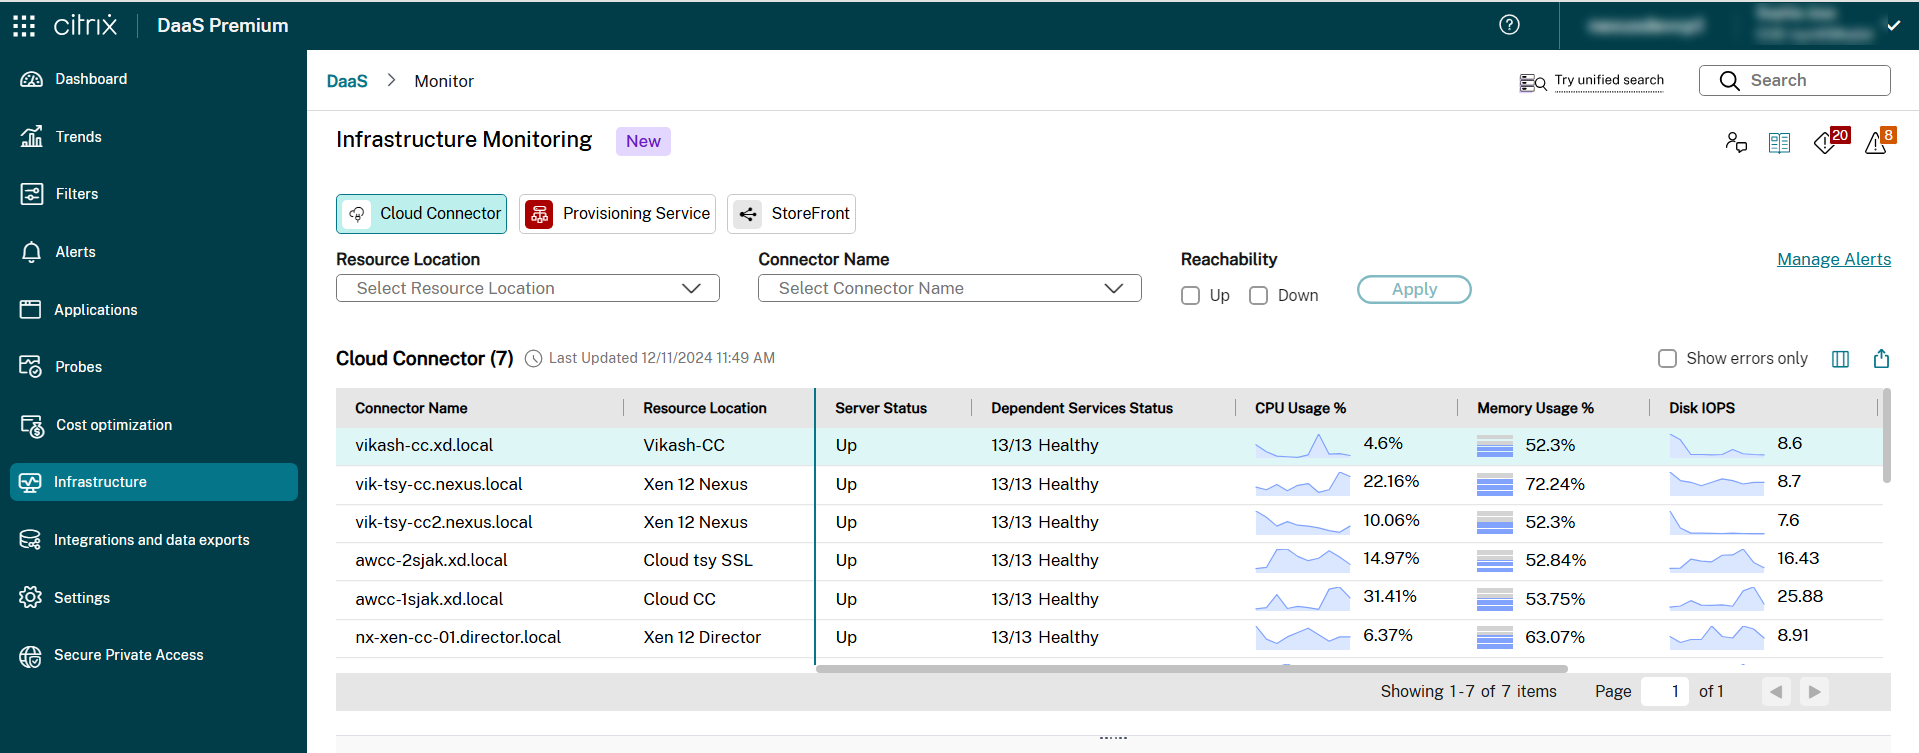
The following details are monitored for Cloud Connector:
| Category | Metrics | Description |
|---|---|---|
|
Reachability
|
Server Status | Shows the reachability state of the given Cloud Connector. Possible values are Up and Down. |
| Dependent Service Status | Provides the summary of the Cloud Connector Dependent Service status. The possible values are 13/13 Running (when all services are running) or <number of stopped services>/13 Not Running (shows services which are not running on the tooltip). |
|
| Version | The version of the Cloud Connector. | |
| Last Boot Time | Displays the time when the Cloud Connector was last booted. | |
| Last updated | Displays the latest time when the data was collected from the Cloud Connector. | |
|
Dependent Services-This metric shows the Windows services status. The possible values are: Unknown, Not running, Start Pending, Stop Pending, Running, Continue Pending, Pause Pending, Paused, and Not Installed.
|
Citrix Connection Lease Exchange service | Displays the status of the Citrix Connection Lease Exchange service which enables Connection Lease files to be exchanged between the Citrix Workspace™ app and Cloud Connector for Service Continuity for Workspace. |
| Citrix AD Provider | Displays the status of the Citrix AD Provider service which enables Citrix Cloud™ to facilitate management of resources associated with the Active Directory domain accounts in which it is installed. | |
| Citrix Agent Discovery | Displays the status of the Citrix Agent Discovery service which enables Citrix Cloud to facilitate management of XenApp and XenDesktop® legacy on-premises Citrix products. | |
| Citrix Credential Provider | Displays the status of the Citrix Credential Provider which handles storage and retrieval of encrypted data. | |
| Citrix NetScaler® Cloud Gateway | Displays the status of the Citrix NetScaler Cloud Gateway which provides Internet connectivity to on-premises desktops and applications without the need to open in-bound firewall rules or deploying components in the DMZ. | |
| Citrix Agent Logger | Displays the status of the Citrix Agent Logger which provides a support logging framework for the Citrix Cloud Connector™ services. | |
| Citrix WebRelay Provider | Displays the status of the Citrix WebRelay Provider which enables HTTP Requests received from WebRelay Cloud service to be forwarded to on-premises Web Servers. | |
| Citrix High Availability Service | Displays the status of the Citrix High Availability service which provides continuity of service during outage of a central site. | |
| Citrix Remote HCL Server | Displays the status of the Citrix Remote HCL Server which proxies communications between the Delivery Controller™ and the Hypervisors. | |
| Citrix Remote Broker Provider | Displays the status of the Citrix Remote Broker Provider which enables communication to a remote Broker Service from local VDAs and StoreFront servers. | |
| Citrix CDF Capture Service | Displays the status of the Citrix CDF Capture service which captures CDF traces from all configured products and components. | |
| Citrix Config Synchronizer | Displays the status of the Citrix Config Synchronizer which copies brokering configuration locally for high availability mode. | |
| Citrix Agent WatchDog | Displays the status of the Citrix Agent WatchDog which monitors and upgrades the on-premises agents (evergreen). | |
|
Resource Utilization
|
CPU Usage % | Displays the usage of CPU in percentage using a line chart. The value displayed is the latest one at the end of the last 5 mins. |
| Average CPU % | Displays the average CPU percentage of the Cloud Connector server aggregated over the last 10 mins. | |
| Peak CPU % | Displays the peak CPU percentage of the Cloud Connector server in the last 5 mins. | |
| Memory Usage % | Displays the usage of memory in percentage using a stack chart. The value displayed is the latest one at the end of the last 5 mins. | |
| Average Memory % | Displays the average memory percentage of the Cloud Connector server aggregated over the last 10 mins. | |
| Peak Memory % | Displays the peak memory percentage of the Cloud Connector server in the last 5 mins. | |
| Disk IOPS | Displays the input and output value of the disk using a line chart. | |
| Average Disk IOPS % | Displays the average disk IOPS of the Cloud Connector server aggregated over the last 10 mins. | |
| Peak Disk IOPS % | Displays the peak disk IOPS percentage of the Cloud Connector server in the last 10 mins. | |
| Disk Latency (Ms) | Displays the latency value of the disk using a line chart. | |
| Average Disk Latency % | Displays the average disk latency of the Cloud Connector server aggregated over the last 10 mins. | |
| Peak Disk Latency % | Displays the peak disk latency percentage of the Cloud Connector server in the last 5 mins. |
Connector Appliance health metrics
The Connector Appliance component is added by default as part of Infrastructure monitoring. The Connector Appliance component that is connected to the Citrix DaaS site is auto onboarded for monitoring.
This feature enables customers to monitor Connector Appliance’s health under the Infrastructure monitoring dashboard.
You can select the required Component type and the details are displayed according to the selected site name. You can also select the Resource location.
Click the Infrastructure tab and then select Connector Appliance. The infrastructure dashboard for Connector Appliance appears:
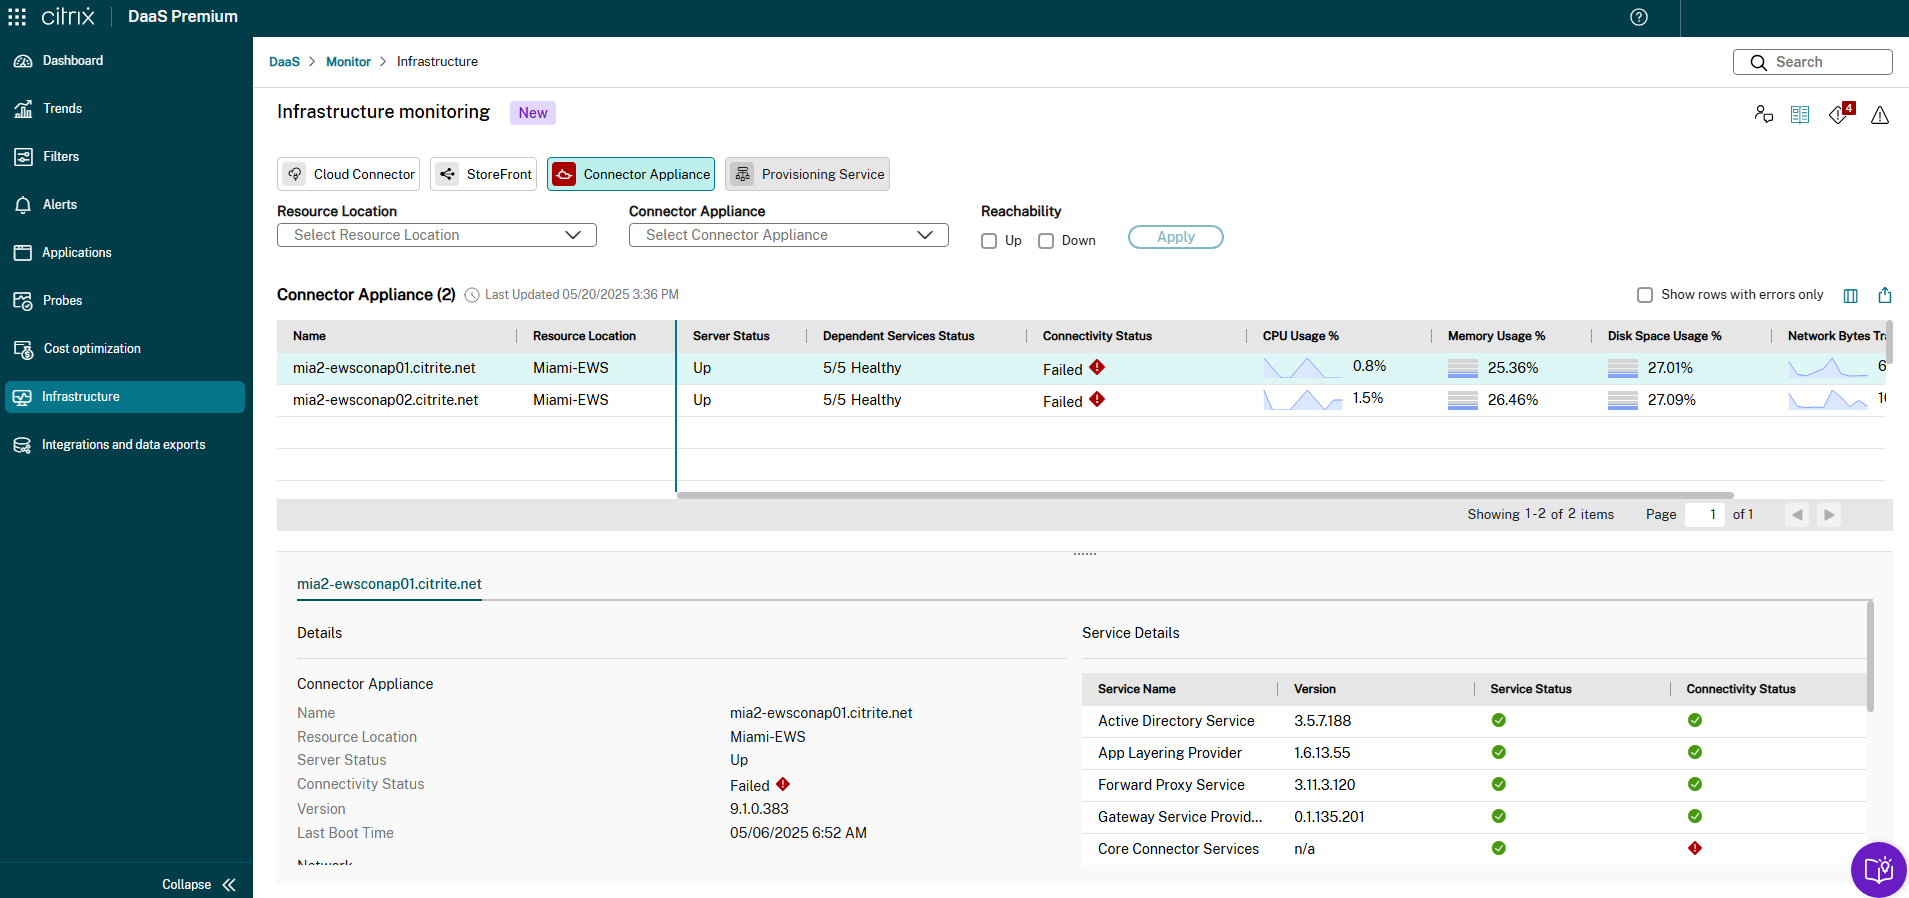
The following details are monitored for Connector Appliance:
| Category | Metrics | Description |
|---|---|---|
|
Reachability
|
Server Status | Shows the reachability state of the given Connector Appliance. Possible values are Up and Down. Connector Appliance sends status events to Citrix every 5 minutes, the Down state occurs when no events have been received for 20 consecutive minutes. |
| Dependent Service Status | Provides the summary of the Connector Appliance Dependent Service status. Possible values are 5/5 Running (when all services are running) or <stopped>/5 Not Running. |
|
| Connectivity Status | Displays whether the service can reach the addresses in Citrix Cloud necessary for it to operate. Possible values are Success and Failed. | |
| Version | The version of the Connector Appliance. | |
| Last Boot Time | Displays the time when the Connector Appliance was last booted. | |
| Last updated | Displays the latest time when the data was collected from the Connector Appliance. | |
| Proxy Details | Displays the proxy that the Connector Appliance uses. | |
|
Network
|
Public IP v4 | Displays the public IP address of the Connector Appliance. |
| Private IP | Displays the private IP address of the Connector Appliance. | |
|
Authentication
|
AD Configured | True or False to indicate if the Connector Appliance Server has configured AD. |
| Joined domains | Displays the domain that the Connector Appliance has joined. | |
|
Dependent Services
|
Active Directory Service | Enables integration with the Active Directory, allowing authentication and management of users across multiple domains. |
| App Layering Provider | Connects the Citrix App Layering™ appliance to Active Directory, enabling directory junctions for managing user attributes. | |
| Gateway Service | Facilitates secure access to Citrix Cloud services, ensuring seamless connectivity between on-premises resources and cloud environments. | |
| Forward Proxy Service | Helps manage outbound connections, ensuring secure and efficient communication between Citrix Cloud and enterprise networks. | |
| Core Connector Services | Enables communication between Citrix Cloud and resource locations, supporting authentication, image portability, and other cloud management functions. | |
|
Resource Utilization
|
CPU Usage % | Displays the usage of CPU in percentage using a line chart. The value displayed is the latest one at the end of the last 5 mins. |
| Average CPU % | Displays the average CPU percentage of the Connector Appliance server aggregated over the last 10 mins. | |
| Peak CPU % | Displays the peak CPU percentage of the Connector Appliance server in the last 10 mins. | |
| Memory Usage % | Displays the usage of memory in percentage using a stack chart. The value displayed is the latest one at the end of the last 5 mins. | |
| Average Memory % | Displays the average memory percentage of the Connector Appliance server aggregated over the last 10 mins. | |
| Peak Memory % | Displays the peak memory percentage of the Connector Appliance server in the last 10 mins. | |
| Disk Space Usage % | Displays the usage of disk space in percentage using a stack chart. The value displayed is the latest one at the end of the last 5 mins. | |
| Average Disk Space Usage % | Displays the average disk space usage percentage of the Connector Appliance server aggregated over the last 10 mins. | |
| Peak Disk Space Usage % | Displays the peak disk space usage percentage of the Connector Appliance server in the last 10 mins. | |
| Network Bytes Transferred Per Minute | Displays the network bytes transferred per minute using a line chart. The value displayed is the latest one at the end of the last 5 mins. | |
| Average Network Bytes Transferred Per Minute | Displays the average network bytes transferred per minute of the Connector Appliance server over the last 10 mins. | |
| Peak Network Bytes Transferred Per Minute | Displays the peak network bytes transferred per minute of the Connector Appliance server over the last 10 mins. |
Create and manage alerts
You can set up alerts for proactively monitoring conditions and scopes of interest to you and reduce alert fatigue. Alerts can be configured with severity, re-alert intervals, notification mediums, and follow the alert lifecycle supported in the product.
For more information, see the following: