Thresholds
Thresholds define visual health indicators for system metrics across the monitoring console. By setting Critical, Warning, and Healthy values for each metric, administrators can identify performance bottlenecks through color-coded indicators on multiple dashboard views.
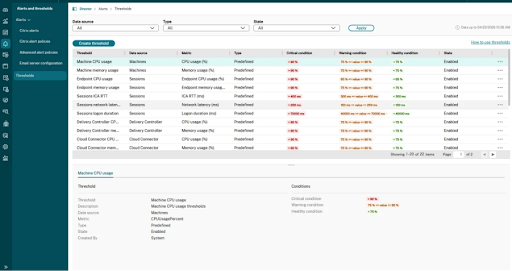
Each threshold applies to a specific data source and metric combination. The system includes predefined thresholds based on Citrix best practices and supports custom thresholds that can be tailored to environment expectations. Enabled thresholds apply color-coded indicators to metric values across the console using Critical, Warning and Healthy values set by the administrator.
Thresholds update indicators on the following pages:
- Dashboard — Logon duration
- Infrastructure — Status for Delivery Controllers, Cloud Connectors, Provisioning Services, and StoreFront
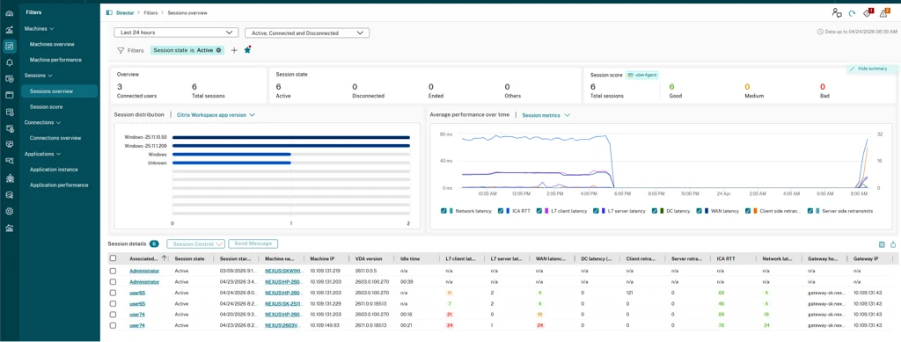
- Filters — Performance metrics in Machines, Sessions, connections, and applications tables
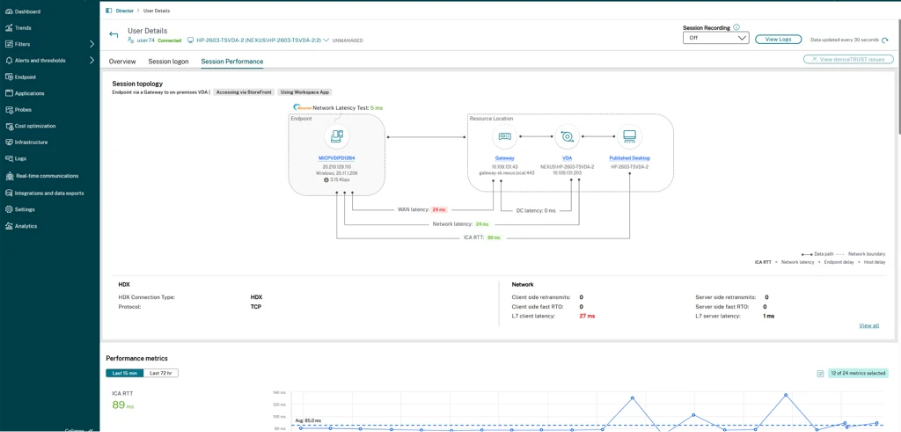
- User Details and Machine Details — Per-user and per-machine metric indicators
Prerequisites
- Citrix DaaS™ 129 or Citrix Virtual Apps and Desktops™ 2611 or later
- Administrator permissions: Full administrator or authorized custom administrator
Predefined thresholds
Predefined thresholds are system-generated configurations based on Citrix best practices. These cannot be deleted but can be edited or disabled.
| Data source | Metric | Default Critical value | Default Warning value | Dynamic |
|---|---|---|---|---|
| Machines | CPU usage % | 90% | 75% | No |
| Machines | Memory usage % | 90% | 75% | No |
| Sessions | CPU usage % | 90% | 75% | No |
| Sessions | Memory usage % | 90% | 75% | No |
| Sessions Endpoint | CPU usage % | 90% | 75% | No |
| Sessions Endpoint | Memory usage % | 90% | 75% | No |
| Sessions | ICA RTT | 400 ms | 300 ms | Yes (P90/P70) |
| Sessions | Network latency | 250 ms | 150 ms | Yes (P90/P70) |
| Sessions | Logon Duration | 70,000 ms (70s) | 40,000 ms (40s) | Yes (P90/P70) |
| Delivery Controller™ | CPU usage % | 90% | 75% | No |
| Delivery Controller | Memory usage % | 90% | 75% | No |
| Cloud Connector | CPU usage % | 90% | 75% | No |
| Cloud Connector | Memory usage % | 90% | 75% | No |
| Provisioning service | CPU usage % | 90% | 75% | No |
| Provisioning service | Memory usage % | 90% | 75% | No |
| StoreFront™ | CPU usage % | 90% | 75% | No |
| StoreFront | Memory usage % | 90% | 75% | No |
To reset a predefined threshold to its factory defaults, select the threshold and choose Use System Default.
Custom thresholds
Custom thresholds are administrator-created configurations across the site. Unlike predefined thresholds, custom thresholds can be fully deleted.
Use custom thresholds to define metric boundaries for environments where the predefined defaults do not match operational expectations — for example, a tighter ICA RTT limit or utilization across VDAs.
Dynamic defaults
For ICA RTT, Network Latency, and Logon Duration, the system calculates default values every seven days based on the previous week’s actual performance data.
- Warning — Set at the 70th percentile (P70): the value below which 70% of observations fall.
- Critical — Set at the 90th percentile (P90): the value below which 90% of observations fall.
Dynamic defaults allow thresholds to automatically adapt to the specific infrastructure baseline. Metrics are flagged only when they exceed levels typically experienced by the majority of the user base.
Note:
When Use System Default is selected for a dynamic metric, the system manages the threshold values automatically. Manually entered values override dynamic calculations until the threshold is reset.
Manage thresholds
Create a threshold
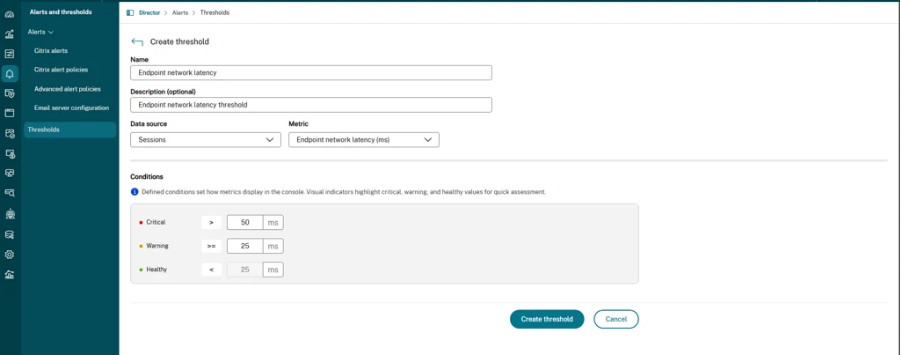
Navigate to Thresholds and select Create Threshold.
Step 1: Select data source and metric
Select the data source (for example, Machines, Sessions) and the metric to monitor.
Step 2: Set threshold values
Enter values for the Critical and Warning states.
| Field | Description |
|---|---|
| Critical value | The value above which the metric is flagged as Critical (red). |
| Warning value | The value above which the metric is flagged as Warning (amber). |
Step 3: Save
Select Save to activate the threshold. Color-coded indicators appear on applicable pages immediately.
Edit a threshold
Select a threshold from the list and choose Edit. Modify the Critical or Warning values and select Save.
For predefined thresholds, select Use System Default to revert to Citrix-recommended values. For dynamic metrics, this re-enables automatic P70/P90 calculations.
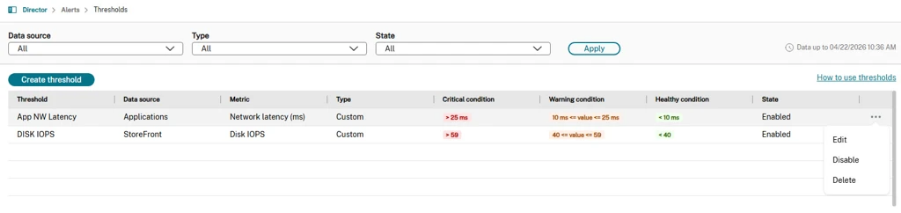
Disable a threshold
Select a threshold and choose Disable. Disabling a threshold reverts the metric to standard formatting on all pages without deleting the configuration. Re-enable the threshold at any time to restore color-coded indicators.
Delete a threshold
Select a custom threshold and choose Delete. Predefined thresholds cannot be deleted — disable them instead.
Troubleshooting
Dynamic default values appear unexpectedly high or low
Solution: Dynamic defaults reflect the P70 and P90 of the previous seven days of data. Unusual values indicate a period of abnormally high or low performance. If the calculated values do not match operational expectations, edit the threshold and enter manual values. Manual values override dynamic calculations. After one week of normal operations, reset the threshold to Use System Default to recalculate.
Predefined threshold values do not match the documented defaults
Solution: An administrator may have edited the predefined threshold. Select the threshold and choose Use System Default to restore factory defaults. For dynamic metrics (ICA RTT, Network Latency, Logon Duration), values are recalculated weekly. The current values reflect the most recent P70/P90 calculation, not the static defaults listed in the table above.