Citrix Analytics for Performance™ (Performance Analytics)
What is Performance Analytics
Performance Analytics is a Citrix Analytics offering that enables you to track, aggregate, and visualize key performance indicators of your Apps and Desktops environment.
-
Performance Analytics aggregates site performance metrics into easy-to-view User Experience and Infrastructure dashboards. The dashboards help you analyze the user experience and optimize the usage of your Apps and Desktops sites.
-
Performance Analytics supports multi-Site aggregation and reporting. It aggregates performance metrics across your cloud and on-premises setups. Hence, you can view data for all the Sites in your environment on a single console.
-
Performance Analytics quantifies the user performance factors and classifies the users based on these factors. It provides actionable insights to troubleshoot failures, screen lags, delayed session logons, and other performance indicators.
-
Performance Analytics allows you to find and filter metrics to narrow down to specific users or sessions facing performance issues.
How to use Performance Analytics
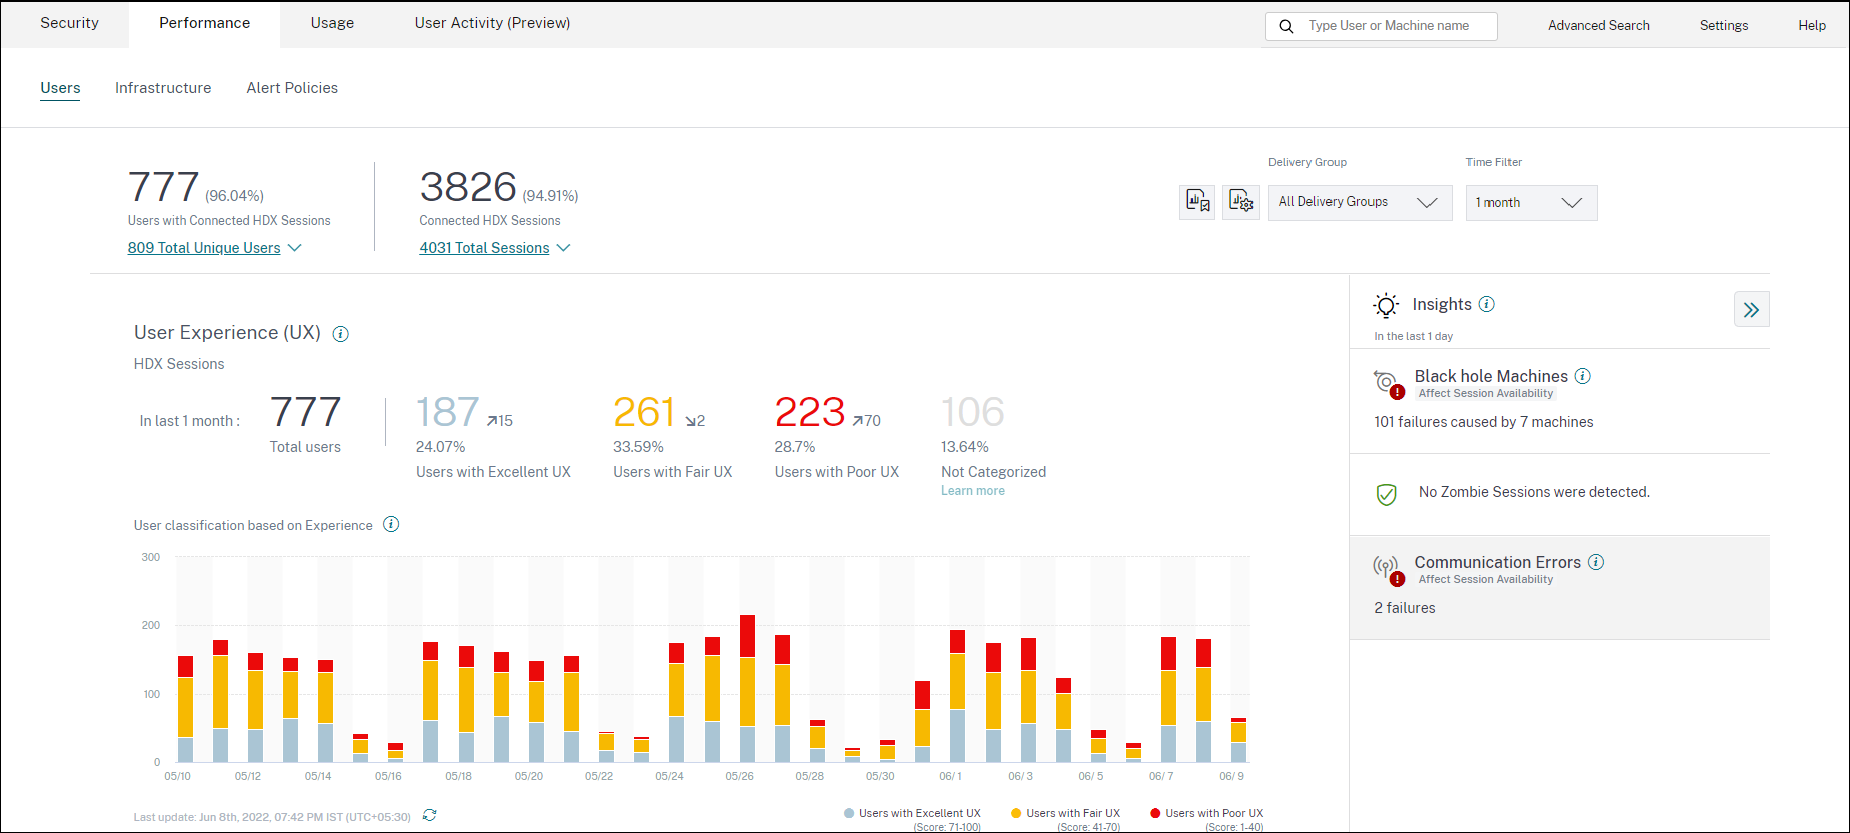
User Experience Dashboard
The User Experience dashboard shows the Site performance concerning factors such as session responsiveness, session logon duration, session failures, and session reconnects that together define the user experience.
If you are supporting several users of virtual apps and desktops in your organization, and they occasionally experience delay while launching apps or desktops, the logon duration metric can give you insights into the issue. Drilling down can help you identify the factors leading to the issues.
Infrastructure Dashboard
The Infrastructure dashboard displays the status and health of the machines in your site. When used together, the User and Infrastructure dashboards can help you proactively check availability of resources and identify performance bottlenecks on the Sites.
-
If user or session trends show a dip, indicating a reduction in the number of users or sessions logged into the Site, use this indicator to check if a hypervisor has been rebooted or the number of machines is insufficient.
-
If you see several cases of sessions failing to launch, drilldown to establish the cause for the failure. It might be a shortage in the number of licenses or issues with machine connection to the Delivery Controller.
Note:
Infrastructure Analytics Dashboard is currently under Preview.
Using Performance Analytics you can quickly analyze issues, troubleshoot and resolve them, and maintain an optimum level of service of apps and desktops.
Getting Started
Prerequisites
-
Check if your workstation has a supported web browser listed in the Supported browsers article. For information about the system requirements, see the Citrix Analytics System Requirements article.
-
You must have a Citrix Cloud account to use the Analytics service. For detailed instructions on how to create a Citrix Cloud account, see Sign Up for Citrix Cloud. Go to https://citrix.cloud.com and sign in with your Citrix Cloud account.
-
Citrix Analytics for Performance is available as a subscription based offering, either as a stand-alone offering or bundled along with Citrix Analytics for Security. To subscribe to Citrix Analytics for Performance, see
https://www.citrix.com/products/citrix-analytics-performance.html). -
Supported versions of data sources is available in the Data Sources article.
-
Citrix Profile Management must be installed on all machines.
-
The End User Experience Monitoring (EUEM) service must be running and the corresponding policies must be configured on all machines. For more details see, End user monitoring policy settings.
-
The VDA data collection for Performance Analytics policy must be set to Allowed on machines to enable the Monitoring service to collect machine related performance metrics such as Bandwidth and latency statistics. For more information, see Policy for collecting data for Performance Analytics.
-
Enable the Process Monitoring policy from Citrix Studio to gain visibility into the high resource consuming processes in the Machine Statistics > Process tab. For more information, see Enable Process Monitoring.
-
Ensure accessibility to the following URLs from all endpoints (or proxies, if they are configured):
Endpoint United States region European Union region Asia Pacific South region Citrix Key Registration https://trust.citrixnetworkapi.nethttps://trust.citrixnetworkapi.nethttps://trust.citrixnetworkapi.netCitrix Cloud https://trust.citrixworkspacesapi.nethttps://trust-eu.citrixworkspacesapi.nethttps://trust-aps.citrixworkspacesapi.netCitrix Analytics https://api.was.cloud.comhttps://api-eu.was.cloud.comhttps://api-aps.was.cloud.comBulk Upload https://citrixanalyticseh-alias.servicebus.windows.net/https://citrixanalyticseheu-alias.servicebus.windows.net/https://citrixanalyticsehaps-alias.servicebus.windows.net/Bulk Upload https://citrixanalyticseh2-alias.servicebus.windows.net/https://citrixanalyticseh2eu-alias.servicebus.windows.net/Bulk Upload https://citrixanalyticseh3-alias.servicebus.windows.net/
Access
-
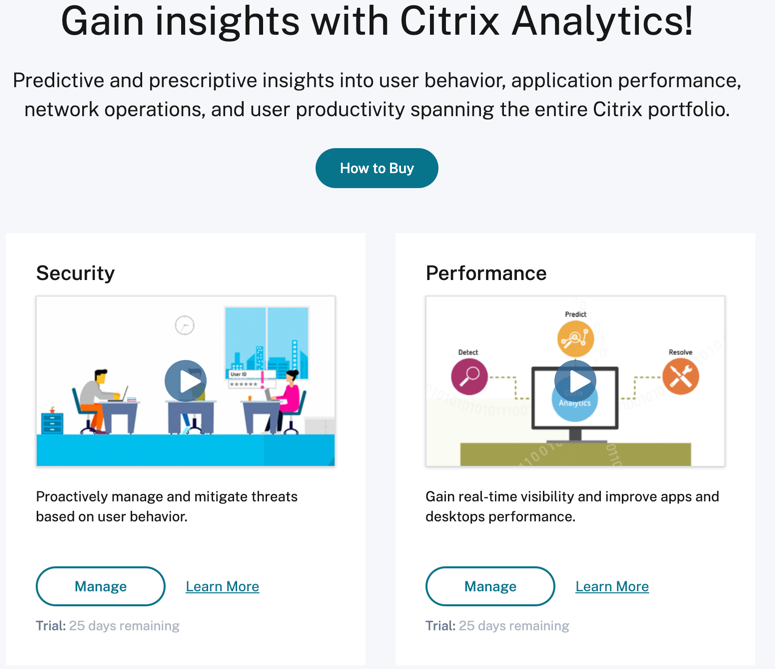
Log on to Citrix Cloud. Look for the Analytics service tile and click Manage. The overview page displays the offerings available in the Analytics portfolio.
-
In the Performance offering, to use the trial version of the offering, click Request Trial. If you have bought the Citrix Analytics for Performance offering, click the Manage link instead.
 .
.
- Citrix Analytics for Performance opens with dashboards displaying the User Experience and Infrastructure Performance Analytics.
Access from the Asia Pacific South region
Citrix Analytics for Performance is now onboarded automatically for trial customers and subscription-based customers in the Asia Pacific South (APS) region. For more information on the regions supported in Citrix Cloud, see Geographical considerations.
To access Performance Analytics from the APS region, choose the Asia Pacific South region while onboarding your tenant to Citrix Cloud. Log on to Citrix Cloud, and select your tenant in the APS region of Citrix Cloud. Use the https://analytics-aps.cloud.com URL to access your Citrix Analytics Cloud Service.
-
Citrix Analytics for Performance now stores the user events and metadata of your organization in the Asia Pacific South region when you choose it as your home region. For more information, see Data governance.
-
For information about the network requirements for the Asia Pacific South region, see Technical security overview.
Configure Data Sources
You can use Performance Analytics to monitor on-premises or Cloud Sites. You can use this offering whether you are a pure on-premises customer, a Cloud customer, or a hybrid customer with a mix of on-premises and Cloud Sites.
Performance Analytics automatically detects your Citrix DaaS (formerly Citrix Virtual Apps and Desktops™ service). If you are an on-premises customer,
- First onboard your Citrix Virtual Apps and Desktops Sites to Performance Analytics.
- To get network related information on Performance Analytics, you must also onboard your on-premises Citrix Gateway.
Configure the required data sources as described in the Data Sources article.
Note:
Citrix Analytics for Performance collects and stores logs for data points as listed in Logs collected for Citrix Analytics for Performance.
Recommended limits for the Citrix Analytics for Performance service are listed in the Limits article.
Service Continuity
In the event of a service interruption, Citrix Analytics for Performance operates in a limited capacity.
The admin can choose to Stay and view data available on the current screen or Go to dashboard in a downgraded mode.
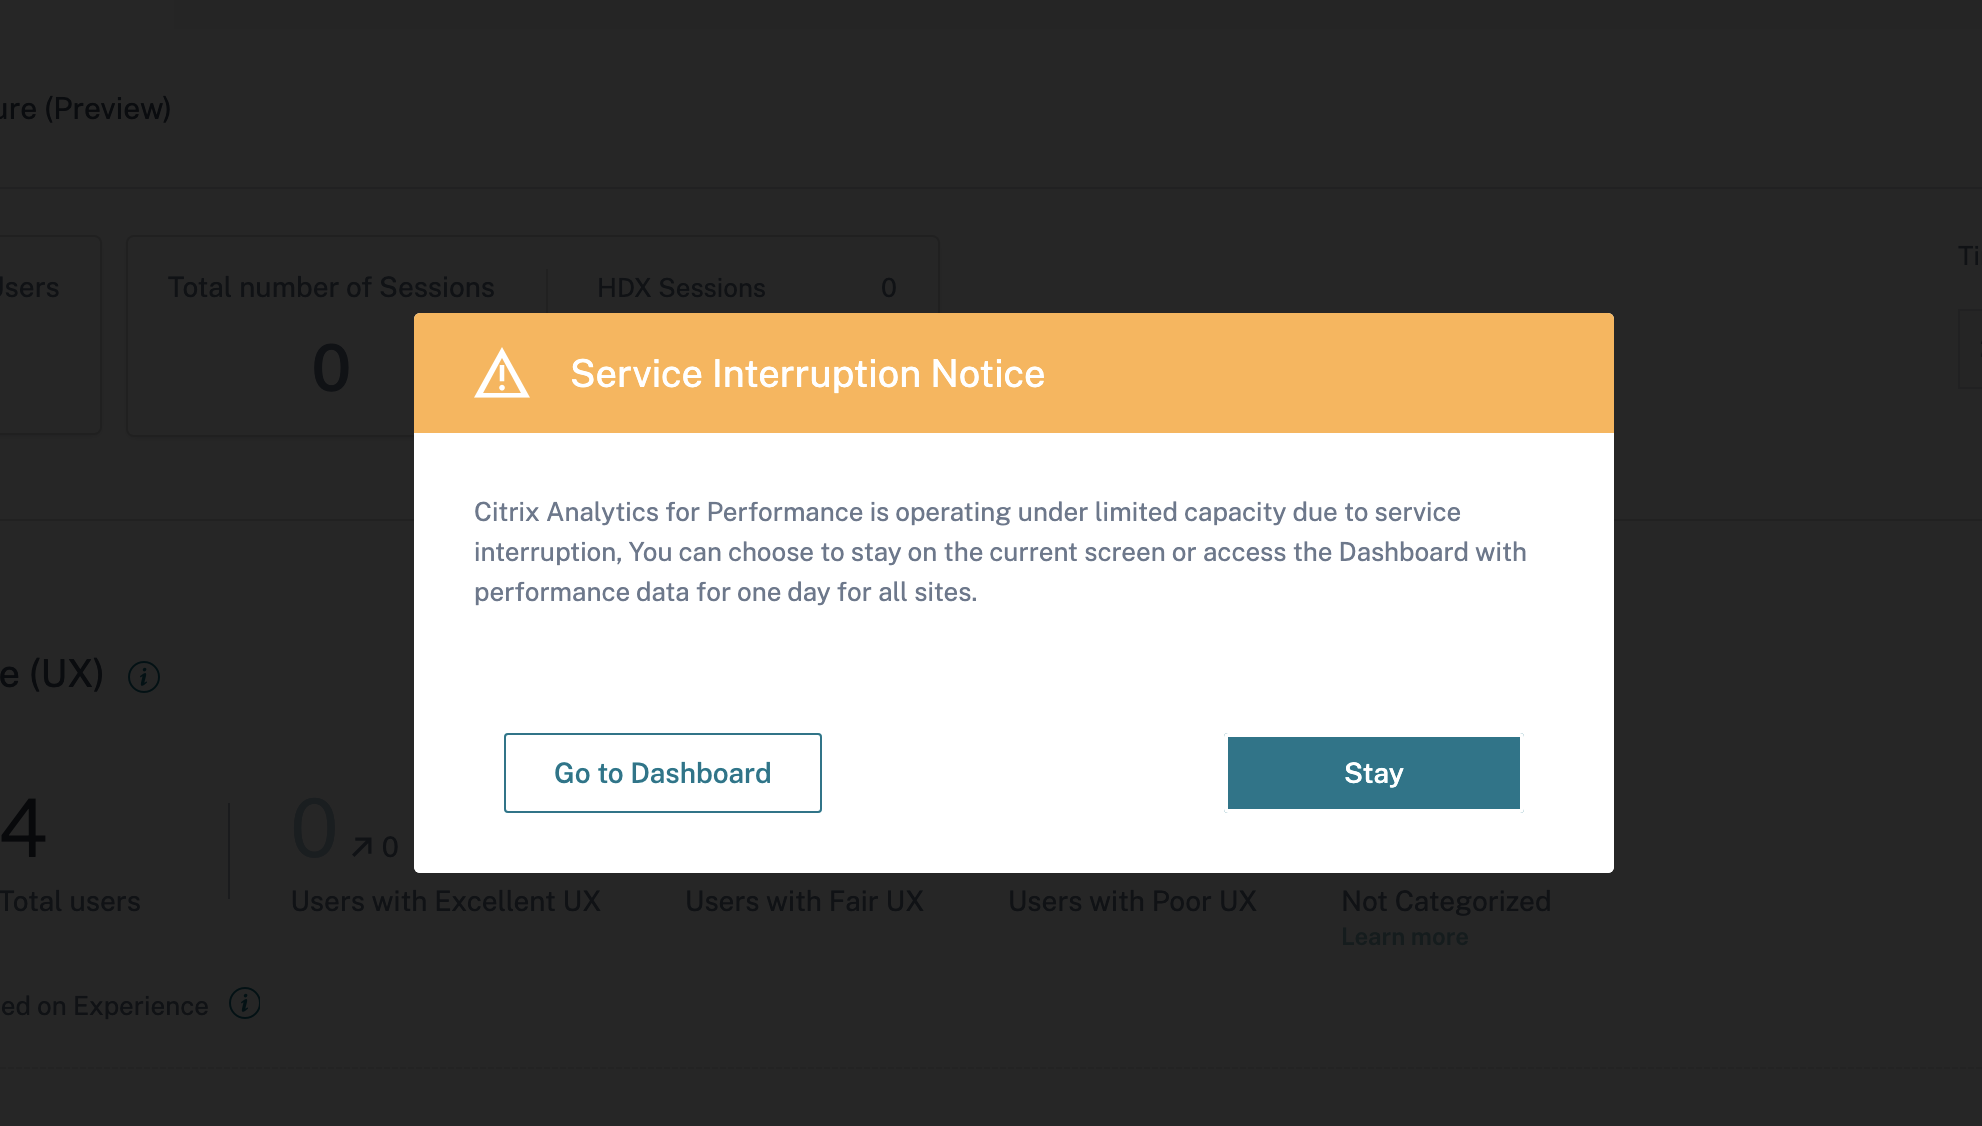
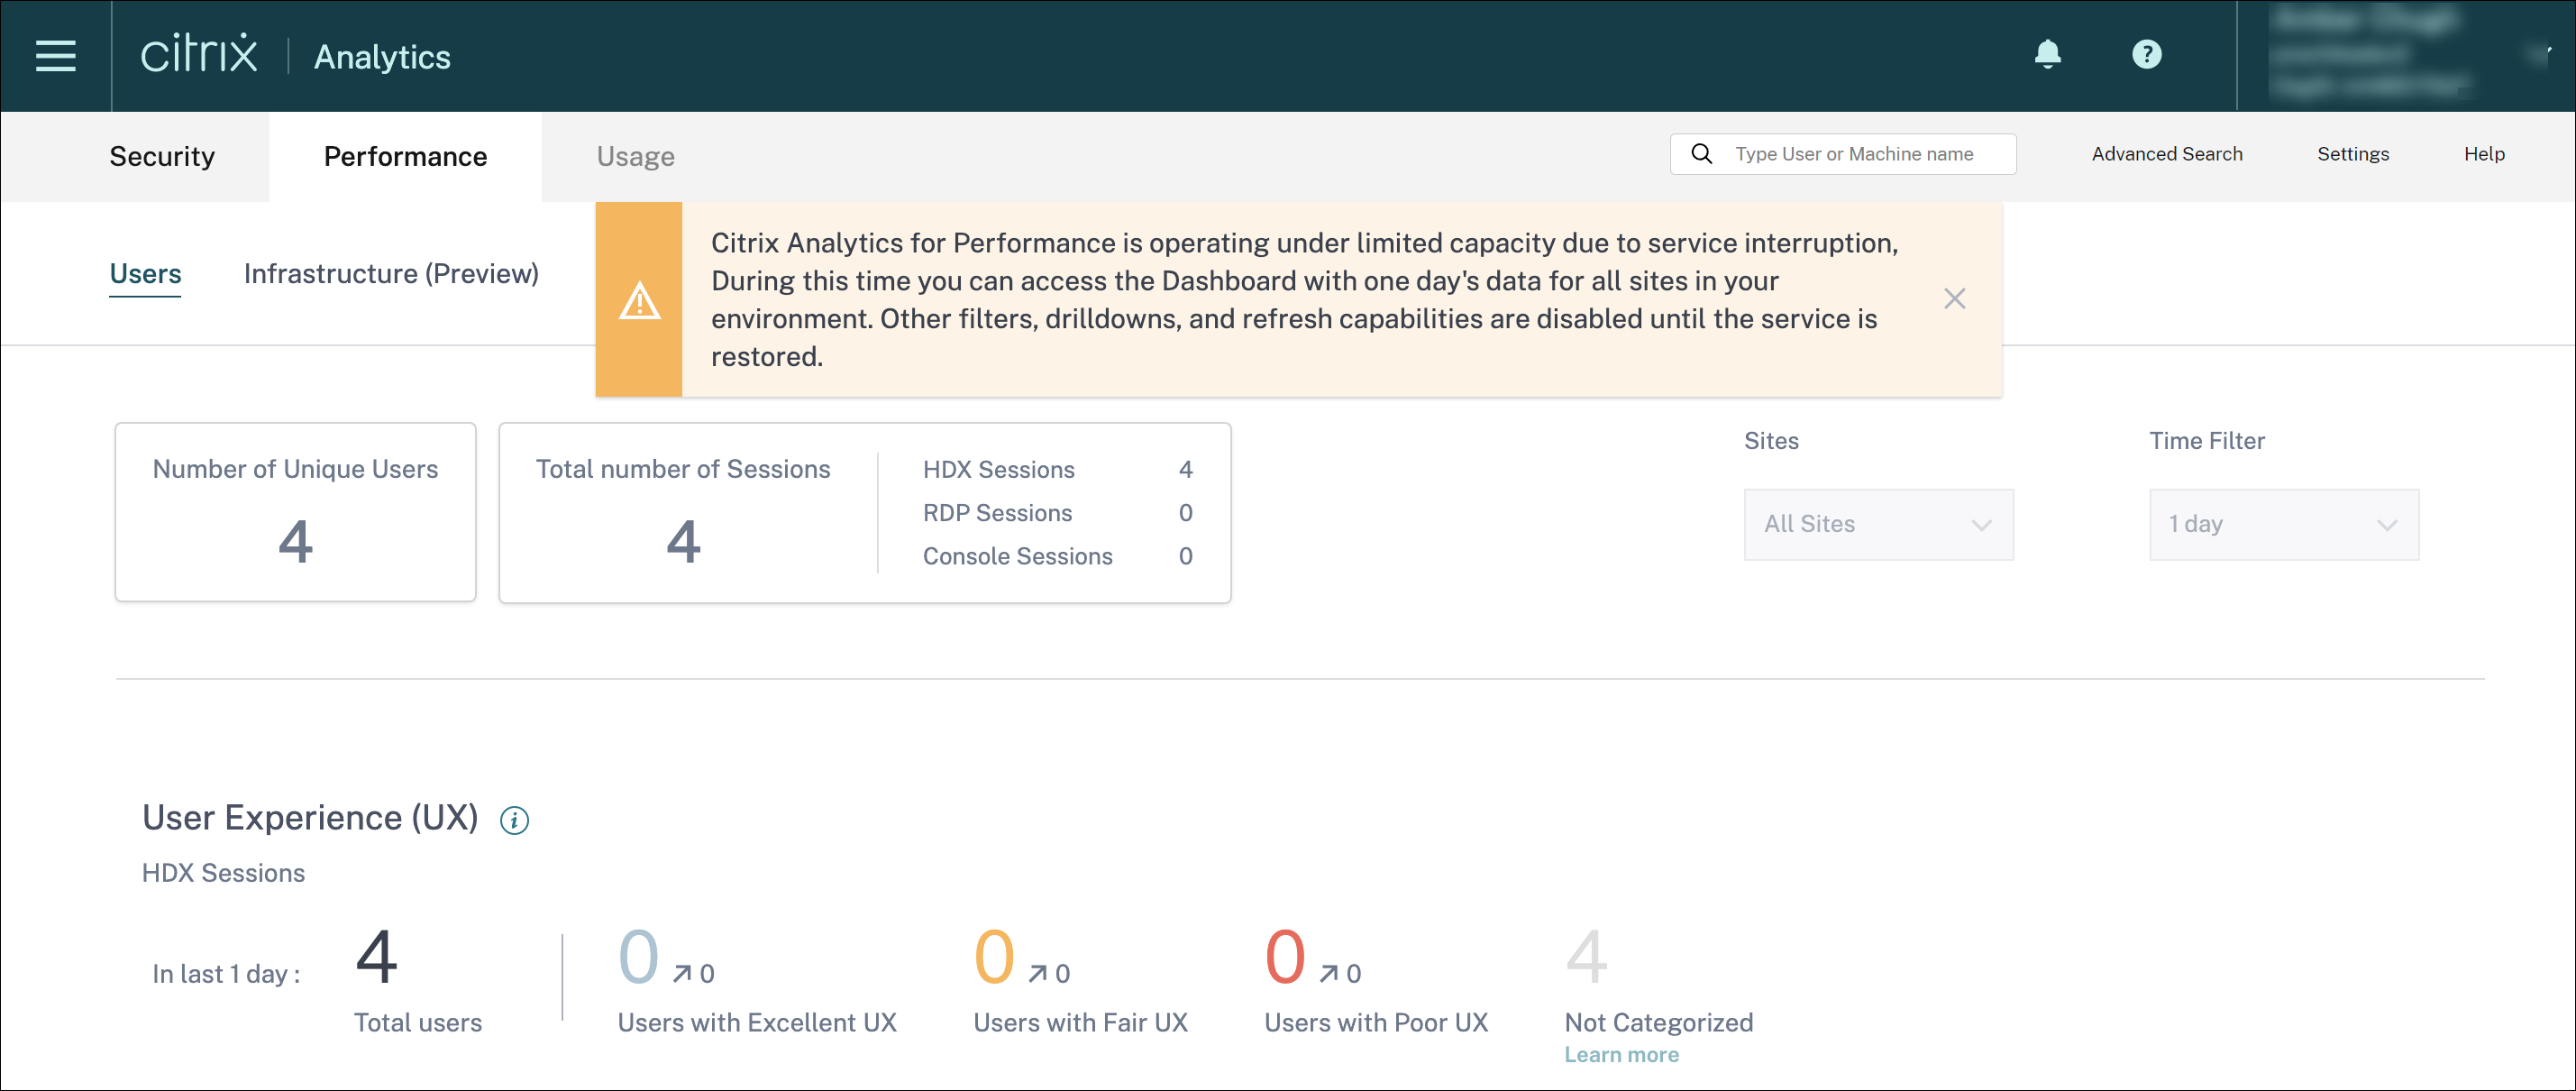
In the downgraded mode, the user is switched to the dashboard containing data of all sites for the past day. All filters, and drilldowns are disabled until the service is restored to normal operation in either case.
This update improves product resiliency and helps align with the Service Level Agreement.