What’s new
A goal of Citrix® is to deliver new features and product updates to customers as and when they are available. New releases provide more value, so there’s no reason to delay updates.
To you, the customer, this process is transparent. Initial updates are applied to Citrix internal sites only, and are then applied to customer environments gradually. Delivering updates incrementally helps to ensure product quality and to maximize the availability.
It is possible that the updates mentioned in this documentation are being rolled out and are not accessible to all customers at the same time.
New features introduced in Citrix Analytics for Performance™ provide further insights into performance parameters affecting the user experience on Citrix Virtual Apps and Desktops on-premises sites and Citrix DaaS (formerly Citrix Virtual Apps and Desktops service) sites on cloud.
Dec 28, 2023
Custom Reports export in CSV format
You can now export raw data as CSV format attachments in Custom Report emails apart from the PDF format. You can create various reports of sessions and machines and download the raw data from the Custom Reports (Preview) tab. You can download reports in PDF, CSV, or both formats.
This feature provides stakeholders periodical access to raw data without needing direct access to Citrix Analytics for Performance. For more information, see Custom Reports.
Endpoint Network telemetry of Citrix Workspace™ app for Windows version 2311 sessions launched in hybrid mode
Citrix Analytics for Performance now extends visibility into key Endpoint Network telemetry for virtual apps and desktops sessions that are launched in hybrid mode. The Endpoint Network telemetry is available in Citrix Analytics for Performance for sessions from Citrix Workspace app for Windows version 2311 and later. The Endpoint Network telemetry available are Network Interface Type (Ethernet/ WiFi), Endpoint Link Speed, Endpoint Throughput (Incoming and outgoing), and WiFi Signal Strength.
Virtual sessions are said to be launched in hybrid mode when you log on to Citrix Workspace app through the Citrix Workspace for Web browser and launch the applications or desktops through the native Citrix Workspace app.
For more information about the available metrics, see Self-service search for Sessions.
Dec 19, 2023
Endpoint Network telemetry of Citrix Workspace app for Linux version 2311 sessions launched in hybrid mode
Citrix Analytics for Performance now extends visibility into key Endpoint Network telemetry for virtual apps and desktops sessions that are launched in hybrid mode. The Endpoint Network telemetry is available in Citrix Analytics for Performance for sessions from Citrix Workspace app for Linux version 2311 and later. The Endpoint Network telemetry available are Network Interface Type (Ethernet/ WiFi), Endpoint Link Speed, Endpoint Throughput (Incoming and outgoing), and WiFi Signal Strength.
Virtual sessions are said to be launched in hybrid mode when you log on to Citrix Workspace app through the Citrix Workspace for Web browser and launch the applications or desktops through the native Citrix Workspace app.
For more information about the available metrics, see Self-service search for Sessions.
Dec 12, 2023
Simplified search for users and machines
You can now search for sessions or machines that were active over the last week from the dashboards using the user name or the machine name respectively. A new search box is provided on the top navigation bar of the User Experience and Infrastructure dashboards for this. Provision of this simplified search helps discover user or machine related information and triage issues easily. The existing search in the self-service view continues to provide advanced search facilities with filters to slice and dice the search results.
Machine Statistics view enhancements
You can now view the successful sessions running on the machine during the selected time period from the Machine Statistics view. A Total Sessions field is added in the Machine Statistics > Sessions tab. Clicking the Total Sessions number opens the Sessions self-service view with the corresponding set of sessions displayed. You can further drilldown and inspect the session metrics from the Session Details view.
Also, you can now click the Session Failure number, the bars in the chart displaying the session failures, and the categorized session counts to view the sessions. This feature makes the Machine Statistics a comprehensive view of all machine-related metrics required to triage and fix issues related to the machine and the sessions running on the machine. For more information, see the Machine Statistics article.
Nov 15, 2023
Metrics relevant to session state displayed in Sessions self-service view
Expanding a row in the Sessions self-service view > Data table view displays the corresponding session metrics. Now only the metrics that are relevant for the session state are displayed. If the session was in a disconnected state during the selected time interval, session metrics related to responsiveness and bandwidth, that are not applicable for disconnected sessions are not displayed. For a failed session, the failure reason and type are displayed to help triage the reason for the session failure. Any columns added to the table that are not relevant for the session state is displayed as “–”.
This feature ensures that displayed session metrics are relevant to the session state. For more information, see Self-service search for Sessions.
Oct 26, 2023
Additional metrics in Sessions self-service view
To support triaging session-related issues, the following session and failure related metadata are now available as optional columns in the Sessions based self-service view. This provides more visibility into the details of failure at individual session level.
- Failure Type – Indicates the kind of session failure from among the following values:
- Failure Reasons – Indicates the exact reason for the failure. You can resolve the failure using the corresponding recommended steps in Citrix Director failure reasons and troubleshooting.
- Session Type – Indicates if the session is an application or a desktop session.
- Session State – Indicates the state of the session.
- Session End Time – Indicates the time at which the session ended.
You can filter the view using these additional columns. The column values are included in export reports and are available as dimension parameters in during the creation of session-based Custom Reports.
The failure metrics help understand the reason for a session failure and the recommended steps to resolve the failure. This feature is especially helpful when you navigate from the failed session count on the dashboard to a filtered set of failed sessions in the Sessions self-service view. For more information, see Self-service search for Sessions.
Improved accuracy of Session Score and other session metrics
Session Score and the other session performance and factors metric charts in the Session Details view now take into account the disconnected duration of the session. This consideration enables the overall Session Score and associated metrics to be an accurate representation of the session performance. The session-disconnected interval is represented in the all charts and tooltips. For more information, see the Session Details article.
Sep 25, 2023
Customize Alert Parameters
Citrix Analytics for Performance now provides the ability to customize the alert parameters.
Alert policies are pre-built with default parameter values. To modify the alert parameters, click the alert policy name to open the Modify Alert window and modify the values of the listed parameters to suit your environment. Subsequent alert notifications are generated based on the custom conditions.
Updating the alert parameters also alters the calculation of the corresponding insight on the UX dashboard.
In alerts where re-alerting is supported, you can also control the re-alerting preference. Alert notifications are resent if the re-alert preference is set to Enabled and the conditions as specified in the re-alert preference persist.
Customized alerts are more relevant to your environment, they help identify anomalies easily, and are more dependable for proactive monitoring.
For more information, see Alerts.
Sep 14, 2023
Support for endpoint metrics from Citrix Workspace apps for Linux
Citrix Analytics for Performance now supports the availability of endpoint metrics from Citrix Workspace apps for Linux version 2308 and later launched in native mode. You can see metrics like Endpoint Link Speed, Endpoint Throughput Incoming, Endpoint Throughput Outgoing and WiFi Signal Strength, Endpoint Throughput Incoming, and Endpoint Throughput Outgoing coming from Citrix Workspace apps for Linux.
For more information, see the Citrix Workspace app versions matrix.
Sep 05, 2023
New Custom Report templates
Two new Custom Report templates based on users and machines data sources are now available in Citrix Analytics for Performance. You can access the new templates from the Reports (Preview) tab.
- The User Experience Category Trends over Last Seven Days template is based on the Users data source. Custom reports based on this template contain trends of Excellent, Fair and Poor users based on their User Experience Score plotted over the last seven days.
- The Machine State Trends over Last Seven Days template is based on the Machines data source. Custom reports based on this template contain trends of machines based on the Machine States - Ready for Use, Active, Maintenance, Unregistered, and Failed - plotted over the last seven days.
Also, you now have a wider choice of metrics to select as plotting parameters. For more information regarding the creation of Custom Reports using templates, see Custom Reports.
Exclude delivery groups from receiving alerts
You can now specify delivery groups to be excluded from receiving alert notifications. You can remove unused delivery groups or those created for testing purposes from the alerting process. This feature helps reduce alert fatigue and improve the relevance of alerts. For more information, see Alerts.
Aug 31, 2023
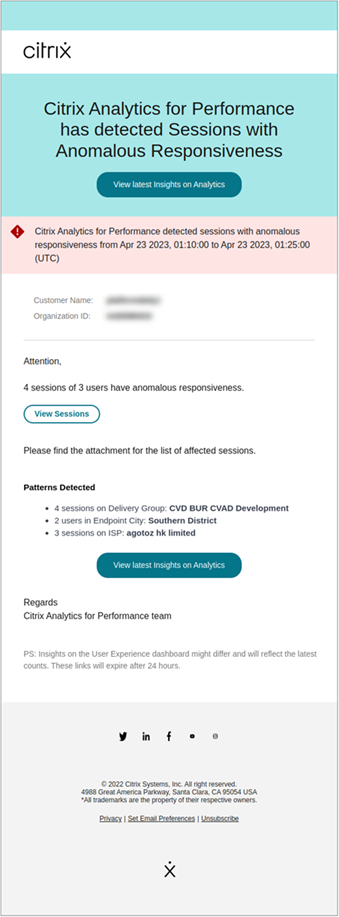
Anomalous Session Disconnects Baseline Insight and Alert
Anomalous Session Disconnects Baseline Insight is introduced to indicate the number of session disconnects and its deviation from the baseline value. The user-specific baseline value is calculated using the P80 count of session disconnects measured over the last 30 days. For more information, see Insights.
The Anomalous Session Disconnects out-of-the-box alert policy is introduced to track the number of session disconnects. If the number of session disconnects exceeds the baseline value by 30% or more and if more than 5% of the sessions are impacted by the disconnects, an alert notification is sent using the configured channel. For more information, see Alerts.
New alert policies based on Baseline Insights
New out-of-the-box alert policies based on the existing Baseline Insights are now defined for:
- Sessions with Poor Logon Duration
- Session with Poor Responsiveness
- Session Failures
The alerts are generated when the number of impacted sessions exceeds the 30-day baseline value by 30% or more and more than 5% of the sessions are impacted by this increase. The alerts can be configured to be notified by mail or webhook like the other Performance Analytics alerts. The alert policies are available in the Alert Policies tab. For more information, see Alerts.
Aug 18, 2023
Discover reasons for missing endpoint metrics
Data availability is important to optimally analyze your Citrix Virtual Apps and Desktops™ environments. Endpoint metrics like Location, ISP, WiFi Strength and Throughput are important indicators that help triage poor session experience. Endpoint metric values might be missing if the appropriate prerequisites are not met.
This feature helps easily identify issues resulting in endpoint metrics having N/A values and suggests appropriate actions.
Drilldown from Dashboard
The User Experience dashboard contains a banner displaying the number of sessions whose endpoint metrics have not been available during the last 7 days.
Clicking Know more displays a modal box with the key reasons for sessions missing endpoint metrics, the number of sessions affected by each reason during the last 7 days and the actions that you could take to fix them.
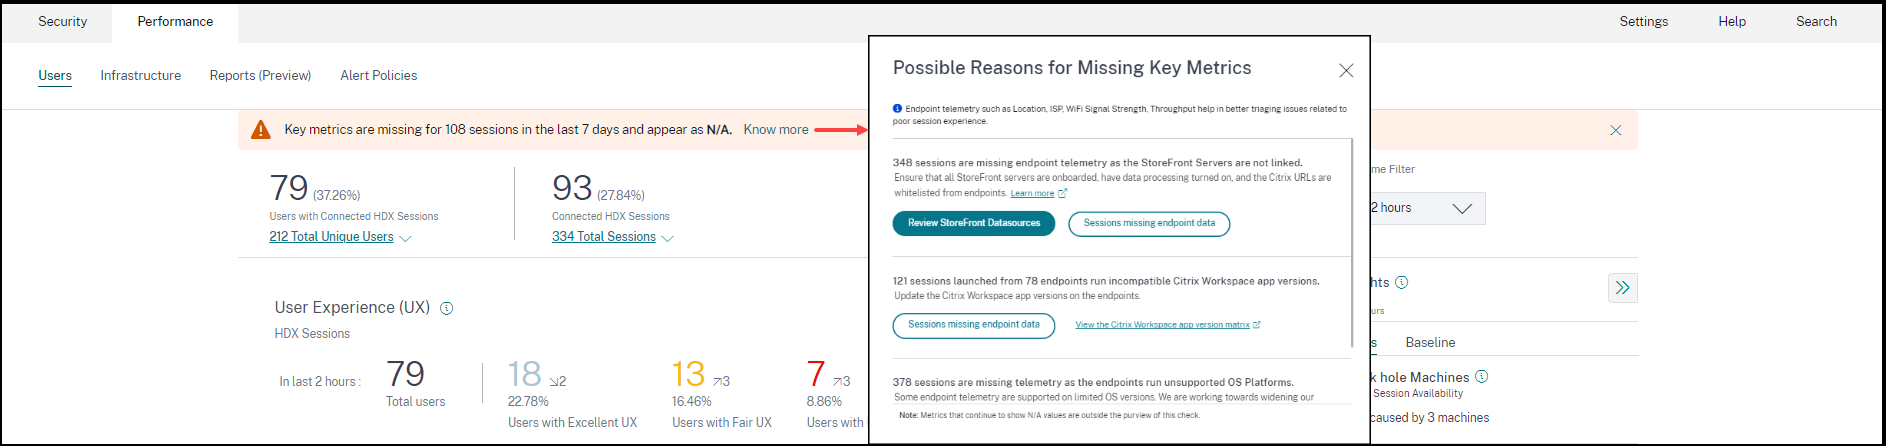
- One of the key reasons for missing endpoint telemetry is StoreFront™ onboarding. StoreFront must be onboarded correctly; data processing must be switched on and appropriate URLs must be whitelisted. Clicking Review StoreFront Data Sources takes you to the Data Sources page that leads you through the StoreFront onboarding process required for the Workspace App data collection. If you are using Citrix Workspace, the service is automatically discovered and does not require onboarding.
- Endpoint telemetry is not available for sessions launched from endpoints that run unsupported OS platforms or incompatible Citrix Workspace app versions. Clicking Sessions missing endpoint data opens the Sessions self-service view with the list of the sessions missing endpoint telemetry due to a specific listed reason. For more information, see the Version matrix that lists for each feature the OS versions and the required Workspace app version on which it is supported.
For more information, see the Not Categorized article.
Tooltips in the Sessions Self-service view
Tooltips elaborating the reasons for N/A values are now available in the Sessions self-service view for the following endpoint-related metrics:
- Workspace App Version
- Endpoint Country (Last known)
- Endpoint City (Last known)
- Endpoint Link Speed (P95)
- Endpoint Throughput Incoming (P95)
- Endpoint Throughput Outgoing (P95)
- ISP (Internet Service Provider)
Tooltips are displayed on the N/A values of these metrics with the reasons as incorrect StoreFront onboarding, or sessions launched from endpoints that run unsupported OS platforms or incompatible Citrix Workspace app versions. This feature helps to educate on the reasons for N/A values so that you can take the necessary action. For more information about the metrics available in the Sessions self-service view, see Self-service view for sessions.
Aug 01, 2023
Alert information as CSV attachments in mailers
Black hole Machines, Overloaded Machine and Zombie Session alerts emails now have CSV attachments containing information about the affected machines and sessions. The attachment has the following data:
- Machine Name
- Site ID
- Catalog Name
- Delivery Group Name
- Failure count (Number of failed machines or sessions as applicable).
The CSV attachments in alert mailers help identify faulting machines and sessions without having to log on to Citrix Analytics for Performance. This helps establish automation pipelines to create and forward tickets to stakeholders responsible for speedy resolution of issues. The feature helps improve communication and efficiency and is the next step to achieve proactive monitoring of your virtual apps and desktops environment.
For more information about available alerts, see Alerts.
Jun 06, 2023
Alert email notifications for non-administrator Citrix Cloud™ accounts
You can now enable the Citrix Analytics for Performance alert email notifications for stakeholders who don’t have administrator access to your Citrix Cloud account. This enables members of your organization’s security and auditing teams who do not hold Citrix Cloud accounts to be able to get alert notifications.
This update ensures that the alert notifications are available to administrators who take action to mitigate the alert condition. This helps speedy resolution of issues and ensures an optimal performance of the virtual apps and desktops environment. For more information, see the Email distribution list.
For more information regarding alerts from Citrix Analytics for Performance, see Alerts.
Jun 05, 2023
User count in Sessions Self-service view
The Visual Summary in the Sessions Self-service view now displays the user count along with the session count. This feature provides a quick overview of the number of users impacted during an incident or because of a specific issue. It also helps understand the number of unique users for a specific query. For more information, see the Sessions self-service article.
May 22, 2023
Connector-Gateway PoP Latency
Connector-Gateway PoP Latency is now displayed on the Connector Statistics page. The values represent the P95 values of the synthetic latency calculated for the available Gateway PoPs in your virtual apps and desktops environment.
This information helps you choose and configure the closest Gateway PoP to achieve the optimum session experience. For more information, see Connector Statistics.
Connector-Gateway PoP Latency is also available in the Sessions self-service view as an optional column. For more information about the metrics available on the Sessions Self-service view, see the Sessions self-service article.
May 16, 2023
Patterns detected in Black hole Machine Insights
Some machines in your environment though registered and appearing healthy might not service sessions brokered to them, resulting in failures. Machines that have failed to service four or more consecutive session requests are termed as Black hole machines. The Black hole machines insights show the number of black hole machines identified in your environment during the selected time period.
Now, top failure patterns detected with respect to the Delivery Group, single and multi-OS session machines is displayed on the Black hole machine insights panel and in the alert mail. These patterns are aimed to help you spot if there is a specific cohort of users experiencing the issue. In cases where the system is unable to highlight any pattern due to a distributed cohort, it is recommended to drill down to self-analyze.
For more information, see Diagnostic Insights: Black hole machines and Alert for Black Hole Machines.
Anomalous Latency Alerts based on user-specific baseline values
The Sessions with Anomalous latency alert that was based on a machine learning model to determine the latency value for all Delivery Group-Location pairs for a specific customer is now redeveloped to use a baseline latency value at a user level. The user-specific baseline is calculated using the P95 ICARTT values measured over the last 30 days.
Poor in-session responsiveness has been a common complaint for poor session experience among most users. The Anomalous Latency proactive alerts help administrators identify only those users with latency deviation from their own 30-day baseline latency. The user-specific baseline ensures meaningful comparison and appropriate alerting compared to checking against a static threshold.
You can now publish the Anomalous Latency alert notifications from Performance Analytics to a preferred Webhook listener in addition to receiving them via email.
For more information, see the Alerts article.
Apr 28, 2023
Data Availability
Accuracy of Performance Analytics depends on the data collected from various site infrastructure like the endpoints, machines, Gateway, and Delivery Controller. A good availability of the required metrics ensures that the data and insights provided by Performance Analytics closely represents the actual performance of the site.
The Data Availability feature helps identify sessions that do not have the data required to monitor the performance of your endpoints. Endpoint metrics like Endpoint Link Speed, Location, Throughput, ISP, Network Interface type, OS and Endpoint receiver version that are critical to analyze issues specific to endpoints.
Endpoint metrics require that the StoreFront/ Citrix Workspace be onboarded correctly, and the Citrix Workspace App versions installed on the endpoints are correct. Clicking the Data Availability icon on the User Experience (UX) Dashboard shows the number of sessions across all the onboarded sites which don’t have endpoint metrics during the past seven days. Clicking the session number opens the Sessions Self-service view listing these sessions.
To improve Data Availability:
-
Check if the corresponding StoreFront/Citrix Workspace has been onboarded correctly as described in Onboard Citrix Virtual Apps and Desktops on-premises sites using StoreFront.
-
Check if the endpoints are on the correct Citrix Workspace app version for the Endpoint Network Statistics feature as per Citrix Workspace app version matrix.
For more information, see the Performance Analytics article.
Endpoint IP and Name
Endpoint IP and name are added as columns on the Sessions Self-service view. This provides more visibility into the client-side network. For more information, see Self-service search for Sessions.
Apr 13, 2023
Integration of Citrix Analytics for Performance with the Splunk Observability platform (Preview)
Citrix Analytics for Performance is now integrated with the Splunk Observability platform. You can use the Data Export feature to export performance data and events from Citrix Analytics for Performance to Splunk.
You can get a holistic view of the performance metrics of all on-premises Citrix Virtual Apps and Desktops sites and DaaS cloud services that have been onboarded to your Citrix Analytics for Performance service on the Observability platform. Further, you can combine and correlate performance metrics from Citrix Analytics for Performance data with the external data sources connected within your Splunk instance.
You can create dashboards and reports in a regular cadence and derive actionable business insights into the performance of your virtual apps and desktop sites.
For more information, see the Data Export article.
To leverage this functionality, sign up and enroll to the Technical Preview using this form.
Apr 04, 2023
Custom Roles Support for Citrix Cloud Administrator Groups
You can now assign Citrix Cloud administrator groups in your Azure Active Directory with custom roles to access Citrix Analytics for Performance. The administrator groups must be configured on Citrix Cloud using Identity and Access Management > Administrators. For more information, see Identity and access management.
This integration enables a streamlined approach to manage service access permissions for administrator users and groups.
For more information on managing roles, see Manage Administrator Roles for Performance Analytics.
Feb 20, 2023
Support for 100K machines
Citrix Analytics for Performance is now optimized to support 100K machines. To know the recommended configuration and usage limits of Citrix Analytics for Performance, see the Limits article.
Feb 01, 2023
ISP, Endpoint Link Speed, and Endpoint Location visibility
The Sessions Details page now contains the ISP, Endpoint Link Speed, and Endpoint Location information. These additional session attributes help easier triaging. This feature is valuable to help-desk administrators accessing the Citrix Analytics for Performance from Director to troubleshoot session-related issues. For more information about all the session attributes, see the Session Details article.
Jan 23, 2023
Machine Load Indicator in Machines Self-Service View
Machine Load metrics based on the Load Indicator are added in the Machines Self-Service View. These metrics help quickly check the load on machines without having to drill down to multiple machine parameters like the CPU usage, memory utilization, and the number of sessions on the machine.
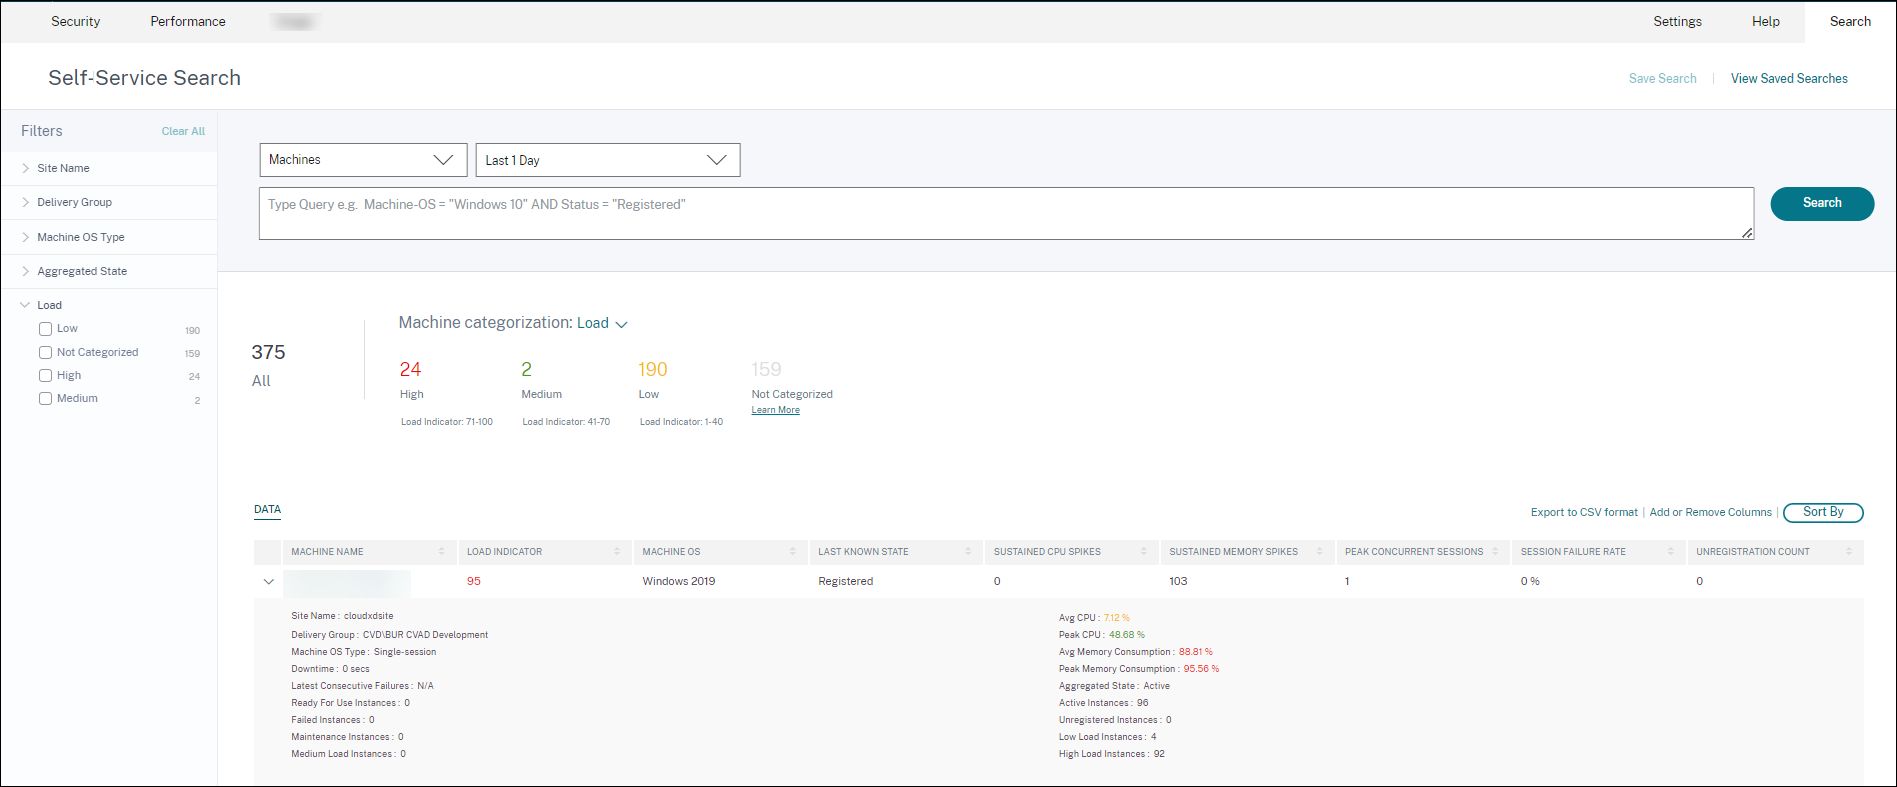
- The Machines self-service view now shows machine categorization based on the Load Indicator of the machines. Load Indicator for a machine is calculated based on the resource utilization, the overall user experience on the machine and the number of sessions hosted in the case of multi-session OS machines. The value is aggregated over the selected time period.
In the Machines self-service view, select Load in the Machine categorization dropdown. The machines are categorized as follows:
- High (red) - Machines with Load Indicator in the range 71-100
- Medium (green) – Machines with Load Indicator in the range 41-70
- Low (amber) – Machines with Load Indicator in the range 1-40.
- Not Categorized - The machines might not be categorized if they are in shutdown, unregistered, or failed state or if the resource data is not available for the machine.
- The Load facet with High, Medium, Low, and Not Categorized options help filter the machines to help further analysis.
- Machines self-service view has a Load Indicator column that shows the load score of the machine. The machine performance parameters available upon expansion of the machine row now show the number of High, Medium and Low Load Instances for the selected period. This helps quantify and evaluate the load on the specific machine.
This feature helps identify machines that are underutilized or overloaded. This further enables proactive action to ensure optimal usage of the infrastructure and improve the overall machine performance. For more information, see the Self-service article.
Jan 02, 2023
Baseline Insight on Sessions with Anomalous Responsiveness
The Sessions with Anomalous Responsiveness Baseline Insight shows the number of sessions that have recorded ICARTT values that are higher than the baseline ICARTT for the user. The user-specific baseline is calculated using the P95 ICARTT values measured over the last 30 days. Sessions with anomalous responsiveness are detected by comparing the current ICARTT measurements of the sessions with the user-specific baseline.
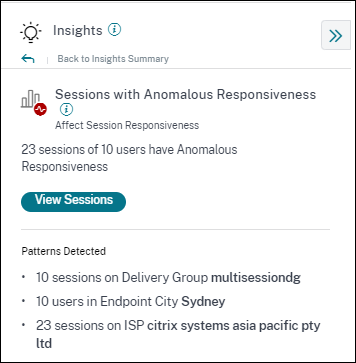
This insight helps quickly identify users experiencing poor in-session experience as compared to their own previous experience. The feature helps proactively monitor the environment and quickly troubleshoot issues related to session performance.
For more information, see the Insights article.
Dec 14, 2022
Custom Reports (Preview)
You can now create and schedule custom reports using the performance metrics in Citrix Analytics for Performance. Custom reports help you to extract information of specific interest and organize the data graphically. It helps create executive reports in a regular cadence and analyze the performance of your environment over time. For more information, see Custom Reports.
Nov 18, 2022
Machine Catalog, Hypervisor, and Provisioning Type visibility
The Machine Statistics page now displays the Hypervisor Name, Catalog Name, and Provisioning Type of the machine as a part of the key machine parameters. This data helps triage issues related to machine performance. Specifically, this data helps find similar machines which might have performance issues, using the Hypervisor, Catalog or Provisioning type attributes. For more information, see the Machine Statistics article.
Oct 13, 2022
WEM Health Check
You can now perform health checks on machines from Performance Analytics. Workspace Environment Management™ (WEM) is a user environment management tool that helps optimize desktops for the best possible user experience. The new WEM Task Health Check action introduced on the Machine Statistics page helps run WEM scripts to get information on the status of machines.
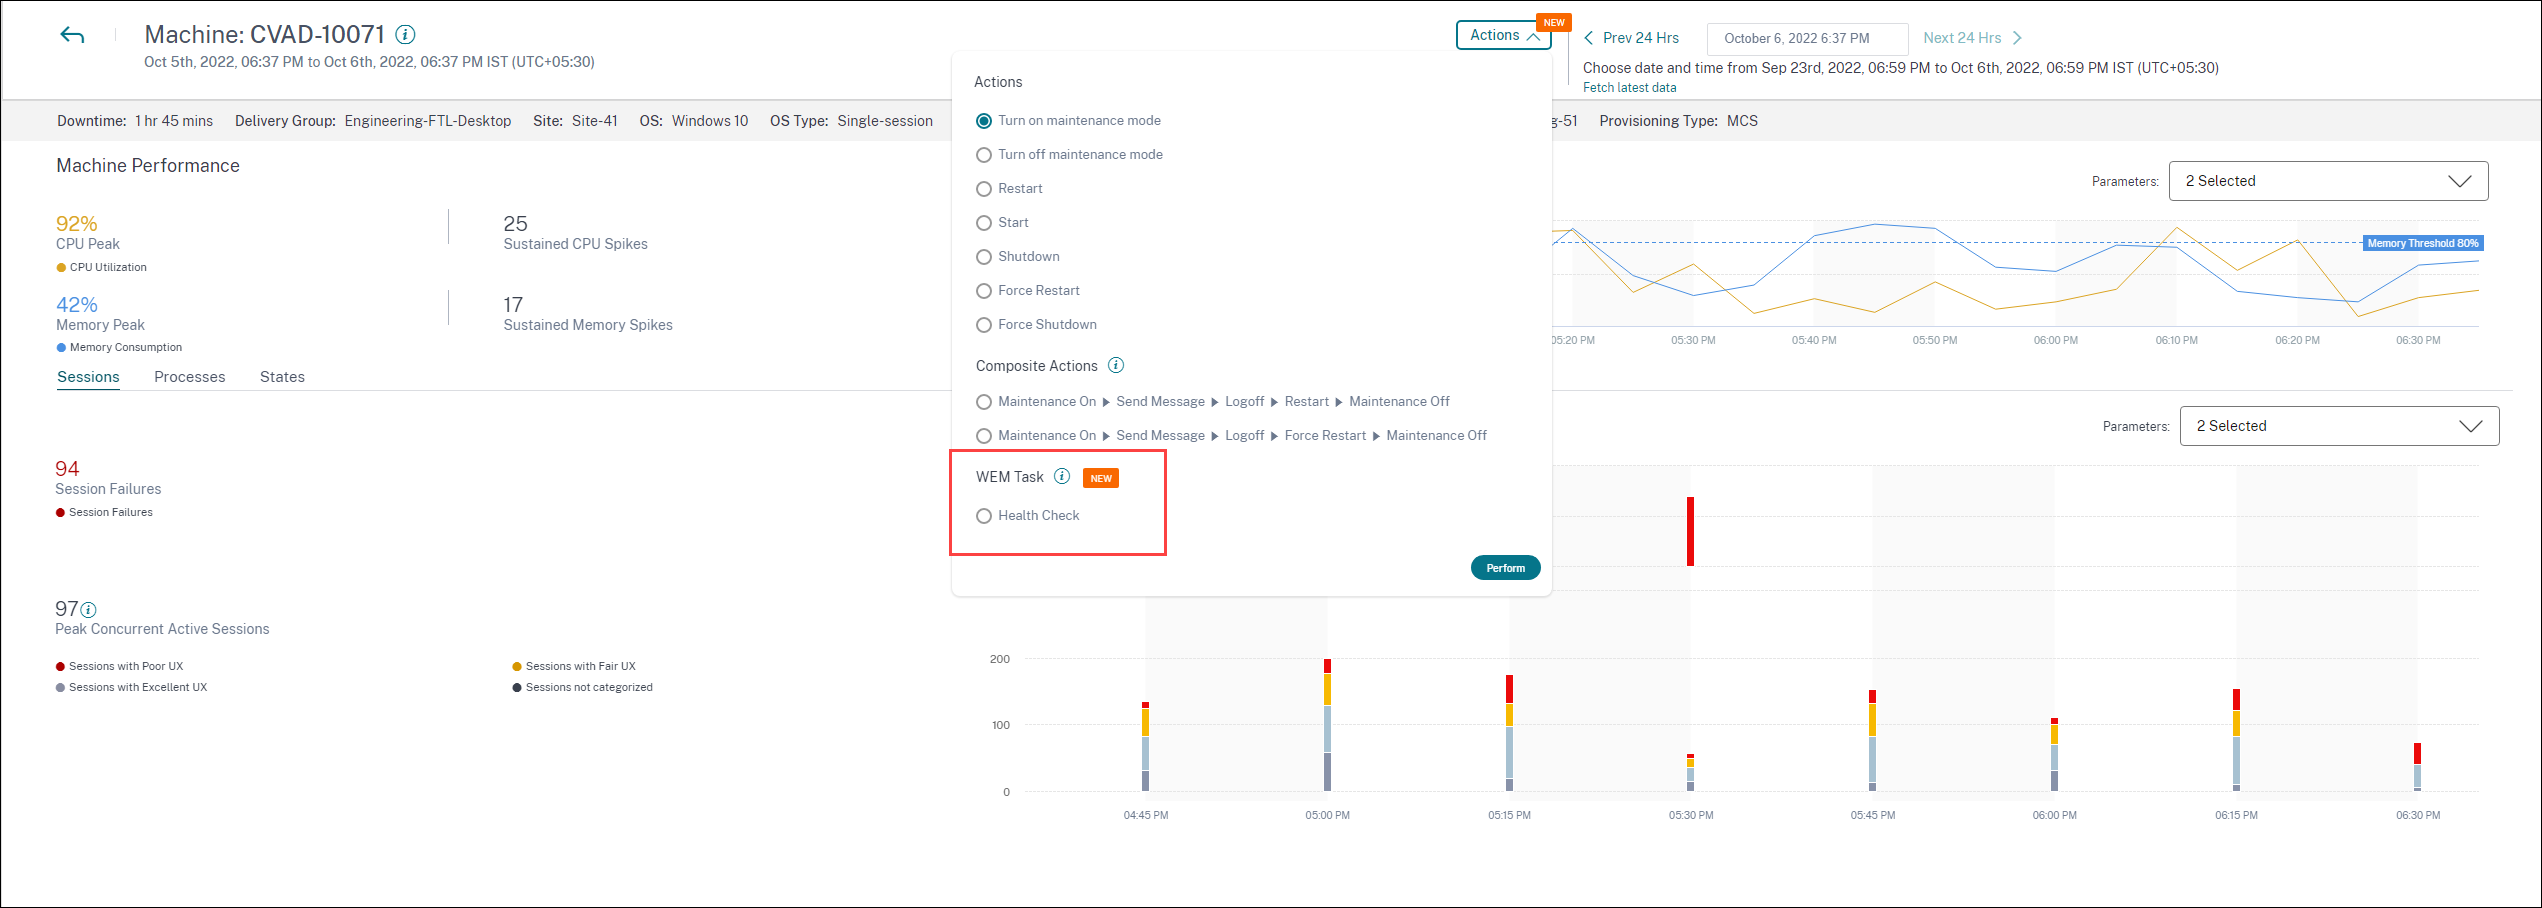
This helps root cause common machine issues easily without having to go to the WEM terminal.
A detailed report of the WEM Health Check and possible actions that can be performed to fix them is also provided.
WEM Actions are enabled for Cloud admins with full access and valid entitlement to WEM.
For more information regarding the usage of the WEM Task Health Check action in Performance Analytics, see WEM Tasks - Health Check.
For more information regarding the WEM Task Health Check, see the Scripted Tasks article in the Workspace Environment Management documentation.
Oct 11, 2022
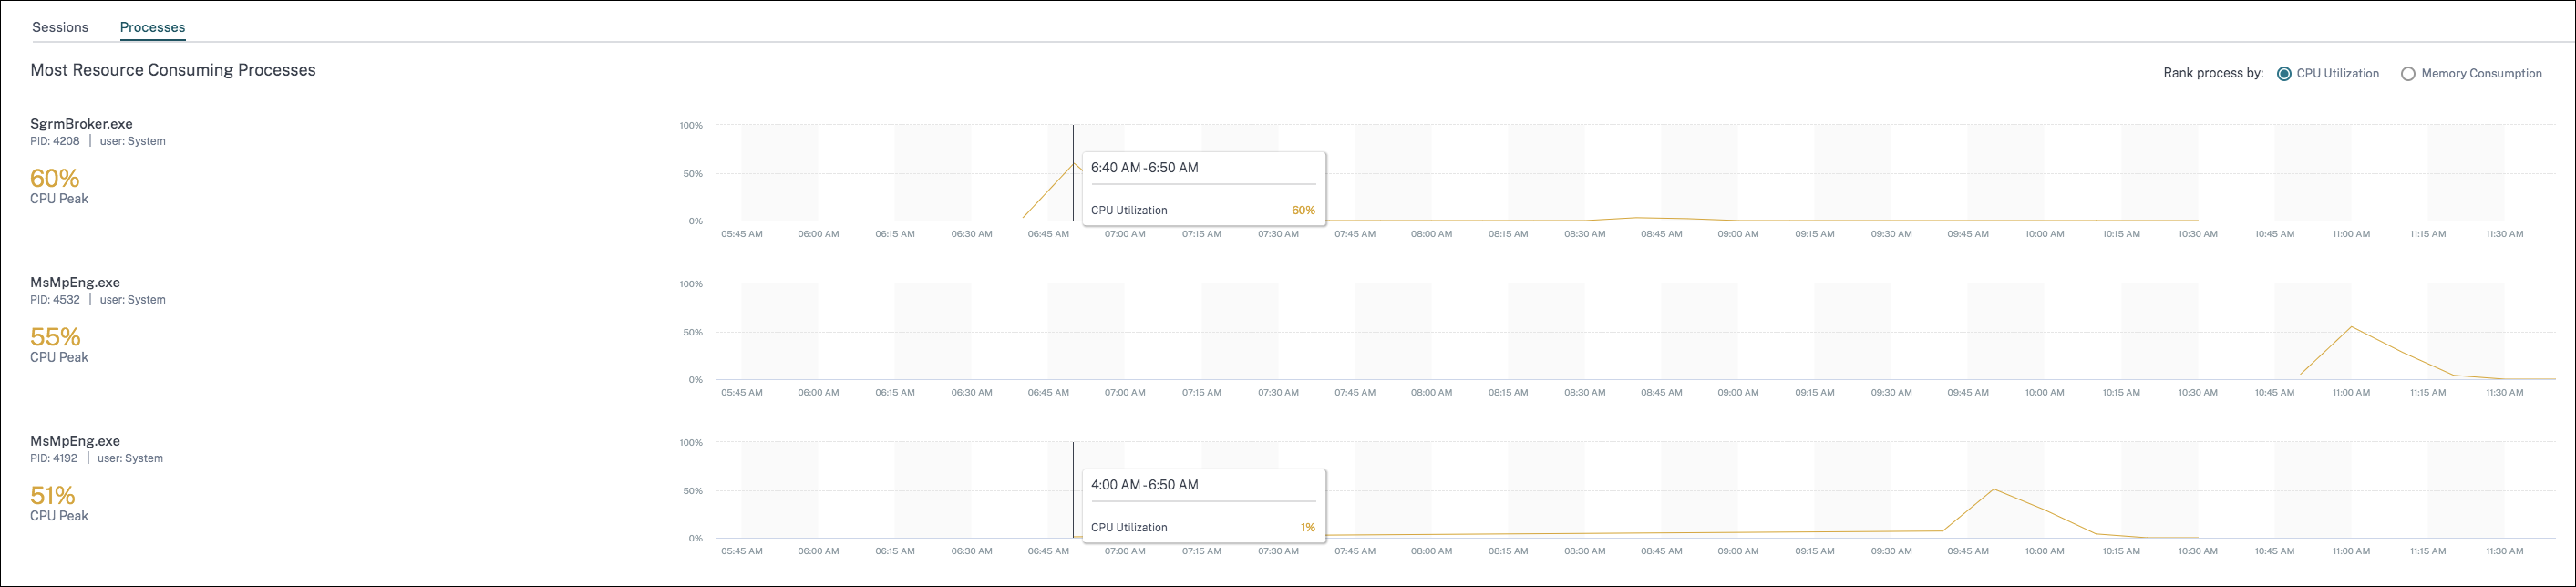
Process Visibility Improvements
Now, processes running on single-session OS machines are also displayed in the Process tab of the Machine Statistics view along with processes running on multi-session OS machines. This feature is available for machines running on cloud and on-premises environments. Up to 10 top resource consuming processes are displayed in the Process tab. The top resource-consuming processes are displayed even if there are no memory or CPU spikes during the selected time period. This feature requires that you enable the Process Monitoring policy from Citrix Studio for both, single-session and multi-session OS machines. This policy is disabled by default, and must be enabled explicitly to view the processes running on the machine. For more information, see the Machine Statistics article.
Sep 30, 2022
Baseline Insights
Insights are now displayed in two categories:
-
Diagnostic Insights: The Blackhole Machines, Zombie Sessions, Overloaded Machines and Communication Error Diagnostic Insights are available on the Diagnostic sub-pane. These insights give crucial updates about failures that have occurred on the site.
-
Baseline Insights: The Baseline Insights are introduced to show the deviation of key performance metrics from the historical baseline. These insights show if key metrics are improving or deteriorating in a glance. They help spot incident indicators quickly and take proactive steps to improve the performance of your environment.
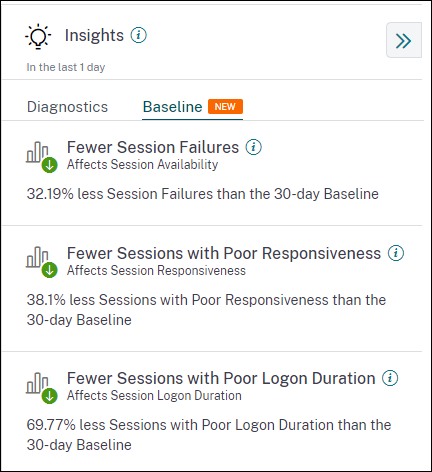
Baseline Insights for Poor Session Failures, Session Responsiveness, and Session Logon Duration are available on the Baseline subpane.
Deviation from the baseline is also displayed on the User Experience dashboard. They are available for Session Failures under the User Sessions section and the Poor Sessions categorized under the Session Responsiveness and Session Logon Duration sections. Clicking the deviation displays the respective Baseline Insight.
For more information, see the Insights article.
Sep 28, 2022
Webhook Support for Alerts Notifications
You can now publish alert notifications from Performance Analytics to a preferred Webhook listener. This feature allows you to get notified on your chosen channel such as Slack, JIRA. This helps enterprise customers automate the flow from incident detection to closure, and hence easily drive workflows in response to Performance Analytics Alert notifications. For more information about configuring alert policies with webhook, see Webhook Support for Alerts Notifications.
Sep 07, 2022
Export limit in CSV export increased
The limit on the number of rows that you can export using the Export to CSV format feature on the Self-service pages is now increased from 10K rows to 100 K rows. For more information regarding the export functionality, see the Self-service search article.
Aug 05, 2022
Black Hole Machines Alert
Citrix Analytics for Performance scans for black hole machines every 15 minutes and sends out an alert to enable administrators to proactively mitigate session failures faced by users due to black hole machines. Machines that have failed to service four or more consecutive session requests are termed as Black hole machines. With black hole failure alerting, administrators need not log into Performance Analytics to know the session failures that occurred due to black hole machines. Details of the machines and the session failures caused by them are sent in the alert mails to administrators. The Black Hole Machines alert policy must be enabled to receive these mails.
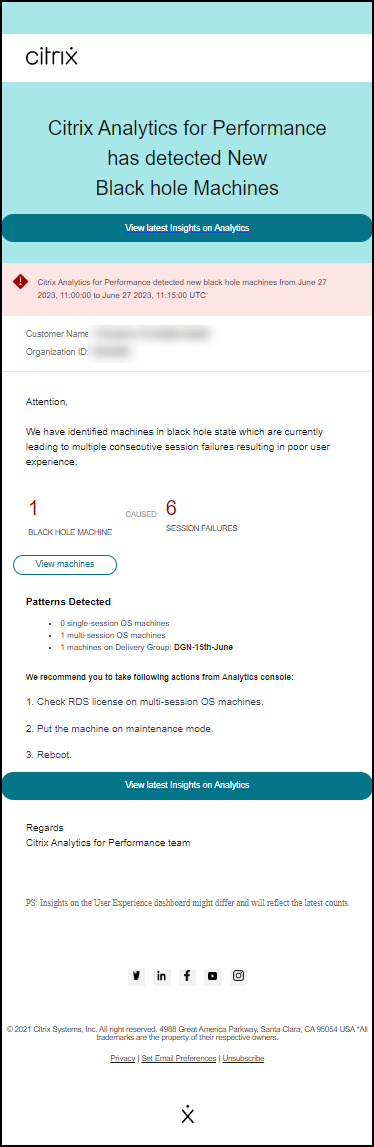
For more information about Black Hole Machine Alerts, see the Alerts article.
July 29, 2022
Overloaded Machines - Insights and Alerts
Insights on overloaded machines are available on the User Experience dashboard.
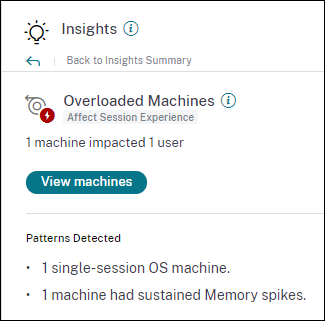
Machines that have experienced sustained CPU spikes, or high memory usage, or both, that have lasted for 5 minutes or more, resulting in a poor user experience are considered to be overloaded. The Overloaded Machines insight shows the number of overloaded machines causing poor user experience and the number of users affected during the selected duration.
For more information, see Overloaded Machine Insights.
An Overloaded Machines alert mail is sent to administrators when a new overloaded machine is detected in the environment in a 15 mins interval. A re-alert mail is sent if the same machine remains in the overloaded condition after 24 hours. The administrators are re-alerted up to three times regarding machines that continue to be overloaded. Pro-active alerting helps administrators who are not currently logged on to Citrix Analytics for Performance detect and handle overloaded resources.
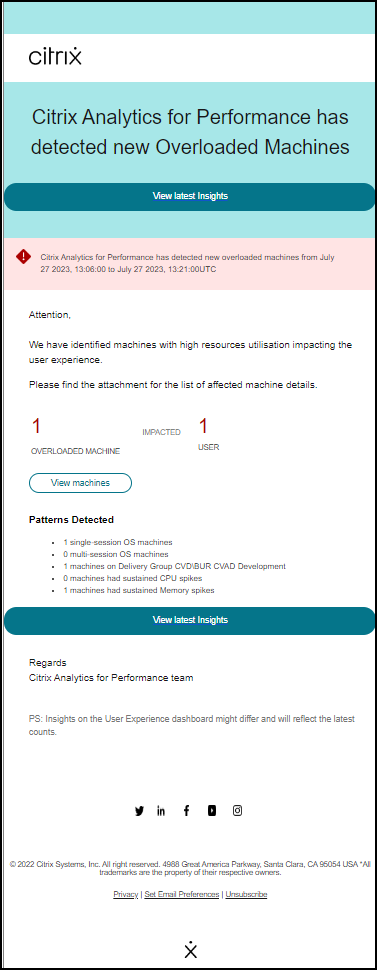
For more information, see Overloaded Machine Alerts.
July 18, 2022
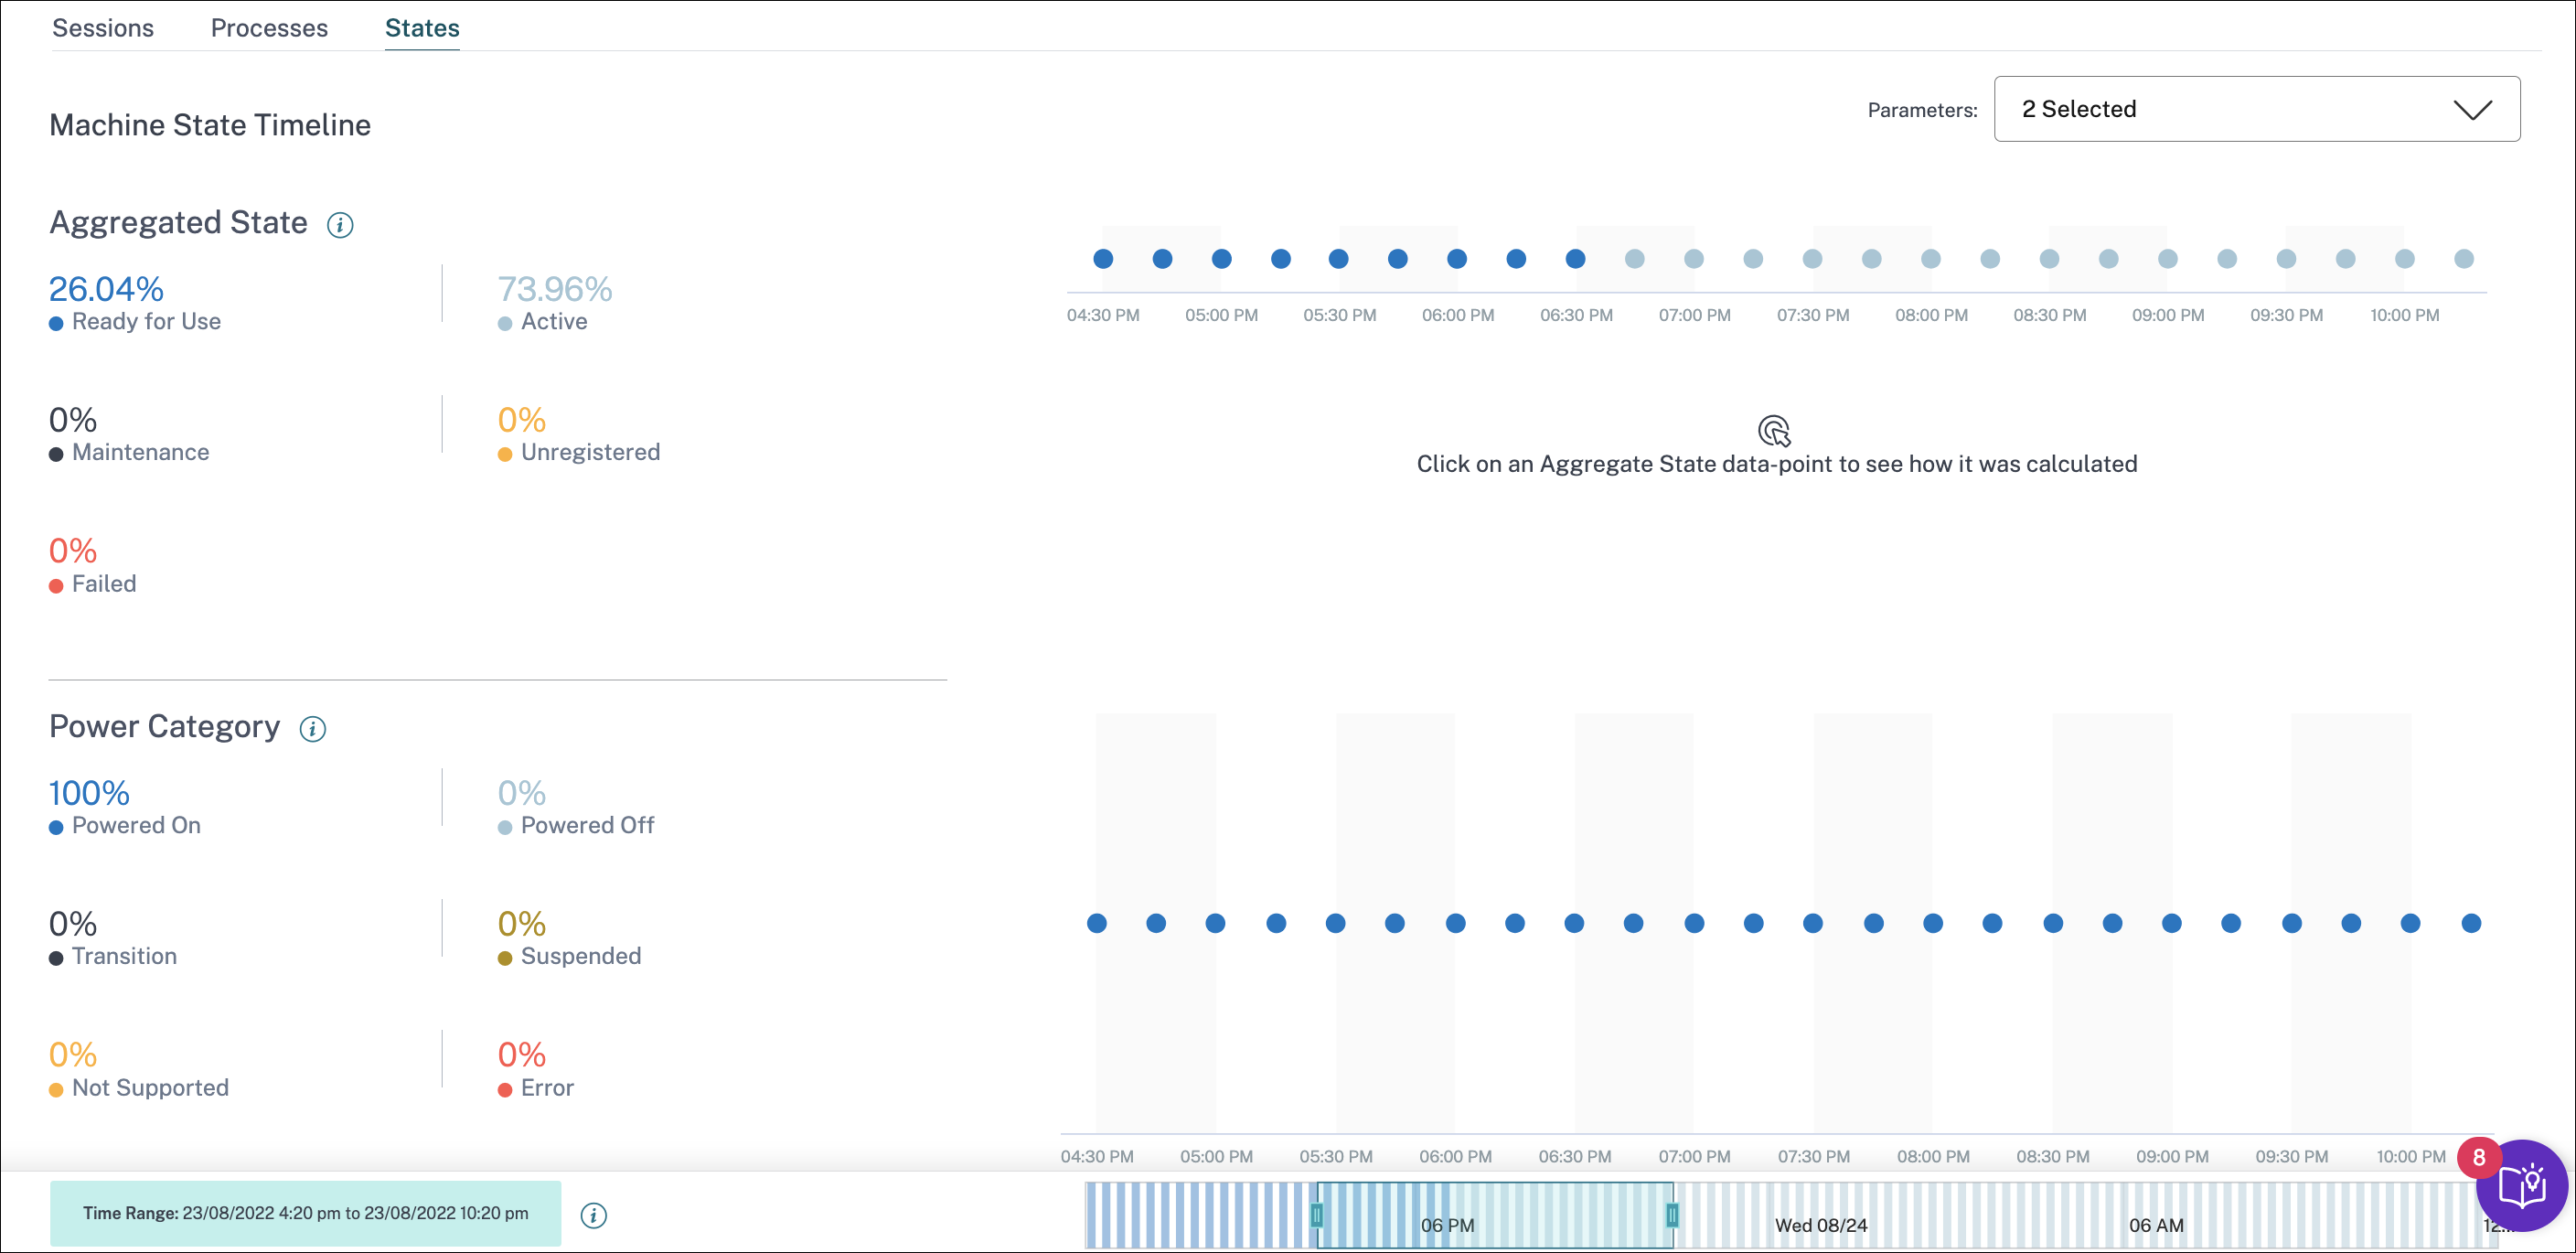
Machine States
The Machine Statistics page now includes information on Machine States. The States tab shows the timeline of Machine Aggregated State and Machine Power Category plotted at 15 min intervals for the last 24 hours. Clicking an Aggregated State data point helps understand how it was calculated. A breakdown of the actual values of Machine State and Maintenance Mode that resulted in the plotted Aggregated State is displayed. This helps comprehend the machine’s state changes over time. Failure Type and Deregistration Reason help debug machine issues. Hover over the Power Category data point to see the actual Power State the machine has been in. This feature helps slice and dice important parameters concerning the machines in the environment and spot inefficiencies easily. Along with the Sessions and Processes information already available in this view, the Aggregated State and Power Category transition over time gives in-depth information to troubleshoot machine issues.
For more information, see the Machine Statistics article.
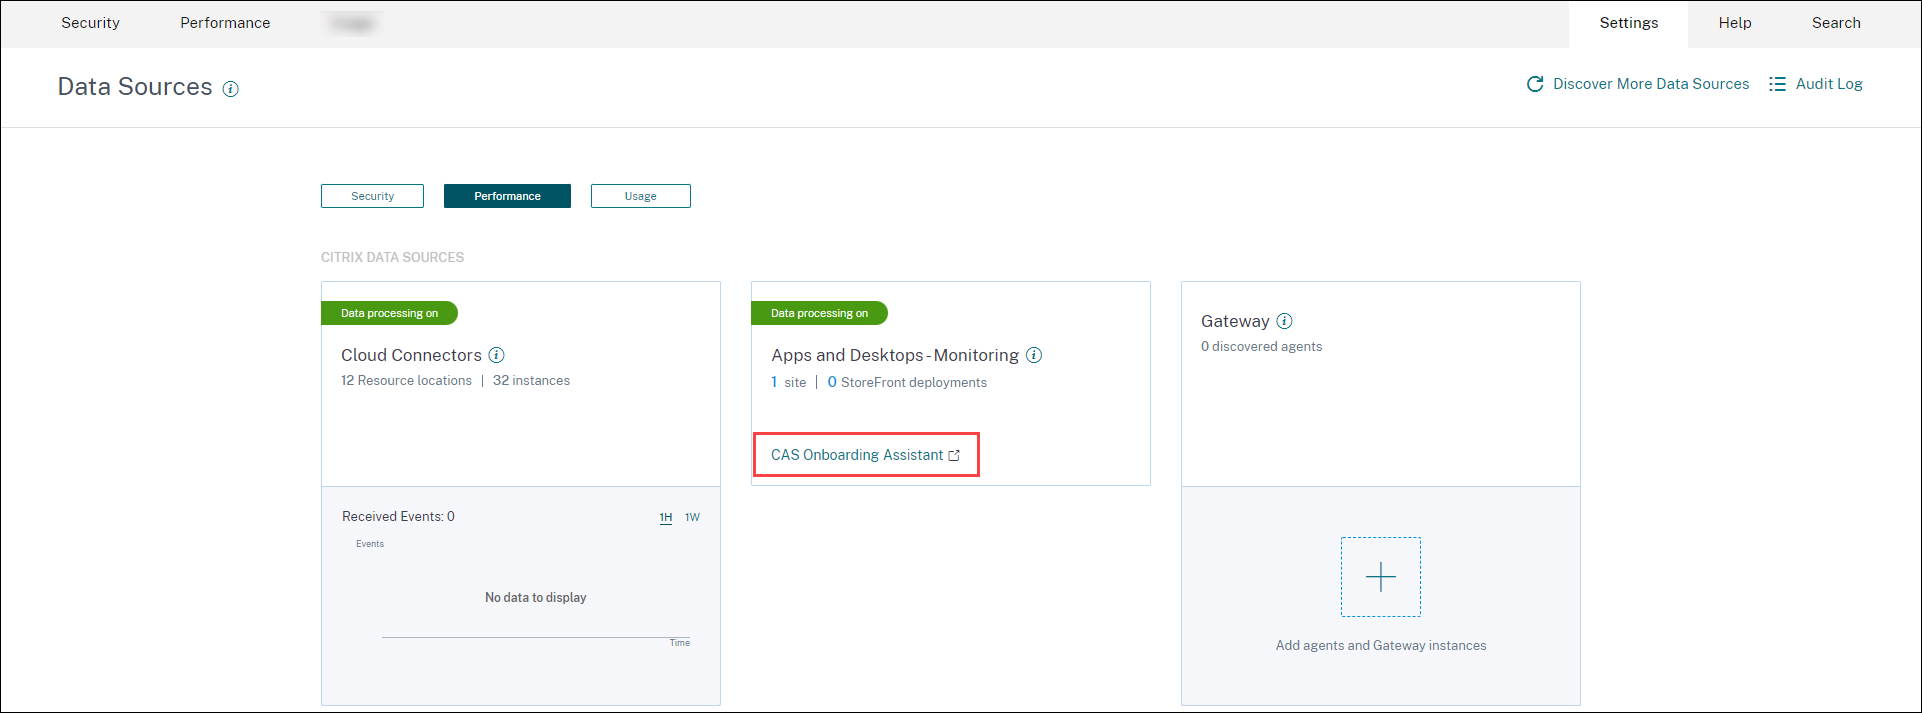
Citrix Analytics Service (CAS) Onboarding Assistant
The Citrix Analytics Service Onboarding Assistant tool helps troubleshoot issues while onboarding StoreFront with the Citrix Analytics service. The StoreFront server might fail to connect to Citrix Analytics after importing the configuration settings from Citrix Analytics to the StoreFront server. CAS Onboarding Assistant automates all the checks and prerequisites mentioned in the document, Unable to connect StoreFront server with Citrix Analytics. For more information on the usage and to download the tool, see the Knowledge Center article, Citrix Analytics Service Onboarding Assistant.
Reasons for Users or Sessions being Not Categorized
Users and sessions that cannot be classified into excellent, fair, or poor categories due to configuration issues or dependencies are classified as Not Categorized. The Know more link below the Not Categorized classification in the User Experience and Session Responsiveness trends displays the primary reasons for certain users and sessions not being categorized. This feature provides the clarity required to quickly discover and fix any configuration issues.
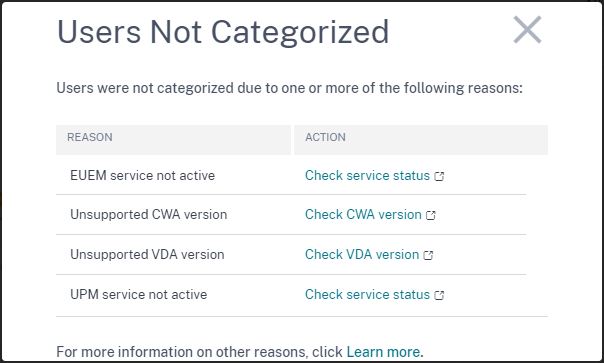
For more information, see the Not Categorized article.
Jun 08, 2022
User and Session Classification in Percentages
The User Experience dashboard shows the classification of connected HDX™ users and sessions as excellent, fair, and poor. These numbers are now displayed in percentages as well.
Apr 28, 2022
Anomalous Latency Alerts
Poor in-session responsiveness is the primary cause for poor session experience. The Anomalous Latency Alerts feature alerts administrators when there is a significant deviation in the session latency values. The proactive alerting helps administrators identify specific locations or Delivery Groups from which poor sessions might be originating.
A machine learning model is used to determine the baseline latency value for all Delivery Group-Location pairs for a specific customer. The baseline latency value is calibrated every day based on the ICARTT values from the last three days. Any outlier measurements of ICARTT are ignored. If the measured ICARTT has a deviation of 60% or more from the baseline latency value, an alert is generated.
For more information, see the Alerts article.
Apr 20, 2022
Performance Analytics specific Custom Access roles
Custom Access Roles specific to Citrix Analytics for Performance are now available. As a Citrix Cloud administrator with Full access permission, you can invite other administrators to manage Performance Analytics in your organization using the following roles.
- Performance Analytics- Full Administrator - Assigns full access permission to the Citrix Cloud administrators of Performance Analytics.
- Performance Analytics- Read-Only Administrator - Assigns read-only access permission to the Citrix Cloud administrators of Performance Analytics.
You can provide read-only or full access permissions to your administrators and allow them to manage the various features of Performance Analytics. This update allows you to create administrators and provide access based on a specific Citrix Analytics offering. The users with the Read Only Administrator role that was available earlier is now renamed to Security & Performance - Read Only Administrator.
Read Only Performance Analytics users can access and use the User Experience and Infrastructure Dashboards like the Full Administrators. However, Machine Actions on the Machine Statistics page are disabled for read-only users. Administrators with read-only access will not receive alert notifications from Citrix Analytics.
For more information on the actions allowed on the Self-service view, see the Self-Service article.
Apr 14, 2022
Zombie Insights and Alerts
The Zombie Sessions subpane shows information on session failures that have occurred due to zombie sessions in the environment. A zombie session is an abandoned session on a single-session OS machine resulting in new session launches on the machine to fail. Attempts to launch sessions on this machine fails with an Unavailable Capacity error until the abandoned session is terminated. Zombie Sessions insights aim to help spot these machines with abandoned sessions, thus enabling proactive mitigation of these failures.
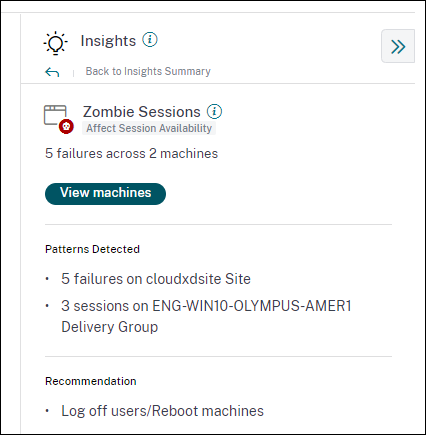
A Zombie session alert mail is generated when a new machine with a zombie session is detected in the environment in a 15 mins interval. Alert mails are sent to full administrators who have enabled email notifications in Citrix Cloud. Re-alerting on the same machine is done only if the same-abandoned session persists on the same machine for over 24 hours from the initial detection.
Clicking View machines displays the Self-service view filtered with the list of machines containing Zombie Sessions. Here, Failure Count represents the number of session failures that have occurred in the selected interval. The Last Failure Type and Reason help root cause reasons for machines containing zombie sessions.
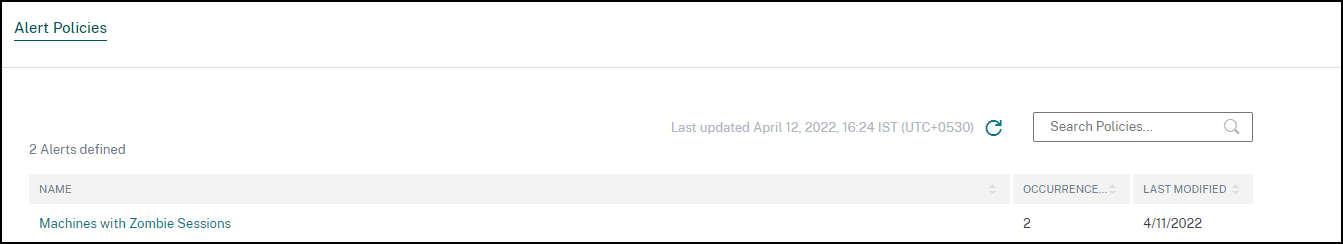
You can disable the Machines with Zombie Sessions alert from the Alert Policies tab.
For more information, see Zombie sessions.
Apr 14, 2022
Breakup of Unique Users and Sessions Numbers
This feature brings more clarity to the Not Categorized numbers on the User Experience dashboard. The dashboard now shows the breakup of users and sessions in the virtual apps and desktops environment based on the session protocol and the connection status.
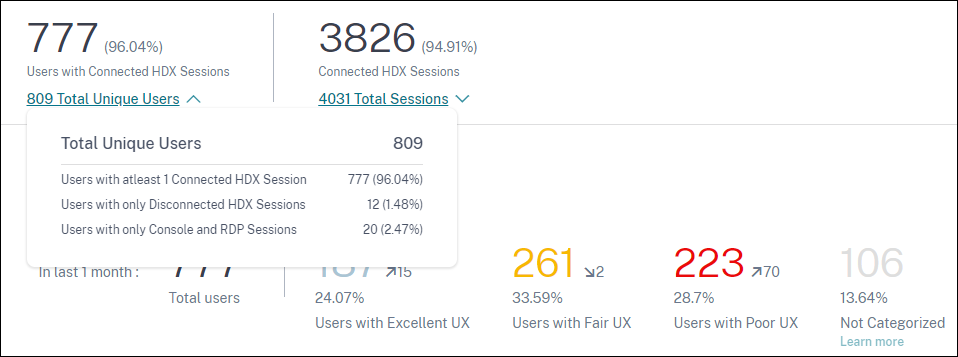
The dashboard provides performance metrics for only connected HDX sessions. Sessions that have been disconnected throughout during the selected period indicates that the user was not active for the entire selected period. Hence, Session and User Experience scores are not applicable for disconnected sessions.
With this feature, disconnected sessions and users are no longer in the Not Categorized classification. They are now available in the breakup. This reduces the number of users and sessions in the overall Not Categorized classification. For more information, see Breakup of Users and Sessions.
Apr 14, 2022
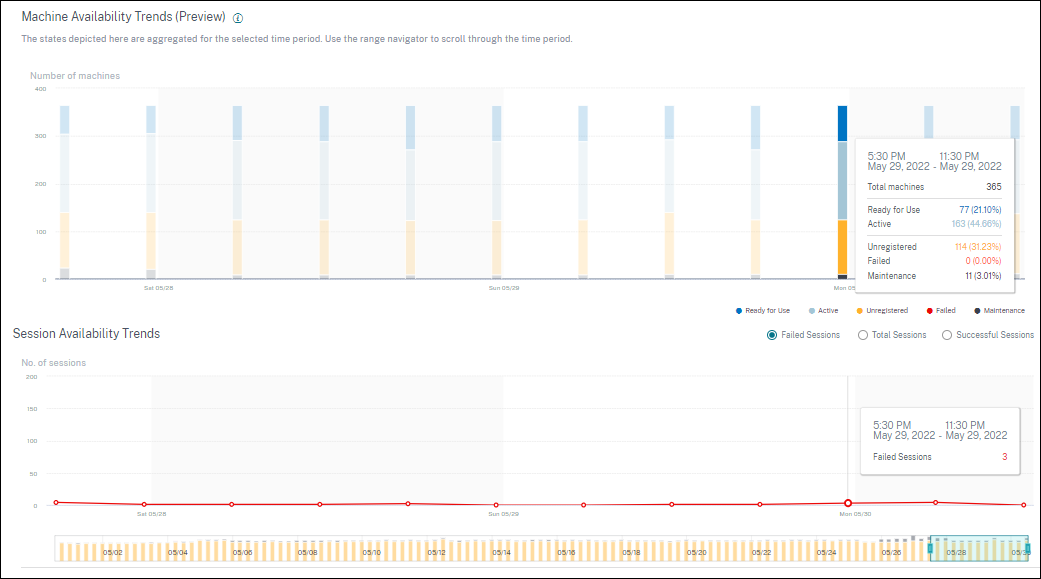
Infrastructure Dashboard Enhancements
The Infrastructure dashboard that shows the availability and performance analytics for virtual machines in your apps and desktops environment has the following enhancements.
-
The Infrastructure dashboard is now enhanced to show the current availability of virtual machines. This enhancement gives an overview of the number of machines currently serving users and the number of machines that are unavailable for various reasons. The machine counts in the last known Available machine states (Ready for Use, Active) and Unavailable machine states (Maintenance, Unregistered and Failed) is displayed for the last instance (15 minutes).
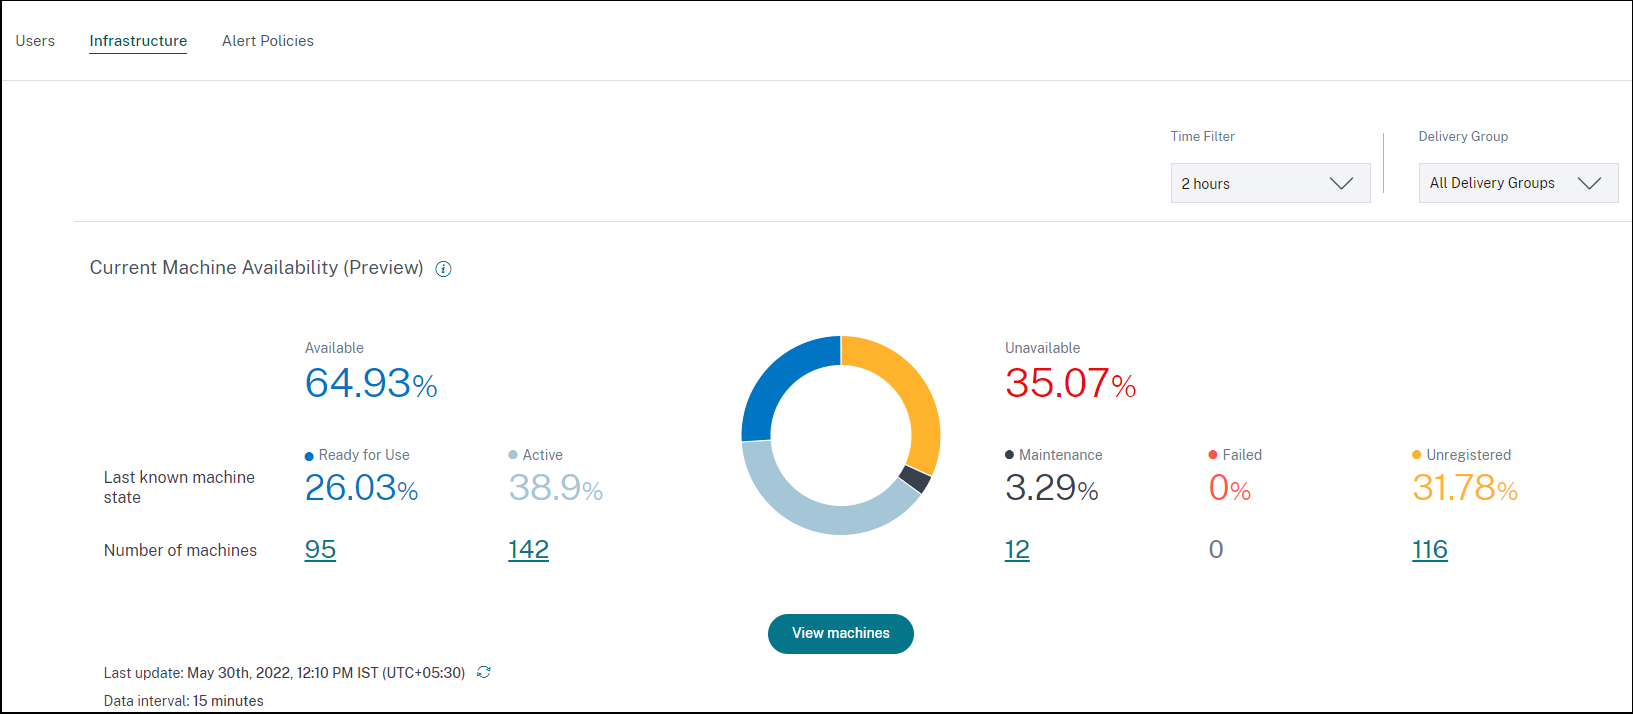
-
Clicking the machine count opens the Machine Self-service view with the list of machines in the selected state for the last 15 minutes.
-
The Machine Availability trend now plots machine counts in aggregated states for the selected period. The aggregated state is the least favorable state that the machine has been in, from among the Ready for Use, Active, Maintenance, Unregistered and Failed states. You can drill down from a specific section on the graph to view details of machines in a specific aggregated state on the Machine self-service view. The Machine Availability trend helps check the number of machines in an aggregated state at a point in time. When used alongside the Session Availability trend, it helps understand the impact of a resource crunch or an outage.
-
Trends for one-month and one-week periods are now plotted with a 6-hour granularity. You can zoom into the one month Machine and Sessions Availability trends using the time navigator in a 3–7 day range.
-
The time navigator now reflects the Machine Availability trend. This helps identify time periods with a large number of unavailable machines, so you can easily navigate and zoom into the required period on the trend.
-
The tool tips on Machines and Sessions Availability trends are synchronized to help understand the correlation between unavailable machines and failed sessions.
-
The Machines Self-service view has a new facet called Aggregated State, to allow state-based filtering of machines. The view has the machine count displayed for the selected Aggregated States. You can now use the Aggregated State facet or click from the Availability trend, to see the list of machines that were in a specific aggregated state for the chosen time.
-
New columns are added to the Machines self-service view - Last Known State, and the machine count in each of the selected Aggregated states.
These enhancements help identify machines in a particular state currently or at a historical time period on the Machines Self-service view. They enable better troubleshooting of machines as they give higher granularity of data and help identify machines that need attention easily. For more information, see the Self-Service search for Machines and the Infrastructure Analytics articles.
Mar 08, 2022
Endpoint Network Statistics
This feature provides more visibility into the client-side network, as several relevant metrics are added on the Sessions Self-service view and the Sessions Statistics view.
Endpoint Link Speed (P95), Endpoint Throughput Incoming (P95), Endpoint Throughput Outgoing (P95) are introduced as optional columns on the Sessions Self-service view.
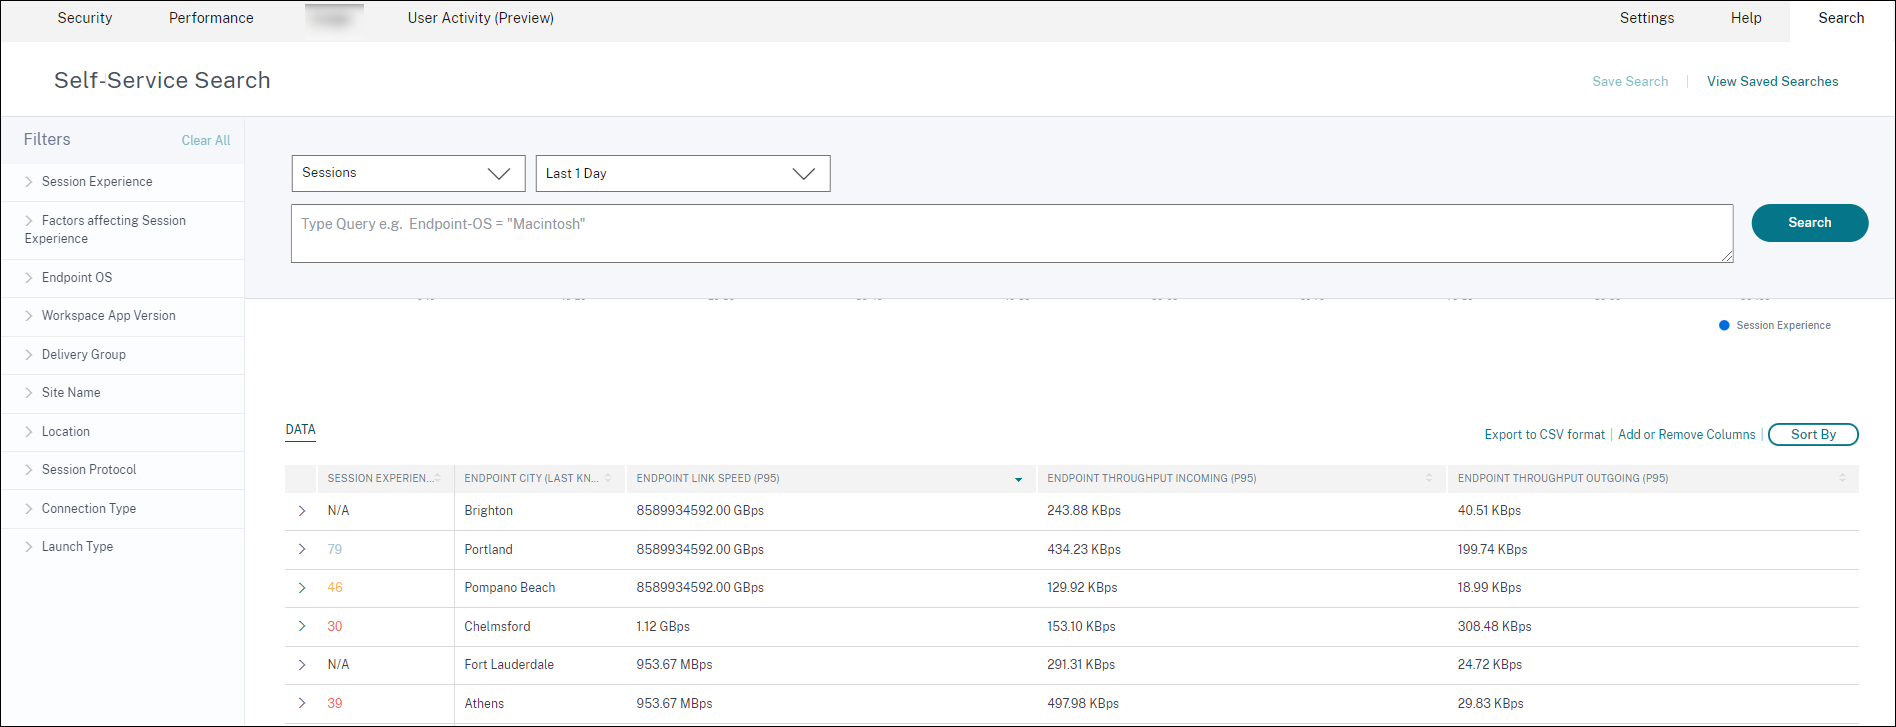
The Session Statistics page now displays the P95 values of WiFi Signal Strength, Endpoint Throughput Incoming, and Endpoint Throughput Outgoing in the Factors tab. Graphs of these metrics are plotted through the session duration.
You need endpoints running Citrix Workspace app for Windows version 7 2108 or later to view Endpoint Network metrics.
These metrics along with existing values of Network Interface Type, ISP, Bandwidth, Network Latency, Gateway, Connector, and Connector performance statistics help better triage the root cause of poor session experience.
For more information, see the Self-Service search and the Session Details articles.
Mar 07, 2022
Visibility into Connection leased sessions
This feature provides visibility into sessions that were launched via a Connection lease. During Cloud service outages, Citrix DaaS™ supports sessions to be launched via a Connection lease to maintain service continuity. Connection leased sessions are displayed under the Not Categorized classification on the User Experience Dashboard. ICA® RTT and logon duration metrics are not available for Connection leased sessions.
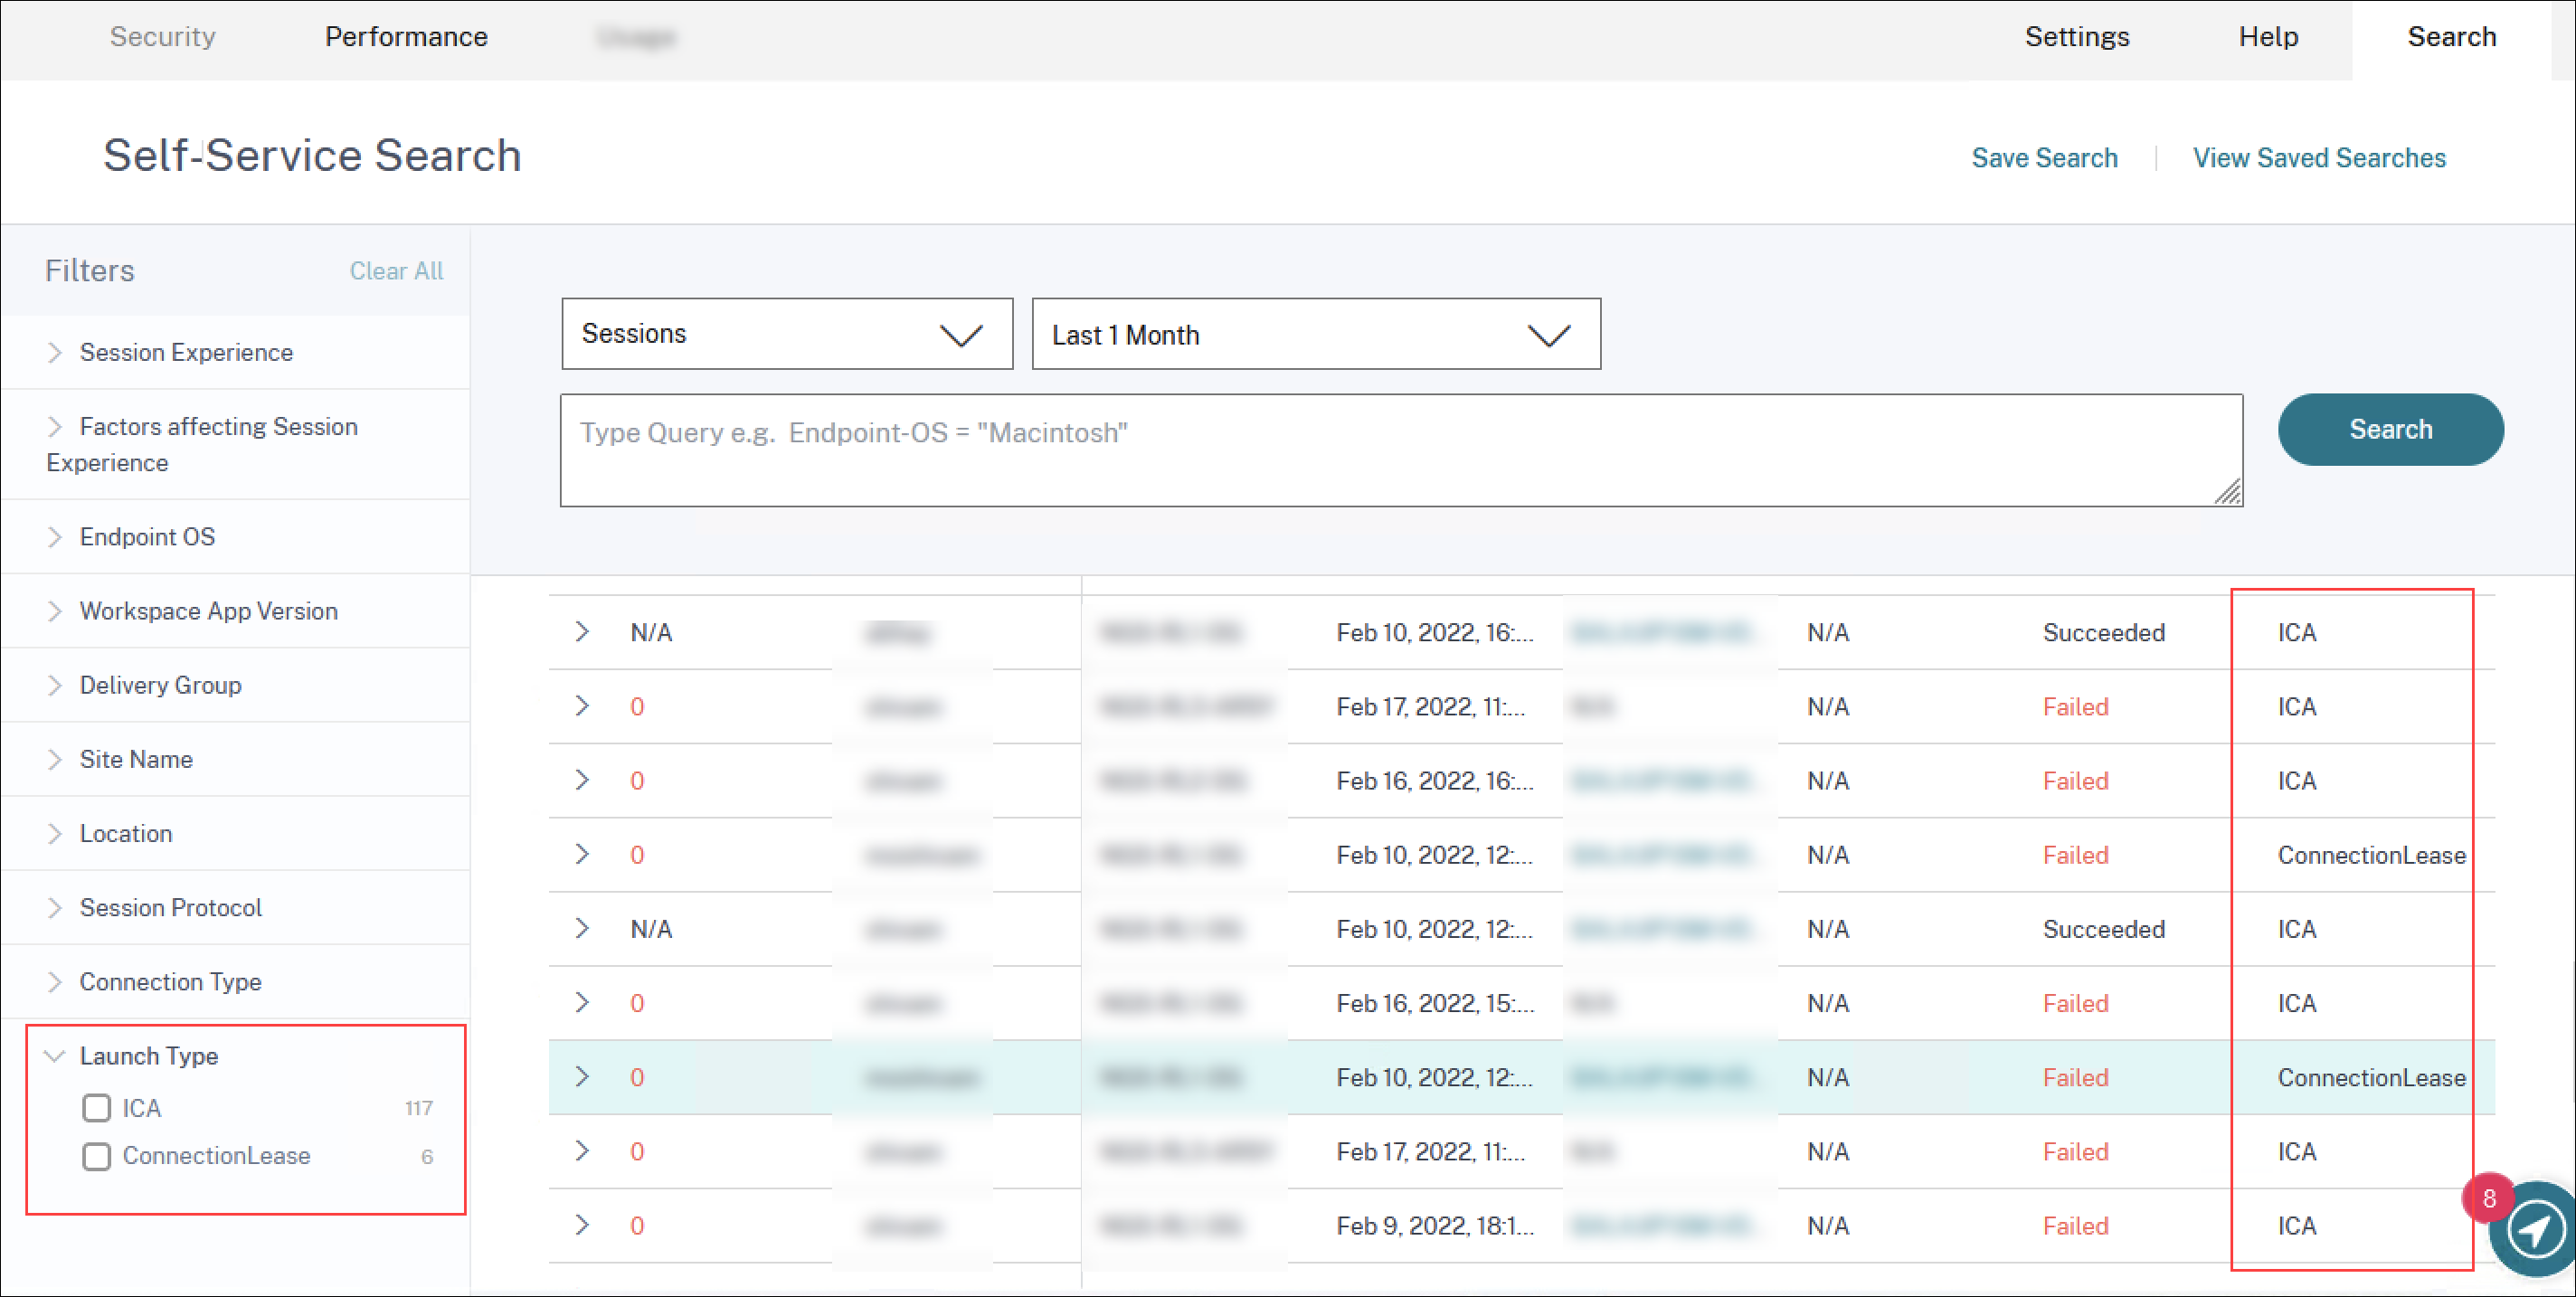
You can see the classification of sessions as ICA based or Connection leased using the Launch Type facet on the Sessions Self-service view. The optional column, Launch Type on the Session Self-service table shows if sessions are ICA based or Connection leased. This feature helps find the number of sessions that were launched via Connection Lease. You can use the failure reason to troubleshoot Connection leased sessions that have failed to launch.
Feb 21, 2022
Connector and Gateway PoP Statistics
Citrix Analytics for Performance now has the Connector and the Gateway Points of Presence (PoPs) names displayed on the Session Self-service view as optional columns for all launched sessions.
This data helps identify Connectors and Gateway PoPs through which sessions are routed. This information helps check if sessions with poor responsiveness are routed through specific Connectors or Gateway PoPs. Based on the user location, you can further identify if the user session was routed through the right Gateway PoP for optimal performance. If the session has been routed through a Gateway PoP farther away from the location, you can check the DNS configuration.
The pivots for Connector and Gateway PoP on the Visual summary help triage poor sessions that might all be routed through a single Gateway PoP or Connector.
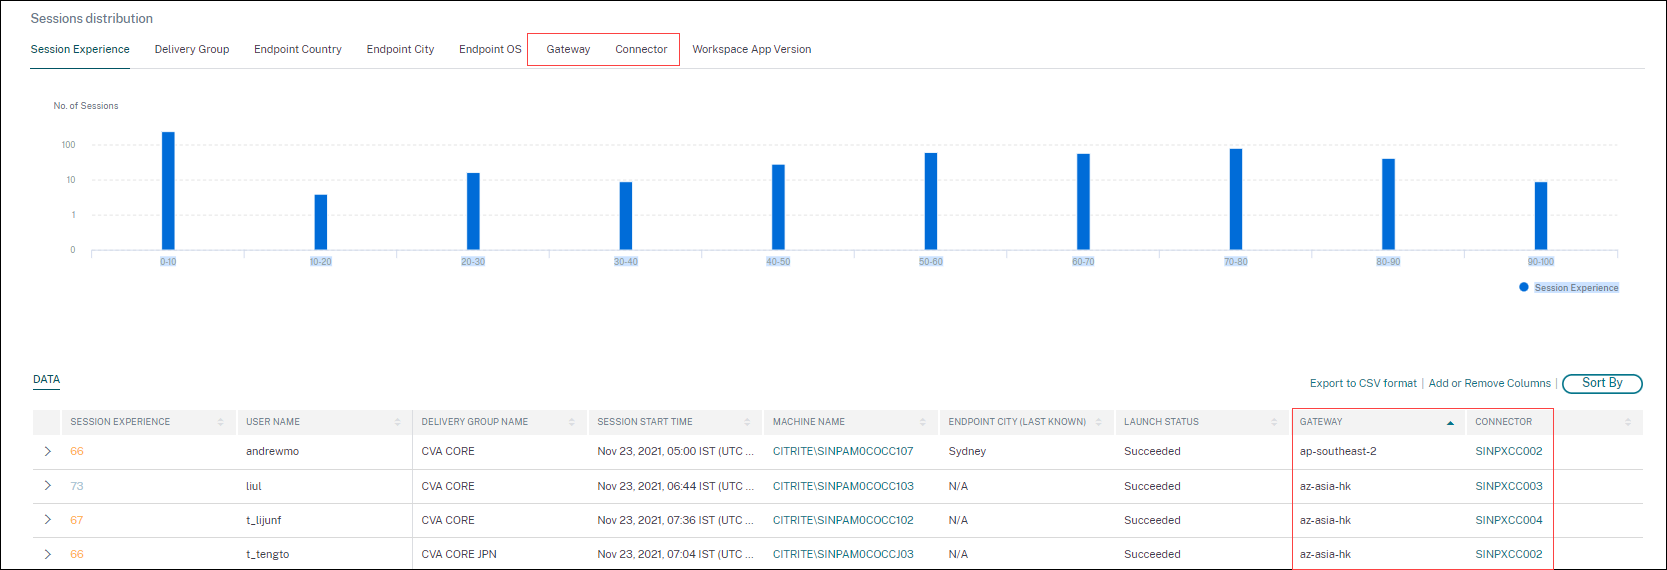
The value of the Connector might be N/A for any of the following reasons:
- There was a delay in receiving Connector events.
- Cloud Connector version is earlier than 16.0.0.7.
Also, ensure that the data processing via your Cloud Connectors is on. To do this, you can check the Data processing on state on the Cloud Connectors tile from the Performance tab in Citrix Analytics > Data Sources.
For more information, see the Connector and Gateway column descriptions in the Self-Service search article.
Connector Statistics View
A comprehensive view of the performance metrics of connectors is now available in Citrix Analytics for Performance. Clicking the connector name leads to the Connector Statistics view.
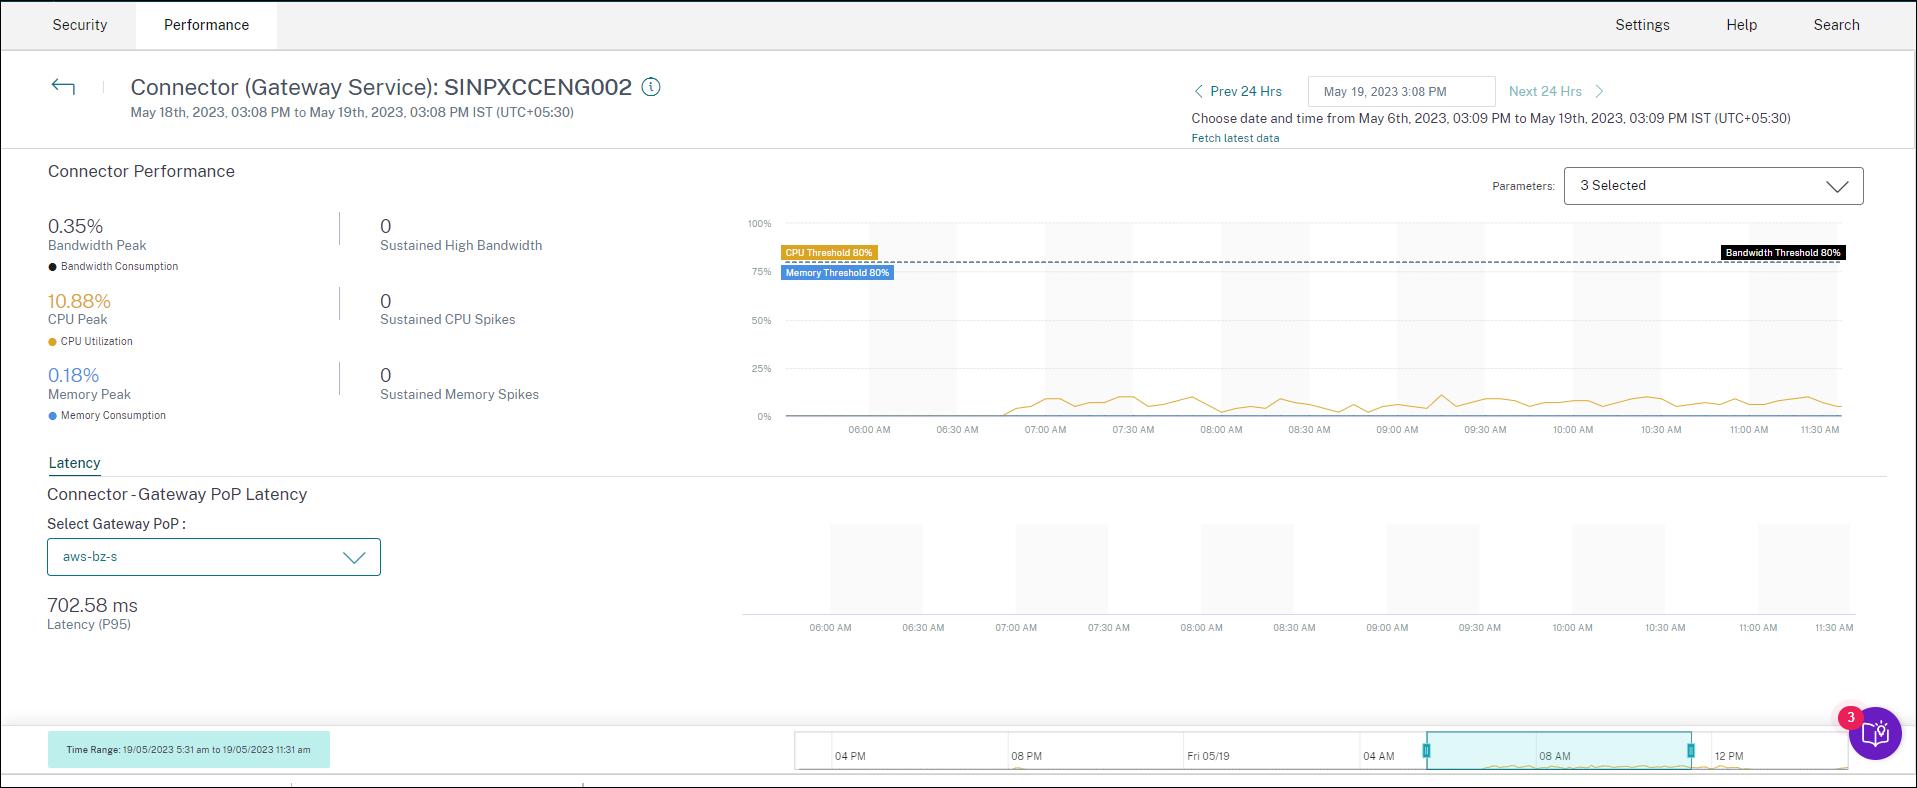
Connector Statistics view provides a summary of the connector performance in terms of its resources - bandwidth, CPU, and memory consumed for a selected connector in the last 24 hours. The peak percentages of each metric consumed in the connector along with the number of instances when the metric crossed the threshold value is displayed. The graph plots this data over the 24 hour period available at a 15-minute granularity.
Resource consumption on the connector affects session launches and end user experience. This feature helps admins root cause issues of session failures and poor latency due to high resource consumption on the connector. For more information, see the Connector Statistics article.
Dec 20, 2021
Client Side statistics: Internet Service Provider (ISP)
The name of the ISP serving the endpoints is available on the Sessions self-service view when you expand a session row.
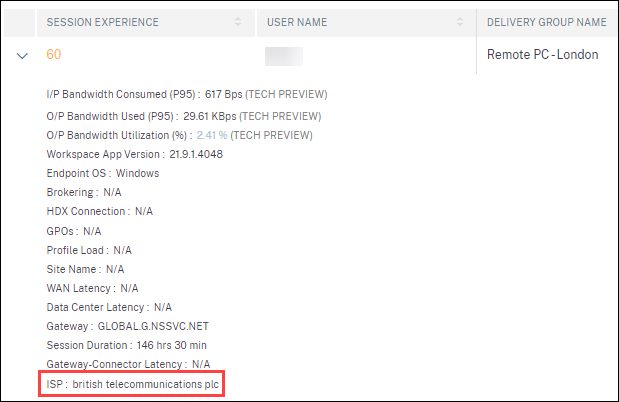
This feature helps you identify session performance issues that might be related to a specific ISP. This information is available with Citrix Workspace app for Windows versions 1912 and later. For more details regarding the availability of this feature with Citrix Workspace app for other OS, see the Workspace app matrix. For more information regarding the metrics available on the Session Self-service view, see the Sessions self-service article.
Dec 17, 2021
Delivery Group-Based Filtering
Citrix Analytics for Performance now has Delivery Group-based filtering in addition to the existing Site and Time period-based filters. Delivery group-based filtering enables you to view performance data belonging to the selected Delivery Groups. This filter helps focus on a specific selected set of Delivery Groups and hence, aids to root cause poor session experience in sessions running on them.
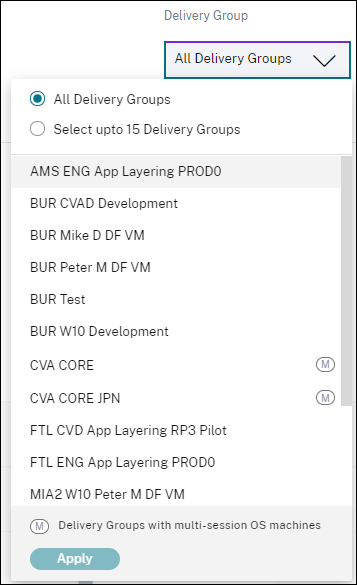
The Delivery Group drop-down list is available on the User Experience Dashboard. Here, the All Delivery Groups option is selected by default. You can also choose the Select up to 15 Delivery Groups option. The Search bar is available to search for specific Delivery Group names from the list.
Once the filter is applied, data relevant to these Delivery Groups is analyzed and displayed on the dashboard. The selection is retained upon drilling down from the dashboard into the factors page and then the self-service views. All views and reports show data belonging to the selected delivery groups.
To make any updates to the Delivery Groups - like, addition, deletion, or rename - available in the drop-down list, refresh the page at least 15 minutes after the change.
For more information about the usage of the User Experience Dashboard, see the User Experience Analytics article.
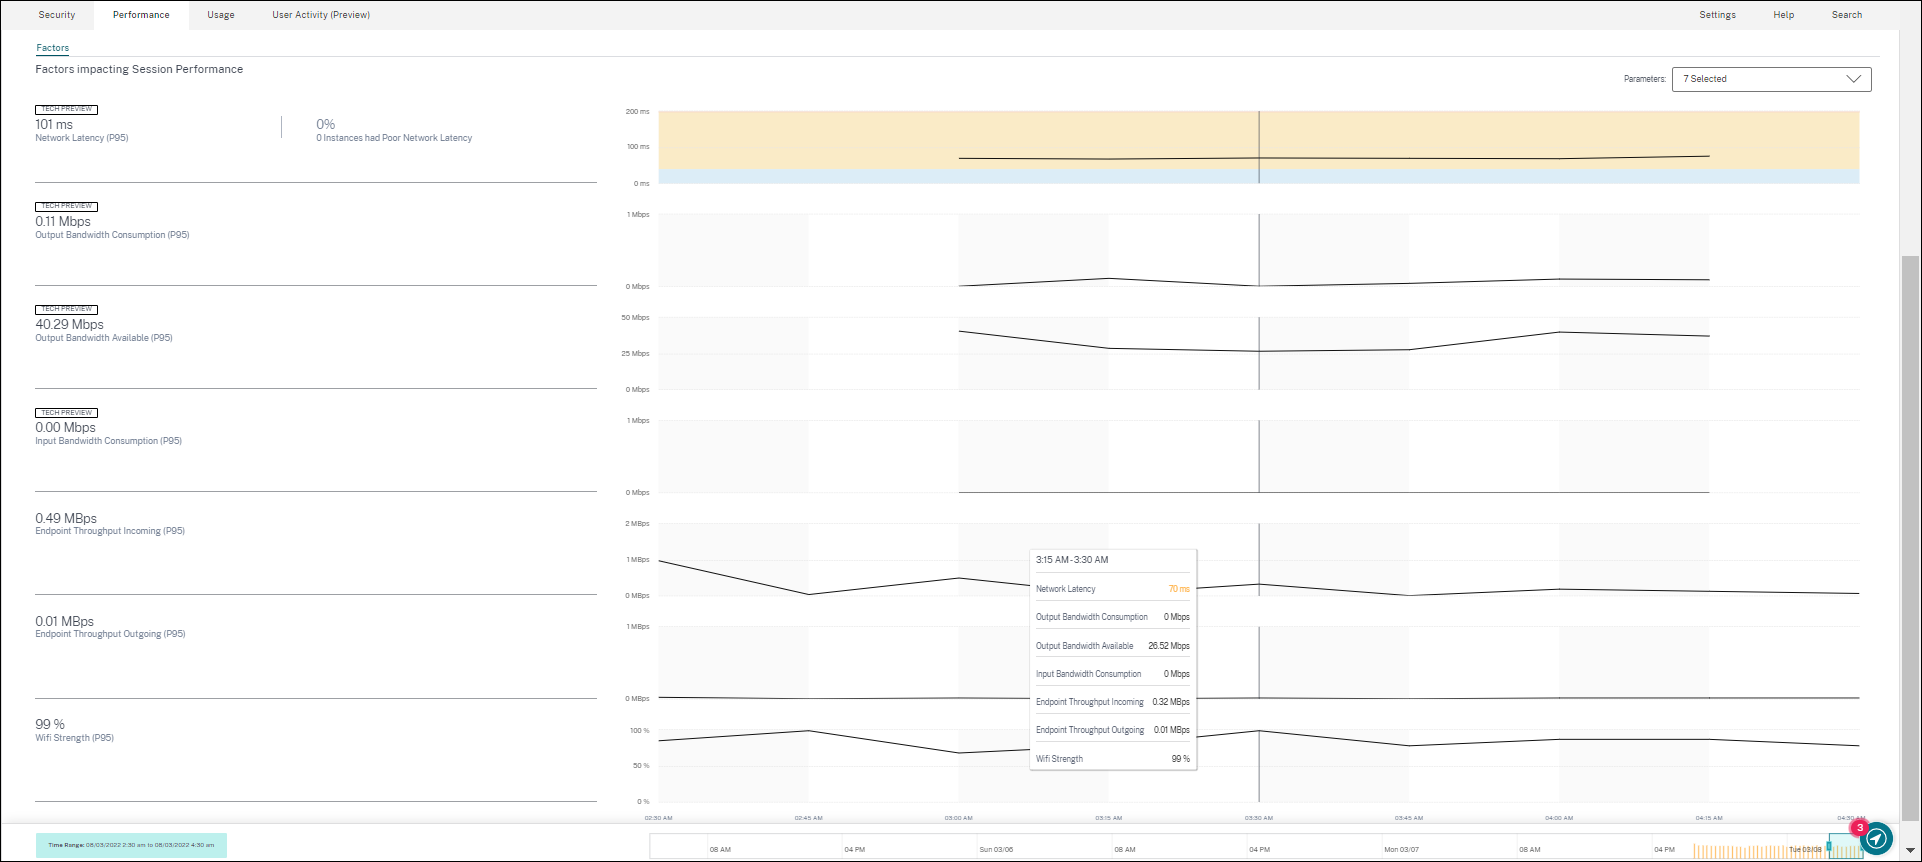
Bandwidth and Network Latency Metrics (Preview)
Granular bandwidth and latency-related metrics that compose Session Responsiveness of your Cloud environment are now available in Citrix Analytics for Performance.
The Factors Timeline pivot is added in the Session Distribution section of the Sessions self-service view under the Session Responsiveness category. This pivot helps analyze sessions based on Poor Output Bandwidth Usage, Poor Network Latency, and Poor ICARTT.
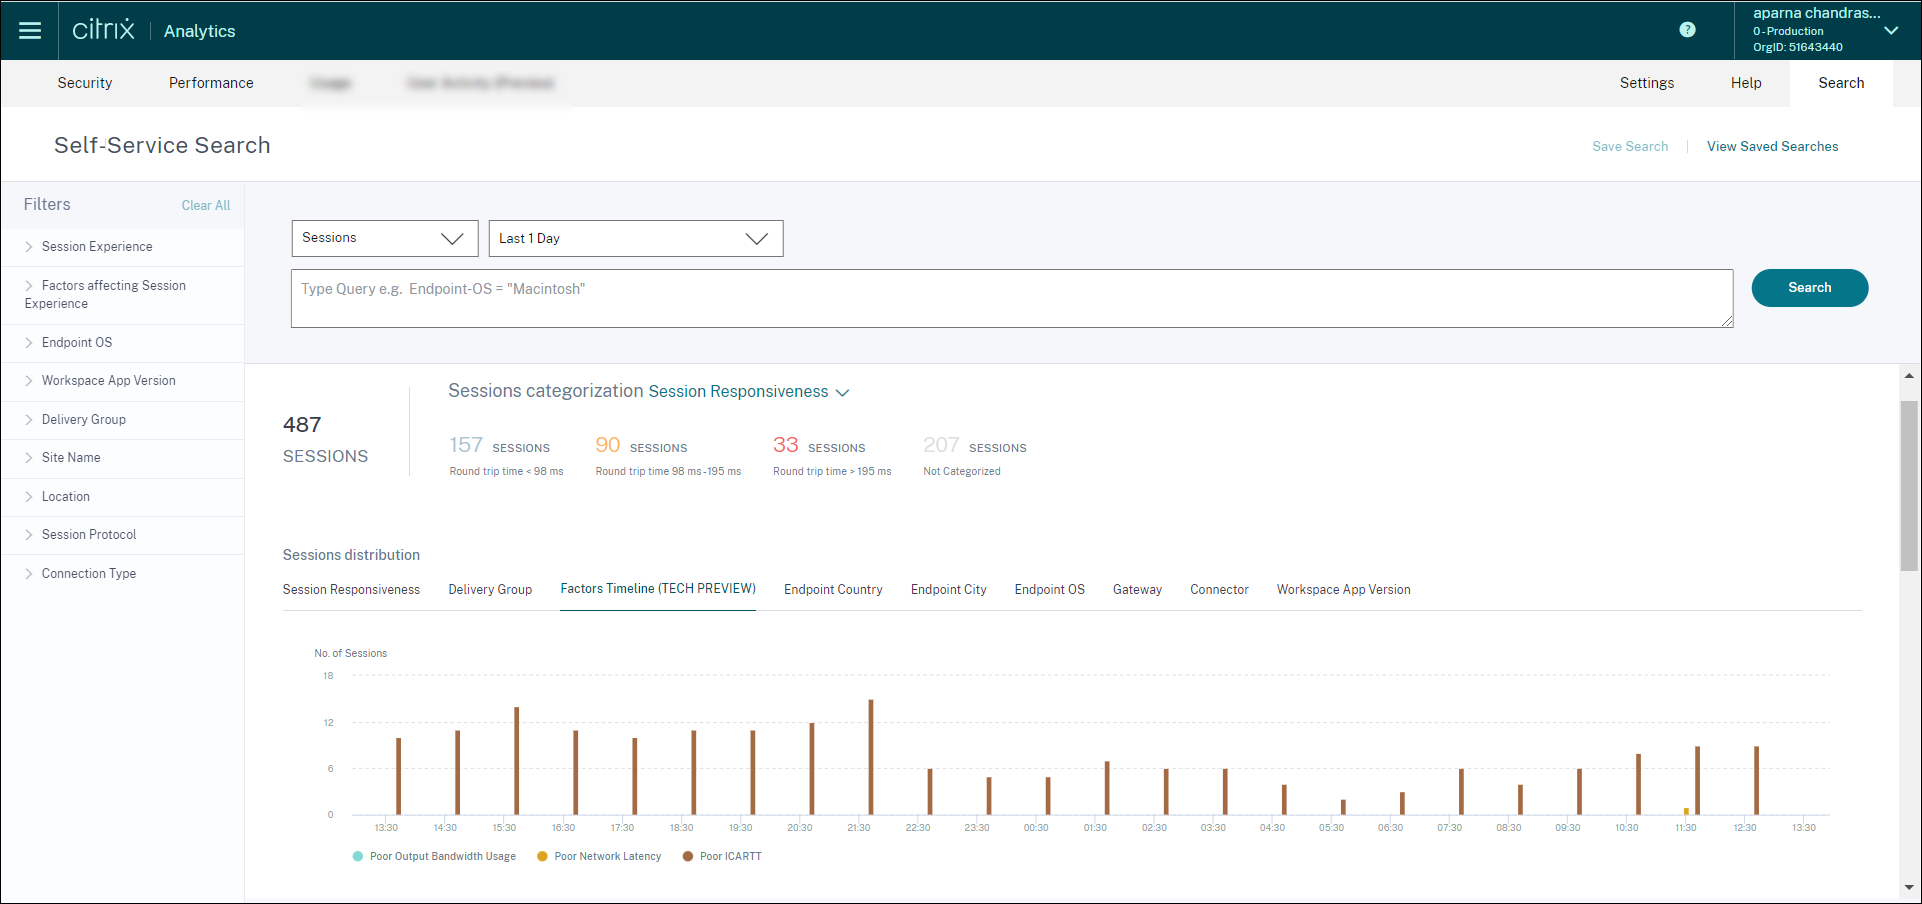
The following bandwidth and network latency metrics are available on the tabular view when you expand the selected session row on the Sessions self-service view.
- P95 values of the bandwidth metrics - Input Bandwidth Consumed, Output Bandwidth Available, Output Bandwidth Used,
- Percentage value of Output Bandwidth Utilization, and
- P95 value of the Network Latency
You need machines running Citrix Virtual Apps and Desktops 7 2112 or later. These metrics are available out-of-the-box for Citrix DaaS and do not require any specific configuration.
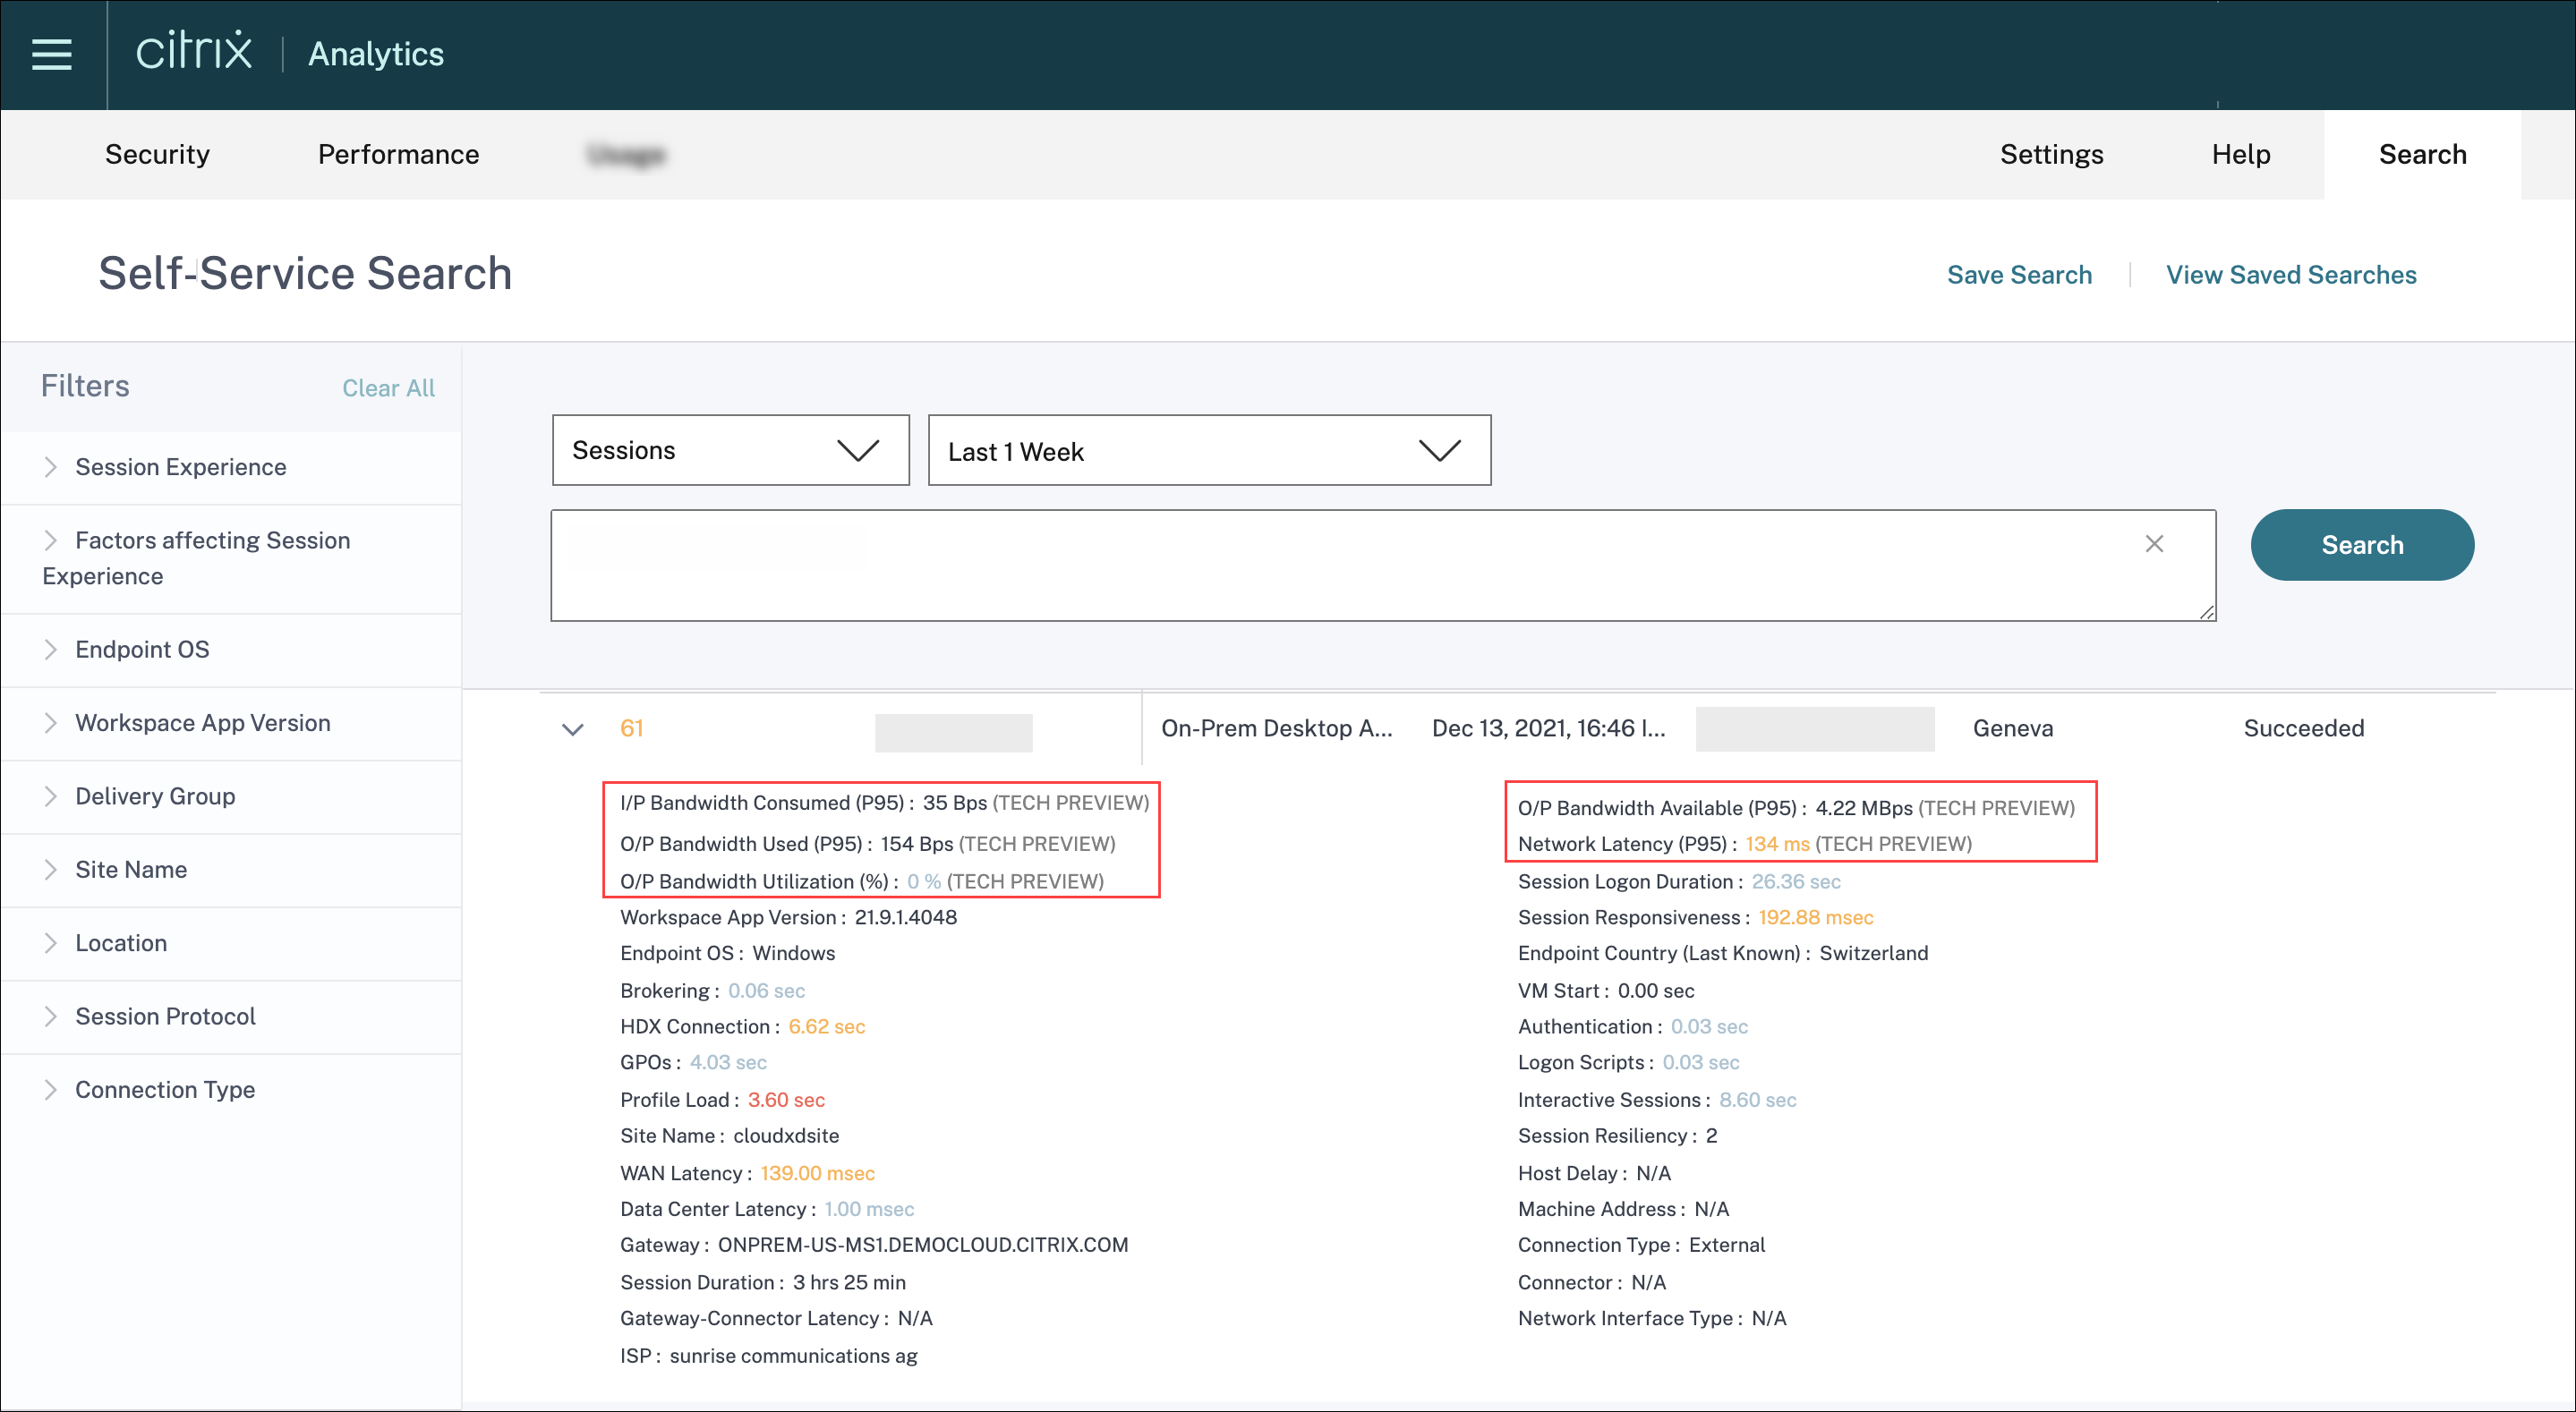
The Output Bandwidth Utilization and Network Latency metrics are color-coded based on whether they belong to the poor, fair, or excellent category.
The bandwidth and network latency metrics help analyze if a particular metric might be causing poor Session Responsiveness. The addition of these metrics helps Citrix Analytics for Performance serve as a single console of information to troubleshoot session performance issues.
For more information about the metrics available on the Sessions Self-service view, see the Sessions self-service article.
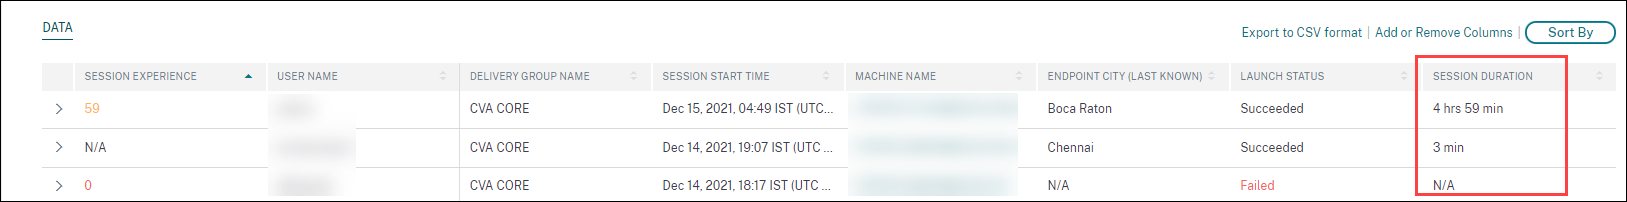
Session Duration in Sessions Self-Service View
Session Duration is now available on the Sessions self-service view. Use Add or Remove Columns to add Session Duration. The addition of this metric helps get a holistic view of the session metrics from the Sessions self-service view.
For more information about the metrics available on the Sessions Self-service view, see the Sessions self-service article.
Session Details
The Session Details page provides a holistic view of the session performance metrics. Comprehensive session details and factors affecting the session performance are displayed for the session duration.
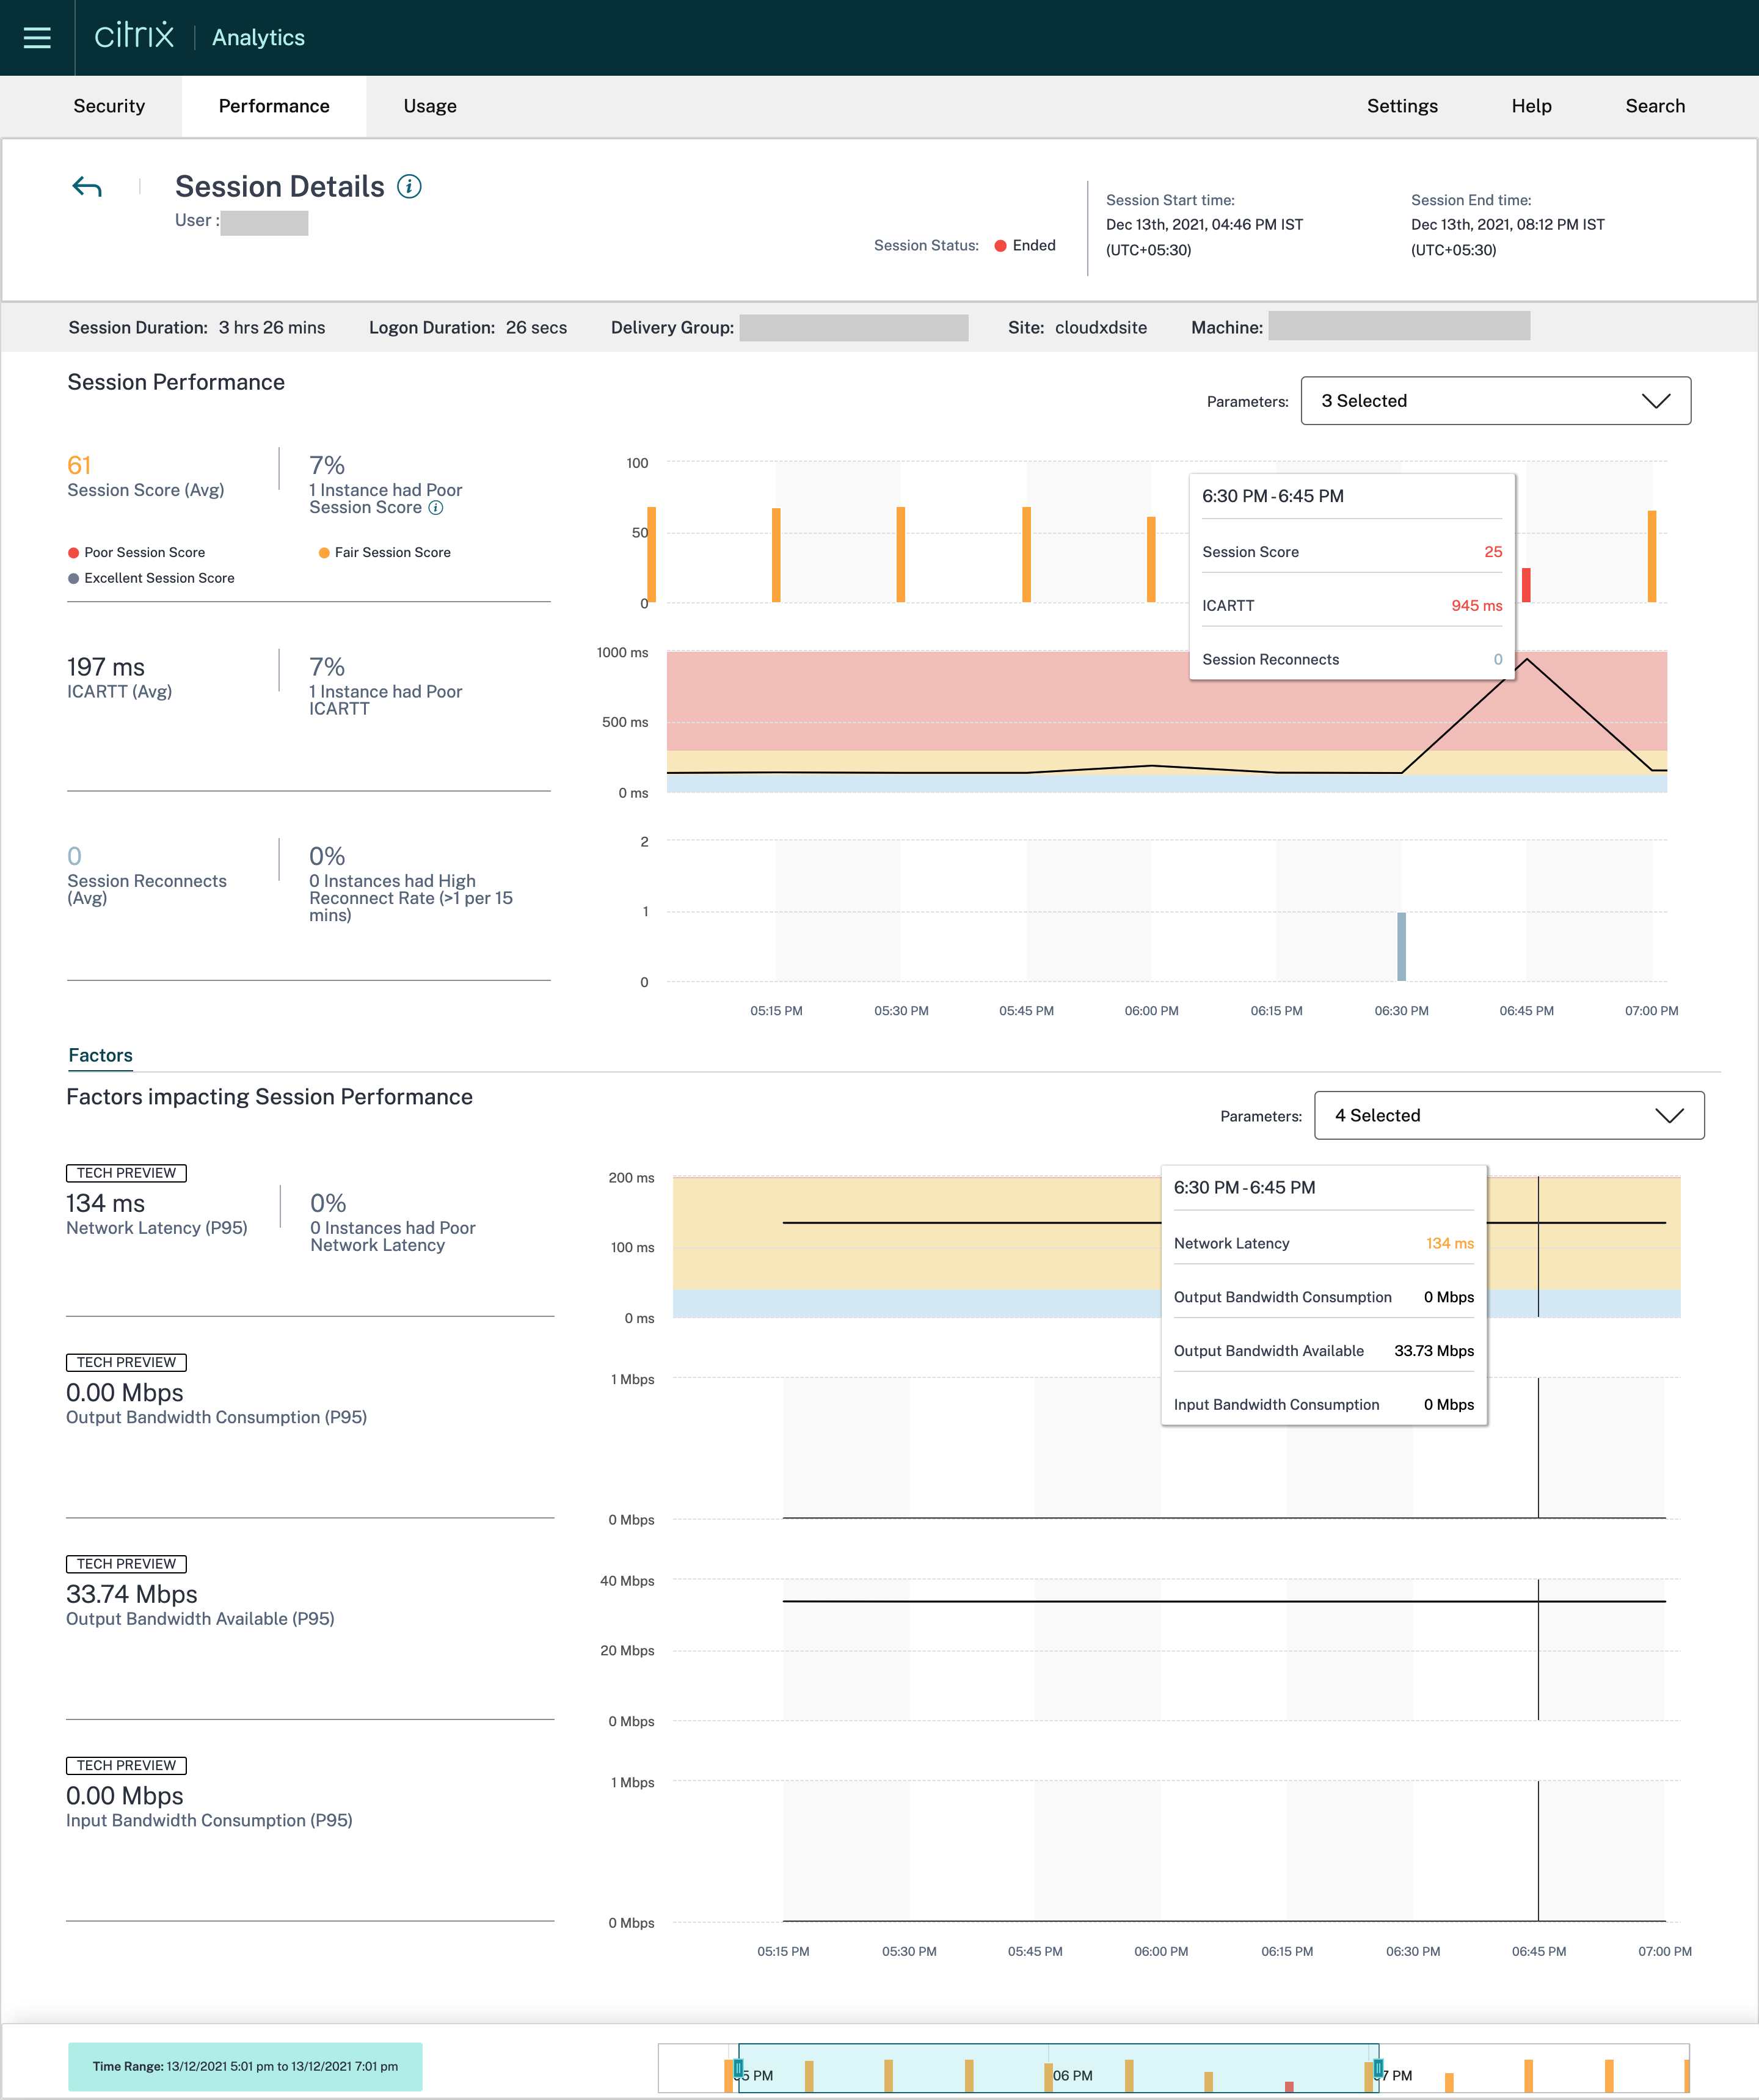
This view gives visibility into session factors like ICARTT, Session Reconnects, bandwidth metrics, and network latency. These factors are plotted along with the Session Score for the selected period. The Session Details view helps correlate the impact of available bandwidth and network latency on ICARTT and Session Score.
You need machines running Citrix Virtual Apps and Desktops 7 2112 or later to view the bandwidth and network latency metrics. For more information on the Session Details page see Session Details.
Dec 6, 2021
Automated onboarding for the Asia Pacific South region
Citrix Analytics for Performance is now onboarded automatically for trial customers and subscription-based customers in the Asia Pacific South (APS) region. The access does not require a request or manual onboarding by customers. For more information on the regions supported in Citrix Cloud, see Geographical considerations.
To access Performance Analytics from the APS region, choose the Asia Pacific South region while onboarding your tenant to Citrix Cloud. Once you log on to Citrix Cloud, select your tenant in the APS region of Citrix Cloud and use the https://analytics-aps.cloud.com URL to access your Citrix Analytics Cloud Service.
-
Citrix Analytics for Performance now stores the user events and metadata of your organization in the Asia Pacific South region when you choose it as your home region. For more information, see Data governance.
-
For information about the network requirements for the Asia Pacific South region, see Technical security overview.
For more information on accessing Performance Analytics see Access.
Nov 18, 2021
Overloaded Machines factor availability
The Overloaded Machines factor section is now available only for the 2 hours, 12 hours and 1 day ranges. The feature is disabled for 1 week and 1 month time periods for optimization. For more information, see Overloaded Machines.
Sep 13, 2021
Support for the Asia Pacific South region
Citrix Analytics for Performance now supports the Asia Pacific South (APS) region. For more information on the regions supported in Citrix Cloud, see Geographical considerations.
To access Performance Analytics from the APS region,
-
Choose the Asia Pacific South region while onboarding your tenant to Citrix Cloud.
-
Fill the Registration for Citrix Analytics for Performance in the APS Plane Podio form for a trial or a paid entitlement to Performance Analytics from your tenant in the APS region. You will be notified by mail upon successful allocation.
-
After you log on to Citrix Cloud, select your tenant in the APS region of Citrix Cloud and use the
https://analytics-aps.cloud.comURL to access your Citrix Analytics Cloud Service.
For more information on accessing Performance Analytics see Access.
Aug 12, 2021
Client Side statistics: Network Interface Type
The Network Interface Type column is added to the tabular data on the Sessions self-service view. This field provides visibility into the client side network and helps root cause if poor session experience is due to issues at the endpoint device or the client side network. The value of this field is N/A for endpoints running Citrix Workspace app Windows version earlier than 2105. For more information, see the Self-service search for Sessions section.
July 29, 2021
Visibility into most resource consuming processes
Citrix Analytics for Performance provides visibility into processes contributing to high resource consumption. This is an important insight for admins to analyze the impact of these processes on user performance. This feature is available for multi-session OS machines in the Machine Statistics page under the Processes tab. You can choose to view the processes ranked as per CPU Utilization or Memory Consumption. The three most resource consuming processes are displayed with percentage CPU or Memory Peak as selected. Charts plot CPU Utilization or Memory Consumption by the process across the selected time period. This feature requires that you enable the Process Monitoring policy from Citrix Studio.
For more information, see Process visibility.
June 10, 2021
Color coding on Session-based self-service view
Tabular data on the Session-based self-service view is color-coded to indicate the excellent, fair, or poor category the metrics belong to. This categorization is based on the individual threshold levels of the metrics. The thresholds are calculated dynamically. For more information, see [How are Dynamic Thresholds calculated?
Similar color coding is applied to the metrics available on expanding the rows in the Session-based self-service view.
Color coding visually aids in focusing on and identifying factors that are contributing to poor performance. It also gives an overview of the performance across various factors for the sessions that have been filtered to be seen in the current view.
Machine Actions and Composite Actions
Citrix Analytics for Performance provides actions you can perform on power managed machines in your Citrix DaaS Sites on Cloud. Admins with Full Administrator access can perform Machine Actions on identified machines. This capability helps simplify the task of admins having to monitor and take a sequence of actions on a machine with performance issues. Machine Actions - start, restart, turn maintenance mode on or off, shut down the machine - are accessible from the Machines Analysis page of the respective machine. Also available are Composite Actions that combine more than one action to help admins bring affected machines back to availability with a single click. This feature avoids admins shifting to other consoles, like the Web Studio or Citrix Director, to perform these actions. The feature is the key to close the loop when it comes to troubleshooting and solving issues related to machine performance.
For more information, see Machine Actions and Composite Actions.
May 12, 2021
Infrastructure Analytics Dashboard - Enhancements
In this release, Citrix Analytics for Performance provides an enhanced Infrastructure Analytics Dashboard to improve visibility into the overall availability of the machines. The new Machine Availability page displays the number of hours machines are available or unavailable across sites and Delivery Groups. Machine Availability displays information about machines that are Available and Unavailable. Available machines are further classified into Ready for use and Active states. Unavailable machines are classified into Unregistered, Failed, and Maintenance states. This information helps determine the availability of provisioned machines to serve sessions.
The Machine Availability trend shows the distribution of machines in various states across the selected time period. Also available is the sessions chart plotting the successful and failed sessions. This helps correlate unavailable machines with failed sessions.
The Machine Performance section provides information about the performance of Multi-session OS machines.
Additionally, you can use the custom time selection filter to zoom into the machine availability and machine performance for a specific duration within the selected time period.
For more information, see Infrastructure Analytics.
Apr 23, 2021
Failure Insights - Communication Error
In this release, Citrix Analytics for Performance provides insights into Communication Error as a part of Failure Insights.
The Communication Error sub-pane lists the number of session failures due to communication errors between the endpoint (where the user launches the session) and the machine. These errors can occur due to incorrect firewall configurations or other errors on the network path.
The two categories of communication errors are:
- Endpoint to machine — lists the sessions where communication errors have occurred between the endpoint and the machine.
- Gateway to machine — lists the sessions where communication errors have occurred between the gateway and the machine.
Additionally, the Communication Error sub-pane displays the following recommendations to resolve the errors.
- Check the firewall settings on the machine and gateway
- Check network connectivity between the machine and gateway
This feature is supported only on Citrix Workspace app 2103 and later.
For more information, see Communication Error.
Feb 2, 2021
Visual Summary io Sessions self-service view
Visual Summary of data is available on the Sessions self-service view. Visual Summary presents the raw data in the self-service tables as charts aimed at an improved visibility into the user experience.
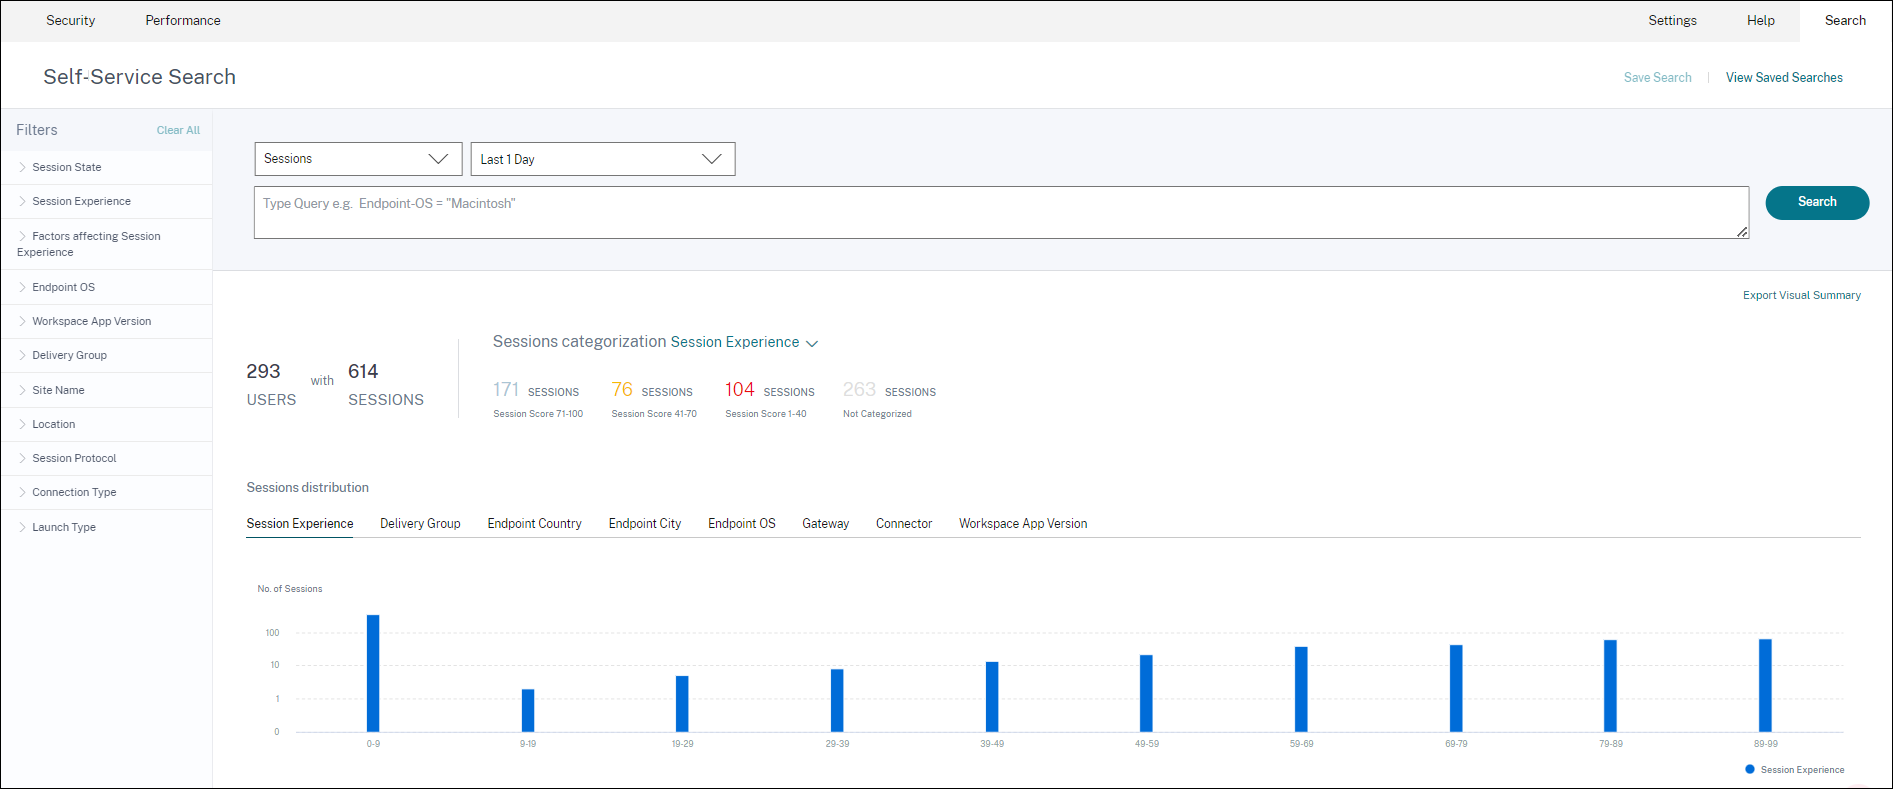
The Visual Summary chart displays session categorization based on the chosen criteria. In addition, you can choose to view the session distribution pivoted on a specific parameter. This view helps identify session performance issues related to the pivots.
Use the visualization to identify patterns in data that can help troubleshoot specific issues.
For more information, see the Self-service search for Sessions section in the Self-service article.
Jan 28, 2021
Overloaded Machines factor
Overloaded resources can cause high latency, high logon duration, and failures resulting in poor user experience. The Overloaded Machines factor, added on the User Experience (UX) factors page, gives visibility into the overloaded resources causing poor experience.
Machines that have experienced sustained CPU spikes, or high memory usage, or both, that have lasted for 5 minutes or more, resulting in a poor user experience in the selected duration are considered to be overloaded.
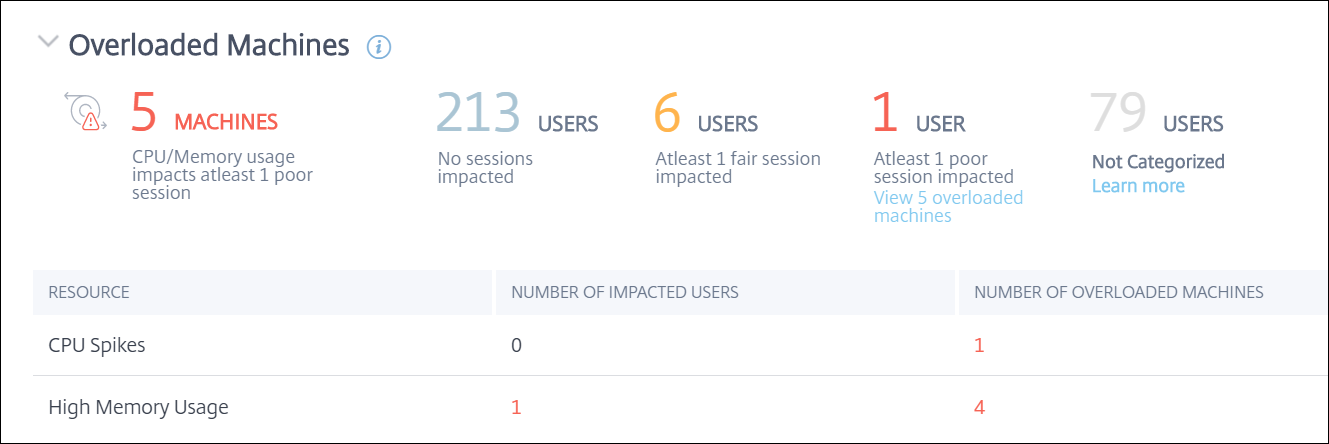
The Overloaded Machines section shows:
- The number of machines in which CPU or memory usage has impacted at least one poor session.
- The number of users affected due to the impact of overloaded CPU or memory on the session experience.
- Breakup of:
- the number of machines affecting users with poor experience due to overloaded resources.
- the number of users with poor experience impacted by CPU Spikes and High memory usage.
For more information, see the Overloaded Machines section in the User Experience Factors drilldown article.
- Clicking the number of overloaded users leads to the Users self-service view filtered to show users whose sessions are affected by the overloaded resources.
- Clicking the number of overloaded machines leads to the Machines self-service view filtered to show the chosen set of overloaded machines - based on classification, or based on the overloaded resource, CPU, or machine.
The Machines self-service view is enhanced with the Overloaded Machines and Overloaded CPU/Memory facets to help filter machines with overloaded resources. For more information, see Overloaded Machines in the Self-Service Search for Performance article.
This video shows a typical troubleshooting scenario using the Overloaded Machines factor.
Dec 16, 2020
User Experience Dashboard: Session count enhancements
A session breakup panel based on protocol is added to the User Experience dashboard. The breakup brings clarity into the total number of sessions launched on the Site versus the number of sessions analyzed in Performance Analytics.
The panel displays the following for the selected duration:
- the total number of unique users in the selected Sites,
- the total number sessions that have been active,
- individual HDX, Console, and RDP sessions.
Analytics relevant only to HDX sessions are available on the dashboard. For more information about the various sections on the dashboard, see the User Analytics article.
Performance metrics of all the sessions independent of protocol are available on the Users, and Sessions based self-service views. Use the Protocol facet to filter the results based on the session protocol.
For more information, see the Self-Service Search for Performance article.
User Experience Dashboard: Session classification clarity
Not Categorized users and sessions are displayed as a separate session category on the User Experience dashboard. This category in the User Experience Score, Session Responsiveness, and Session Logon Duration sections helps identify users and sessions that cannot be classified as experiencing excellent, fair, or poor performance. A session might not get classified if it is launched from a machine running an older Workspace app version, or if the session fails during the logon. For more information on specific reasons for Not Categorized sessions in individual sections on the dashboard, see,
- Users Not Categorized
- Sessions Not Categorized for Responsiveness
- Sessions Not Categorized for Logon Duration
Connection information
Connection failures are generally an important cause for performance degradation. Connection-related parameters are now available on the Self-service view for Sessions to help identify and troubleshoot connection failures easily. The Self-Service view for Sessions includes Connection Type facet and column. Connection Type has values:
- internal – if the connection is direct without Gateway
- external – if the connection is through a Gateway
In addition, Gateway FQDN (for external connections) and Machine Address (for internal connections) are available as columns on the Self-service view for Sessions.
The Connection details are available for Endpoints running Citrix Workspace app version 20.12.0 or later for Windows. For all other endpoints, the Connection type is displayed as N/A.
For more information, see the Self-service search for Sessions article.
Endpoint Information enhancements
Endpoint parameters are added to the columns on the Users and Sessions based self-service views, in addition to the existing endpoint facets. This feature helps search users and sessions based on the endpoint parameters like the location, OS, and the Workspace app version. The parameters are also available in exported CSV files. In addition, the location algorithm has been enhanced to return the last known location in cases where the latest location of the endpoint is not resolved.
- The Users and Sessions self-service view contains the location parameters Endpoint Country (last known), and Endpoint City (last known).
- The Sessions self-service view contains the location parameters Endpoint Country (last known), and Endpoint City (last known), Workspace app version, and Endpoint OS.
The addition of these columns helps define queries using the endpoint parameters. You can easily identify issues with performance that are endpoint specific like the location, Workspace app version, or OS.
For more information, see the Self-Service Search for Performance article.
Dec 15, 2020
Drilldown into Profile Load Insights
Profile load insights are updated with a drilldown to help identify users who have a poor logon experience due to large profile sizes.
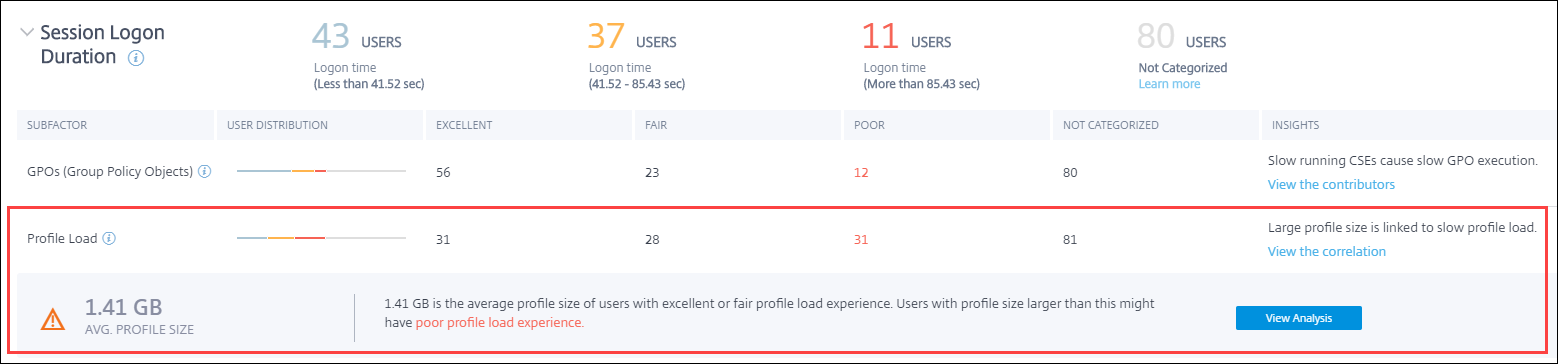
The View the correlation link displays the average profile size of users, calculated using profile sizes of users who have had excellent and fair profile load experience. Users having profile sizes larger than the average are likely to have poor profile load times.
The View analysis link displays users whose profile size is larger than the average on the users based self-service view. Use facets to further filter this data to view users with both large profile size and poor logon duration experience.
The self-service views for both users and sessions include the Profile Load and the Average Profile Size fields. These fields help filter and identify users with large profile load times easily.
For more information, see the Profile load insights section in the User Experience (UX) Factors article.
Dec 11, 2020
Identification of user terminated sessions
Session failures are an important factor affecting user experience in most environments. Hence, its accuracy plays an important role in correctly measuring the overall user experience in the environment.
Identification of user-terminated sessions is a step forward in this direction. It identifies sessions voluntarily terminated by users separately from failed sessions. The Launch Status field on the Sessions self-service view shows a User Terminated status, apart from the existing Succeeded, and Failed statuses. Addition of the separate User Terminated status increases the accuracy of the session failure count.
This feature is supported with endpoints running:
- Citrix Workspace app 20.9.0 or later for Android
- Citrix Workspace app 20.8.0 or later for iOS
- Citrix Workspace app 20.8.0 or later for Windows
This feature does not support endpoints running Workspace on the web.
For more information, see Self-Service search for Sessions.
Oct 19, 2020
Machines based self-service search
A Machines based self-service search is now added to the existing Users and Sessions based self-service views in Citrix Analytics for Performance.
The machines based self-service view displays key performance indicators of your virtual machines. The metrics include the machine downtime, the latest consecutive failures, performance indicators of the machine resources (CPU and memory) - the peak usage, and the number of peaks for the selected time period. Overloaded resources can cause session failures, high latency, or high logon duration resulting in poor user experience. This view helps easily troubleshoot the performance issues related to machine resource utilization.
You can access the Machines based self-service view from the Search menu in your Citrix Analytics service. In the list of services on the Search tab, under the Performance section, select Machines. The Machines based self-service view is also available when you drill down from black hole machines. To access the view, on the User experience dashboard, in the Failure Insights section, click the Black hole machines number.
For more information on the Machines based self-service view, see Self-service search for Machines.
Machine Statistics view
Citrix Analytics for Performance provides a Machine Statistics view. This view displays a correlation between the resource load and the session experience on the selected machine for the selected time period. This information helps you understand if high CPU or memory usage is related to session failures. You can then explain a poor experience in your Apps and Desktops environment.
To access the Machine statistics page, on the Machines self-service view, click the machine name link.
Key data points available on this page are:
- Relevant machine attributes, such as the OS, Site, Delivery Group, and downtime of the machine during the last 24 hours.
- Machine performance statistics related to resource usage, such as CPU and memory peaks, and the number of spikes over the last 24 hours. Also displayed is a trend of the CPU and memory consumption.
- Session performance statistics, such as the number of session failures, and peak concurrent session count over the last 24 hours. Also displayed are trends of session failures and session classification.
You can choose to view machine statistics for any 24-hour duration from the last 14 days. The charts are displayed for a default 4-hour time period. A time navigator helps change this time period and also zoom into any duration within the chosen 24-hour time period.
The machine and session performance statistics displayed on the same view help analyze machine resources, their usage pattern and understand if the machine resources have been a possible bottleneck for poor performance.
For more information about this feature, see the Machine Statistics article.
Failure Insights - Black hole machines
Failure Insights in Citrix Analytics for Performance provides insights into session failures that occurred during the chosen time period. This feature is important in helping troubleshoot and resolve session failures faster. It eases the task of admins who need to troubleshoot session failures to improve session availability and hence, the user experience. In this release, Citrix Analytics for Performance provides insights into Black hole machines as a part of Failure Insights.
Some machines in your environment, though registered and appearing healthy might not service sessions brokered to the them, resulting in failures. Machines that have failed to service four or more consecutive session requests are termed as Black hole machines. The reasons for these failures are related to various factors that might affect the machine, such as, insufficient RDS licenses, intermittent networking issues, or instantaneous load on the machine.
The Black hole machines section of Failure Insights shows the number of black hole machines identified in your environment during the selected time period. The presence of black hole machines in the environment impacts session availability. Suggestions to reduce the number of black hole machines in your environment are provided. Clicking the number of black hole machines opens the Machines based self-service view that is filtered to show the black hole machines in your environment during the selected time period. For more information, see Black hole machines.
July 21, 2020
GPO Insights
GPO Insights displays client-side extensions (CSEs) taking the longest processing time during the selected time period. GPO Insights are available in the Session Logon Duration subfactor table. Click the Possible Reasons link in the GPOs row, Insights column.
GPO Insights are based on the analysis of user sessions having high GPO execution times. Increased GPO execution times are due to CSEs with long processing time. Optimizing CSE processing improves the overall session logon experience of the user. Average CSE execution time depends on the number and type of policies applied with it. Review and tune policies associated with CSEs taking the longest processing time as indicated in the GPO insights. Further, consider deleting the ones that are not required. For more pointers to improve the processing time of CSEs, see GPOs.
June 16, 2020
Improved User Experience Score algorithm
The User Experience score calculation algorithm has been improved. The method for quantifying the experience based on the factors - Session Availability, Session Logon Duration, Session Responsiveness, and Session Resiliency has been optimized. Now, more emphasis is laid on the in-session experience factors.
This update results in a more appropriate classification of users having an excellent, a fair, or a poor experience. You might notice more users being classified as having a fair or a poor experience now. The improved score algorithm enables you to correctly identify poor sessions and resolve issues to improve the user experience. Starting June 2020, the new user classification data appears on your User Experience trend. This change does not affect any classification done earlier.
For more information on the User Experience Score calculation, see the User Experience article.
April 23, 2020
Location and Endpoint based Self-Service Search
Now, you can search events based on the Endpoint Country or City on the self-service view for User and Session performance data. The self-service view for Session performance data also has filters based on the Session Endpoint OS and Endpoint Version.
This information helps analyze if performance issues are localized to a specific geography, endpoint OS, or version. These filters are available for the Citrix Workspace app for Windows version 1912 and later.
For more information about the usage of these filters in self-service search, see Self-Service Search for Performance.
January 10, 2020
Citrix Analytics for Performance - Generally Available
The Citrix Analytics for Performance is a new subscription-based offering from Citrix Analytics. It allows you to track, aggregate, and visualize key performance indicators of your Apps and Desktops environment. You can use it to analyze performance issues of Apps and Desktops Sites both on-premises and on Cloud. For more information, see Performance Analytics.
In this article
- Dec 28, 2023
- Dec 19, 2023
- Dec 12, 2023
- Nov 15, 2023
- Oct 26, 2023
- Sep 25, 2023
- Sep 14, 2023
- Sep 05, 2023
- Aug 31, 2023
- Aug 18, 2023
- Aug 01, 2023
- Jun 06, 2023
- Jun 05, 2023
- May 22, 2023
- May 16, 2023
- Apr 28, 2023
- Apr 13, 2023
- Apr 04, 2023
- Feb 20, 2023
- Feb 01, 2023
- Jan 23, 2023
- Jan 02, 2023
- Dec 14, 2022
- Nov 18, 2022
- Oct 13, 2022
- Oct 11, 2022
- Sep 30, 2022
- Sep 28, 2022
- Sep 07, 2022
- Aug 05, 2022
- July 29, 2022
- July 18, 2022
- Jun 08, 2022
- Apr 28, 2022
- Apr 20, 2022
- Apr 14, 2022
- Apr 14, 2022
- Apr 14, 2022
- Mar 08, 2022
- Mar 07, 2022
- Feb 21, 2022
- Dec 20, 2021
- Dec 17, 2021
- Dec 6, 2021
- Nov 18, 2021
- Sep 13, 2021
- Aug 12, 2021
- July 29, 2021
- June 10, 2021
- May 12, 2021
- Apr 23, 2021
- Feb 2, 2021
- Jan 28, 2021
- Dec 16, 2020
- Dec 15, 2020
- Dec 11, 2020
- Oct 19, 2020
- July 21, 2020
- June 16, 2020
- April 23, 2020
- January 10, 2020