Monitor deployments
Monitor Sites
With full administrator permission, when you open Director, the Dashboard provides a centralized location to monitor the health and usage of a Site.
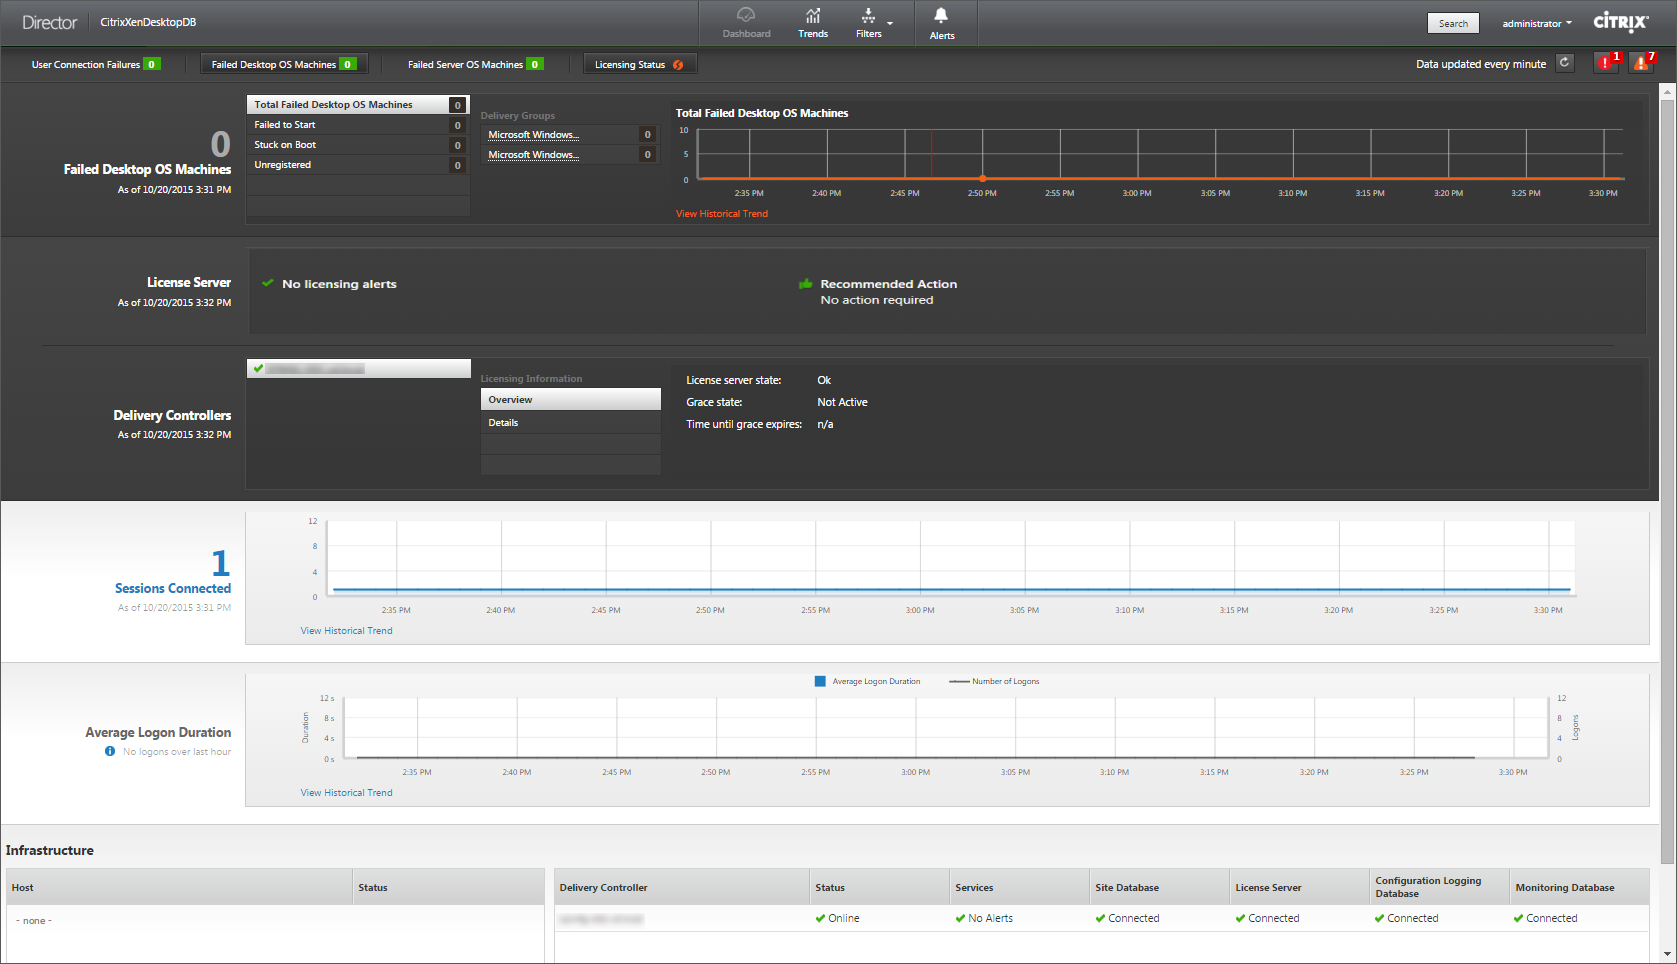
If there are currently no failures and no failures have occurred in the past 60 minutes, panels stay collapsed. When there are failures, the specific failure panel automatically appears.
Note: Depending on your organization’s license and your Administrator privileges, some options or features might not be available.
| Panel | Description |
|---|---|
| User Connection Failures | Connection failures over the last 60 minutes. Click the categories next to the total number to view metrics for that type of failure. In the adjacent table, that number is broken out by Delivery Groups. Connection failures includes failures caused by application limits being reached. For more information on application limits, see Applications. |
| Failed Desktop OS Machines or Failed Server OS Machines | Total failures in the last 60 minutes broken out by Delivery Groups. Failures broken out by types, including failed to start, stuck on boot, and unregistered. For Server OS machines, failures also include machines reaching maximum load. |
| Licensing Status | License Server alerts display alerts sent by the License Server and the actions required to resolve the alerts. Requires License Server Version 11.12.1 or later. Delivery Controller alerts display the details of the licensing state as seen by the Controller and are sent by the Controller. Requires Controller for XenApp 7.6 or XenDesktop 7.6 or later. You can set the threshold for alerts in Studio. |
| Sessions Connected | Connected sessions across all Delivery Groups for the last 60 minutes. |
| Average Logon Duration | Logon data for the last 60 minutes. The large number on the left is the average logon duration across the hour. Logon data for VDAs earlier than XenDesktop 7.0 is not included in this average. For more information, see Diagnose user logon issues. |
| Infrastructure | Lists your Site’s infrastructure - hosts and Controllers. For infrastructure from XenServer or VMware, you can view performance alerts. For example, you can configure XenCenter to generate performance alerts when CPU, network I/O, or disk I/O usage go over a specified threshold on a managed server or virtual machine. By default, the alert repeat interval is 60 minutes, but you can configure this as well. For details, go to XenServer Current Release; see the XenCenter Performance Alerts section in the Citrix XenServer Administrator’s Guide. |
Note: If no icon appears for a particular metric, this indicates that this metric is not supported by the type of host you are using. For example, no health information is available for System Center Virtual Machine Manager (SCVMM) hosts, AWS and CloudStack.
Continue to troubleshoot issues using these options (which are documented below):
Monitor sessions
If a session becomes disconnected, it is still active and its applications continue to run, but the user device is no longer communicating with the server.
| Action | Description |
|---|---|
| View a user’s currently connected machine or session | From the Activity Manager and User Details views, view the user’s currently connected machine or session and a list of all machines and sessions to which this user has access. To access this list, click the session switcher icon in the user title bar. For more information, see Restore sessions. |
| View the total number of connected sessions across all Delivery Groups | From the Dashboard, in the Sessions Connected pane, view the total number of connected sessions across all Delivery Groups for the last 60 minutes. Then click the large total number, which opens the Filters view, where you can display graphical session data based on selected Delivery Groups and ranges and usage across Delivery Groups. |
| End idle sessions | The Sessions Filters view displays data related to all active sessions. Filter the sessions based on Associated User, Delivery Group, Session State, and Idle Time greater than a threshold time period. From the filtered list, select sessions to log off or disconnect. For more information, see Troubleshoot applications. |
| View data over a longer period of time | On the Trends view, select the Sessions tab to drill down to more specific usage data for connected and disconnected sessions over a longer period of time (that is, session totals from earlier than the last 60 minutes). To view this information, click View historical trends |
Note: If the user device is running a legacy Virtual Delivery Agent (VDA), such as a VDA earlier than version 7, or a Linux VDA, Director cannot display complete information about the session. Instead, it displays a message that the information is not available.
View the transport protocol in use for the HDX connection type for the current session in the Session Details panel. This information is available for sessions launched on VDAs Version 7.13 or later.
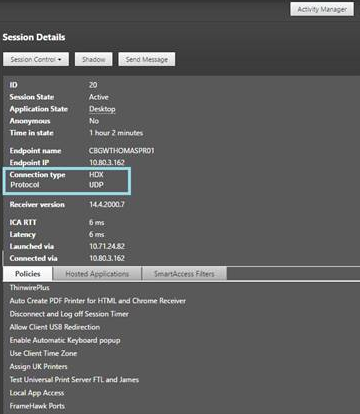
- For HDX™ Connection type,
- The Protocol is displayed as UDP, if EDT is used for the HDX connection.
- The Protocol is displayed as TCP, if TCP is used for the HDX connection.
- For RDP Connection type, the Protocol is displayed as n/a.
When adaptive transport is configured, the session transport protocol dynamically switches between EDT (over UDP) and TCP, based on the network conditions. If the HDX session cannot be established using EDT, it falls back to the TCP protocol.
For more information about adaptive transport configuration, see Adaptive Transport.
Filter data to troubleshoot failures
When you click numbers on the Dashboard or select a predefined filter from the Filters menu, the Filters view opens to display the data based on the selected machine or failure type.
Predefined filters cannot be edited, but you can save a predefined filter as a custom filter and then modify it. Additionally, you can create custom filtered views of machines, connections, sessions, and application instances across all Delivery Groups.
- Select a view:
- Machines. Select Desktop OS Machines or Server OS Machines. These views show the number of configured machines. The Server OS Machines tab also includes the load evaluator index, which indicates the distribution of performance counters and tool tips of the session count if you hover over the link.
- Sessions. You can also see the session count from the Sessions view. Use the idle time measurements to identify sessions that are idle beyond a threshold time period.
- Connections. Filter connections by different time periods, including last 60 minutes, last 24 hours, or last 7 days.
- Application Instances. This view displays the properties of all application instances on VDAs of Server and Desktop OS. The session idle time measurements are available for Application instances on VDAs of Server OS.
- For Filter by, select the criteria.
- Use the additional tabs for each view, as needed, to complete the filter.
- Select additional columns, as needed, to troubleshoot further.
- Save and name your filter.
- To access filters from multiple Director servers, store the filters on a shared folder accessible from those servers:
- The shared folder must have modify permissions for accounts on the Director server.
- The Director servers must be configured to access the shared folder. To do this, run IIS Manager. In Sites > Default Web Site > Director> Application Settings, modify the Service.UserSettingsPath setting to reflect the UNC path of the shared folder.
- To open the filter later, from the Filters menu, select the filter type (Machines, Sessions, Connections, or Application Instances), and then select the saved filter.
- If needed, for Machines or Connections views, use power controls for all the machines you select in the filtered list. For the Sessions view, use the session controls or option to send messages.
- In the Machines and Connections views, click the Failure Reason of a failed machine or connection to get a detailed description of the failure and actions recommended to troubleshoot the failure. The failure reasons and the recommended actions for Machine and Connection failures are available in the Citrix Director 7.12 Failure Reasons Troubleshooting Guide.
- In the Machines view, click on a machine name link to go to the corresponding Machine Details page. This page displays the details of the machine, provides power controls, displays the CPU, memory, disk monitoring, and GPU monitoring graphs. Also, click View Historical Utilization to see the resource utilization trends for the machine. For more information, see Troubleshoot machines.
- In the Application Instances view, sort or filter based on Idle Time greater than a threshold time period. Select the idle application instances to end. Log off or Disconnect of an application instance ends all active application instances in the same session. For more information, see Troubleshoot applications.
Note: The Application Instances filter page and idle time measurements in the Sessions filter pages are available if Director, Delivery Controller(s), and VDAs are version 7.13 or later.
Monitor historical trends across a Site
The Trends view accesses historical trend information for sessions, connection failures, machine failures, logon performance, load evaluation, capacity management, machine usage, resource utilization, and network analysis for each Site. To locate this information, click the Trends menu.
The zoom-in drill down feature lets you navigate through trend charts by zooming in on a time period (clicking on a data point in the graph) and drilling down to see the details associated with the trend. This feature enables you to better understand the details of who or what has been affected by the trends being displayed.
To change the default scope of each graph, apply a different filter to the data.
Choose a time period for which you require the historical trend information; time period availability depends on your Director deployment as follows:
- Trend reports of up to Last year (365 days) are available in Platinum licensed Sites.
- Trend reports of up to Last month (31 days) are available in Enterprise licensed Sites.
- Trend reports of up to Last 7 days in non-Platinum and non-Enterprise licensed Sites.
Note:
- In all Director deployments, sessions, failures, and logon performance trend information are available as graphs and tables when the time period is set to Last month(Ending now) or shorter. When the time period is chosen as Last month with a custom ending date or as Last year, the trend information is available as graphs but not as tables.
- The default values of the trends data grooming retention by the Monitoring Service are available in the Data granularity and retention. Customers on Platinum licensed Sites can change the grooming retention to their desired number of retention days.
Available trends
View trends for sessions: From the Sessions tab, select the Delivery Group and time period to view more detailed information about the concurrent session count.
View trends for connection failures: From the Failures tab, select the connection, machine type, failure type, Delivery Group, and time period to view a graph containing more detailed information about the user connection failures across your Site.
View trends for machine failures: From the Desktop OS Machine Failures tab or Server OS Machines tab, select the failure type, Delivery Group, and time period to view a graph containing more detailed information about the machine failures across your Site.
View trends for logon performance: From the Logon Performance tab, select the Delivery Group and time period to view a graph containing more detailed information about the duration of user logon times across your Site and whether the number of logons affects the performance. This view also shows the average duration of the logon phases, such as brokering duration and VM start time. This data is specifically for user logons and does not include users trying to reconnect from disconnected sessions. The table below the graph shows Logon Duration by User Session. You can choose the columns to display and sort the report by any of the columns. For more information, see Diagnose user logon issues
View trends for load evaluation: From the Load Evaluator Index tab, view a graph containing more detailed information about the load that is distributed among Server OS machines. The filter options for this graph include the Delivery Group or Server OS machine in a Delivery Group, Server OS machine (available only if Server OS machine in a Delivery Group was selected), and range.
View hosted applications usage: The availability of this feature depends on your organization’s license. From the Capacity Management tab, select the Hosted Applications Usage tab, select the Delivery Group and time period to view a graph displaying peak concurrent usage and a table displaying application based usage. From the Application Based Usage table, you can choose a specific application to see details and a list of users who are using, or have used, the application.
View desktop and server OS usage: The Trends view shows the usage of Desktop OS by Site and by Delivery Group. When you select Site, usage is shown per Delivery Group. When you select Delivery Group, usage is shown per User. The Trends view also shows the usage of Server OS by Site, by Delivery Group, and by Machine. When you select Site, usage is shown per Delivery Group. When you select Delivery Group, usage is shown per Machine and per User. When Machine is selected usage is shown per User.
View virtual machine usage: From the Machine Usage tab, select Desktop OS Machines or Server OS Machines to obtain a real-time view of your VM usage, enabling you to quickly assess your Site’s capacity needs. Desktop OS availability - displays the current state of Desktop OS machines (VDIs) by availability for the entire Site or a specific Delivery Group. Server OS availability - displays the current state of Server OS machines by availability for the entire Site or a specific Delivery Group.
View resource utilization: From the Resource Utilization tab, select Desktop OS Machines or Server OS Machines to obtain insight into historical trends data for CPU and memory usage, and IOPS and disk latency for each VDI machine for better capacity planning. This feature requires Delivery Controller(s) and VDAs version 7.11 or later. Graphs show data for average CPU, average memory, average IOPS, disk latency, and peak concurrent sessions. You can drill down to the machine, and view data and charts for the top 10 processes consuming CPU. Filter by Delivery Group and Time period. CPU, memory usage, and peak concurrent sessions graphs are available for the last 2 hours, 24 hours, 7 days, month, and year. The average IOPS and disk latency graphs are available for the last 24 hours, month, and year.
Notes:
-
The Monitoring policy setting, Enable Process Monitoring, must be set to “Allowed” to collect and display data in the Top 10 Processes table on the Historic Machine Utilization page. The policy is set to “Prohibited” by default. All resource utilization data is collected by default. This can be disabled using the Enable Resource Monitoring policy setting. The table below the graphs shows the resource utilization data per machine.
-
Average IOPS shows the daily averages. Peak IOPS is calculated as the highest of the IOPS averages for the selected time range. (An IOPS average is the hourly average of IOPS collected during the hour on the VDA).
View network analysis data: The availability of this feature depends on your organization’s license and your administrator permissions. This feature requires Delivery Controller(s) version 7.11 or later.
From the Network tab, monitor your network analysis, which provides a user, application, and desktop contextual view of the network. With this feature, Director provides advanced analytics of ICA traffic in your deployment through HDX Insight reports from NetScaler Insight Center or NetScaler MAS. For more information, see Configure network analysis
View application failures: The Application Failures tab displays failures associated with the published applications on the VDAs.
This feature requires Delivery Controller(s) and VDAs version 7.15 or later. Desktop OS VDAs running Windows Vista and later, and Server OS VDAs running Windows Server 2008 and later are supported. For more information, see Historical application failure monitoring
By default, only application faults from Server OS VDAs are displayed. You can set the monitoring of application failures by using Monitoring policies. For more information, see Monitoring policy settings
Create customized reports: The Custom Reports tab provides a user interface for generating Custom Reports containing real-time and historical data from the Monitoring database in tabular format.
This feature requires Delivery Controller(s) version 7.12 or later.
From the list of previously saved Custom Report queries, you can click Execute to export the report in CSV format, click Copy OData to copy and share the corresponding OData query, or click Edit to edit the query. You can create a new Custom Report query based on machines, connections, sessions, or application instances. Specify filter conditions based on fields such as machine, Delivery Group, or time period. Specify additional columns required in your Custom Report. Preview displays a sample of the report data. Saving the Custom Report query adds it to the list of saved queries.
You can create a new Custom Report query based on a copied OData query. To do this, select the OData Query option and paste the copied OData query. You can save the resultant query for execution later.
The flag icons on the graph indicate significant events or actions for that specific time range. Hover the mouse over the flag and click to list events or actions.
Notes:
- HDX connection logon data is not collected for VDAs earlier than 7. For earlier VDAs, the chart data is displayed as 0.
- Delivery Groups deleted in Citrix Studio are available for selection in the Director Trends filters until data related to them are groomed out. Selecting a deleted Delivery Group displays graphs for available data until retention. However, the tables don’t show data.
- Moving a machine containing active sessions from one Delivery Group to another causes the Resource Utilization and Load Evaluator Index tables of the new Delivery Group to display metrics consolidated from the old and new Delivery Groups.
Export reports
You can export trends data to generate regular usage and capacity management reports. Export supports PDF, Excel, and CSV report formats. Reports in PDF and Excel formats contain trends represented as graphs and tables. CSV format reports contain tabular data that can be processed to generate views or can be archived.
To export a report:
- Go to the Trends tab.
- Set filter criteria and time period and click Apply. The trend graph and table are populated with data.
- Click Export and enter name and format of the report.
Director generates the report based on the filter criteria you select. If you change the filter criteria, click Apply before you click Export.
Note: Export of a large amount of data causes a significant increase in memory and CPU consumption on the Director server, the Delivery Controller™, and the SQL servers. The supported number of concurrent export operations and the amount of data that can be exported is set to default limits to achieve optimal export performance.
Supported export limits
Exported PDF and Excel reports contain complete graphical charts for the selected filter criteria. However, tabular data in all report formats is truncated beyond the default limits on the number of rows or records in the table. The default number of records supported is defined based on the report format.
You can change the default limit by configuring the Director Application Settings in Internet Information Services (IIS).
| Report format | Default number of records supported | Fields in Director Application Settings | Max number of records supported |
|---|---|---|---|
| 500 | UI.ExportPdfDrilldownLimit | 5000 | |
| Excel | 100,000 | UI.ExportExcelDrilldownLimit | 100,000 |
| CSV | 100,000 (10,000,000 in Sessions tab) | UI.ExportCsvDrilldownLimit | 100,000 |
To change the limit of the number of records you can export:
- Open the IIS Manager console.
- Go to the Director website under the Default website.
- Double-click Application Settings.
- Edit the field or add a new field.
Adding these field values in Application Settings overrides the default values.
Warning: Setting field values greater than the max number of records supported can impact the performance of Export and is not supported.
Error Handling
This section gives you information on dealing with errors that you might encounter during Export operation.
- Director has timed out
This error could occur due to network issues or high resource usage on the Director server or with the Monitor Service.
The default timeout duration is 100 seconds. To increase the timeout duration of the Director Service, set the value of Connector.DataServiceContext.Timeout field in Director Application Settings in Internet Information Services (IIS):
-
Open the IIS Manager console.
-
Go to the Director website under the Default website.
-
Double-click Application Settings.
-
Edit the value Connector.DataServiceContext.Timeout.
- Monitor has timed out
This error could occur due to network issues or high resource usage with the Monitor Service or on the SQL server.
To increase the timeout duration of the Monitor Service, run the following PowerShell commands on the Delivery Controller:
asnp Citrix.*
Get-MonitorConfiguration
Set-MonitorConfiguration -MonitorQueryTimeoutSeconds <timeout value>
- Max concurrent Export or Preview operations ongoing
Director supports one instance of Export or Preview. If you get the Max concurrent Export or Preview operations ongoing error, try the next Export operation again later.
It is possible to increase the number of concurrent Export or Preview operations, however this can impact the performance of Director and is not supported:
-
Open the IIS Manager console.
-
Go to the Director website under the Default website.
-
Double-click Application Settings.
-
Edit the value UI.ConcurrentExportLimit.
- Insufficient disk space in Director
Each Export operation requires a maximum of 2GB hard disk space in the Windows Temp folder. Retry Export after clearing space or adding more hard disk space on the Director server.
Monitor hotfixes
To view the hotfixes installed on a specific machine VDA (physical or VM), choose the Machine Details view.
Control user machine power states
To control the state of the machines that you select in Director, use the Power Control options. These options are available for Desktop OS machines, but might not be available for Server OS machines.
Note: This functionality is not available for physical machines or machines using Remote PC Access.
| Command | Function |
|---|---|
| Restart | Performs an orderly (soft) shutdown of the VM and all running processes are halted individually before restarting the VM. For example, select machines that appear in Director as “failed to start,” and use this command to restart them. |
| Force Restart | Restarts the VM without first performing any shut-down procedure. This command works in the same way as unplugging a physical server and then plugging it back in and turning it back on. |
| Shut Down | Performs an orderly (soft) shutdown of the VM; all running processes are halted individually. |
| Force Shutdown | Shuts down the VM without first performing any shut-down procedure. This command works in the same way as unplugging a physical server. It might not always shut down all running processes, and you risk losing data if you shut down a VM in this way. |
| Suspend | Suspends a running VM in its current state and stores that state in a file on the default storage repository. This option allows you to shut down the VM’s host server and later, after rebooting it, resume the VM, returning it to its original running state. |
| Resume | Resumes a suspended VM and restores its original running state. |
| Start | Starts a VM when it is off (also called a cold start). |
If power control actions fail, hover the mouse over the alert, and a pop-up message appears with details about the failure.
Prevent connections to machines
Use maintenance mode to prevent new connections temporarily while the appropriate administrator performs maintenance tasks on the image.
When you enable maintenance mode on machines, no new connections are allowed until you disable it. If users are currently logged on, maintenance mode takes effect as soon as all users are logged off. For users who do not log off, send a message informing them that machines will be shut down at a certain time, and use the power controls to force the machines to shut down.
- Select the machine, such as from the User Details view, or a group of machines in the Filters view.
- Select Maintenance Mode, and turn on the option.
If a user tries to connect to an assigned desktop while it is in maintenance mode, a message appears indicating that the desktop is currently unavailable. No new connections can be made until you disable maintenance mode.