Troubleshoot application reachability (Connector Appliance to backend app)
When a Web, SaaS, or TCP/UDP application that is delivered through Secure Private Access™ fails to launch, the cause is often a network problem between the Connector Appliance and the backend application server. Until now, administrators had no easy way to confirm whether the Connector Appliance could actually reach the backend, or to see exactly where the connection broke.
The Run probe option in Monitor solves this. It lets you trigger an on-demand network probe (a connectivity test) from a specific Connector Appliance to a backend host or application.
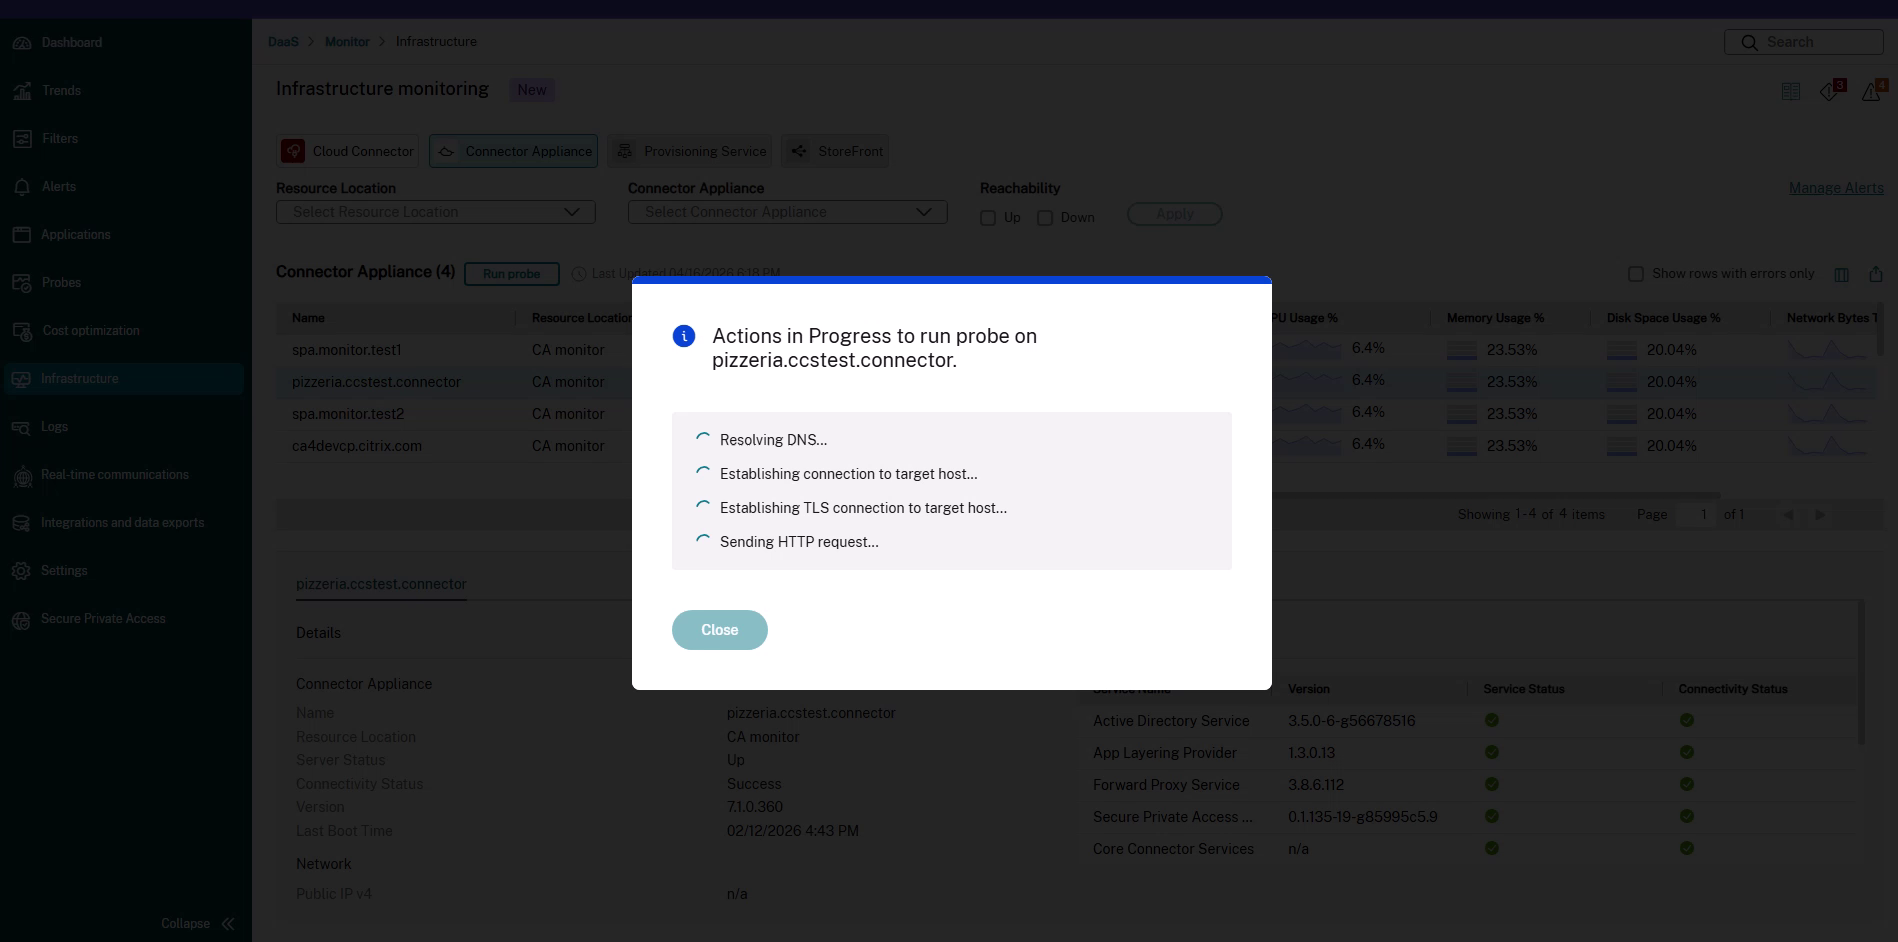
The probe walks through each stage of the connection—DNS resolution, TCP connection, TLS handshake, and the HTTP request—and reports the outcome and the time taken for each stage.
This helps you quickly confirm reachability and pinpoint the exact step that fails, without having to log on to the Connector Appliance console.
You can start a probe from two places in Monitor:
- The Infrastructure view, where you choose any monitored Connector Appliance and probe an arbitrary host or application.
- The Application Topology view of a Secure Private Access session, where the probe is offered in context when an app launch has failed to connect to its destination.
Requirements
- Running a probe is an administrative troubleshooting action. You must sign in to Monitor as an administrator with full administrator permissions. The Run probe option isn’t available to help desk administrators.
- You must have Secure Private Access entitlement to trigger a probe.
- The Connector Appliance must be monitored in the Infrastructure view. For more information, see Infrastructure monitoring.
- To start a probe from the topology view, you need both Citrix DaaS™ and Secure Private Access entitlements. For more information, see Secure Private Access integration with Monitor.
Probe protocols and inputs
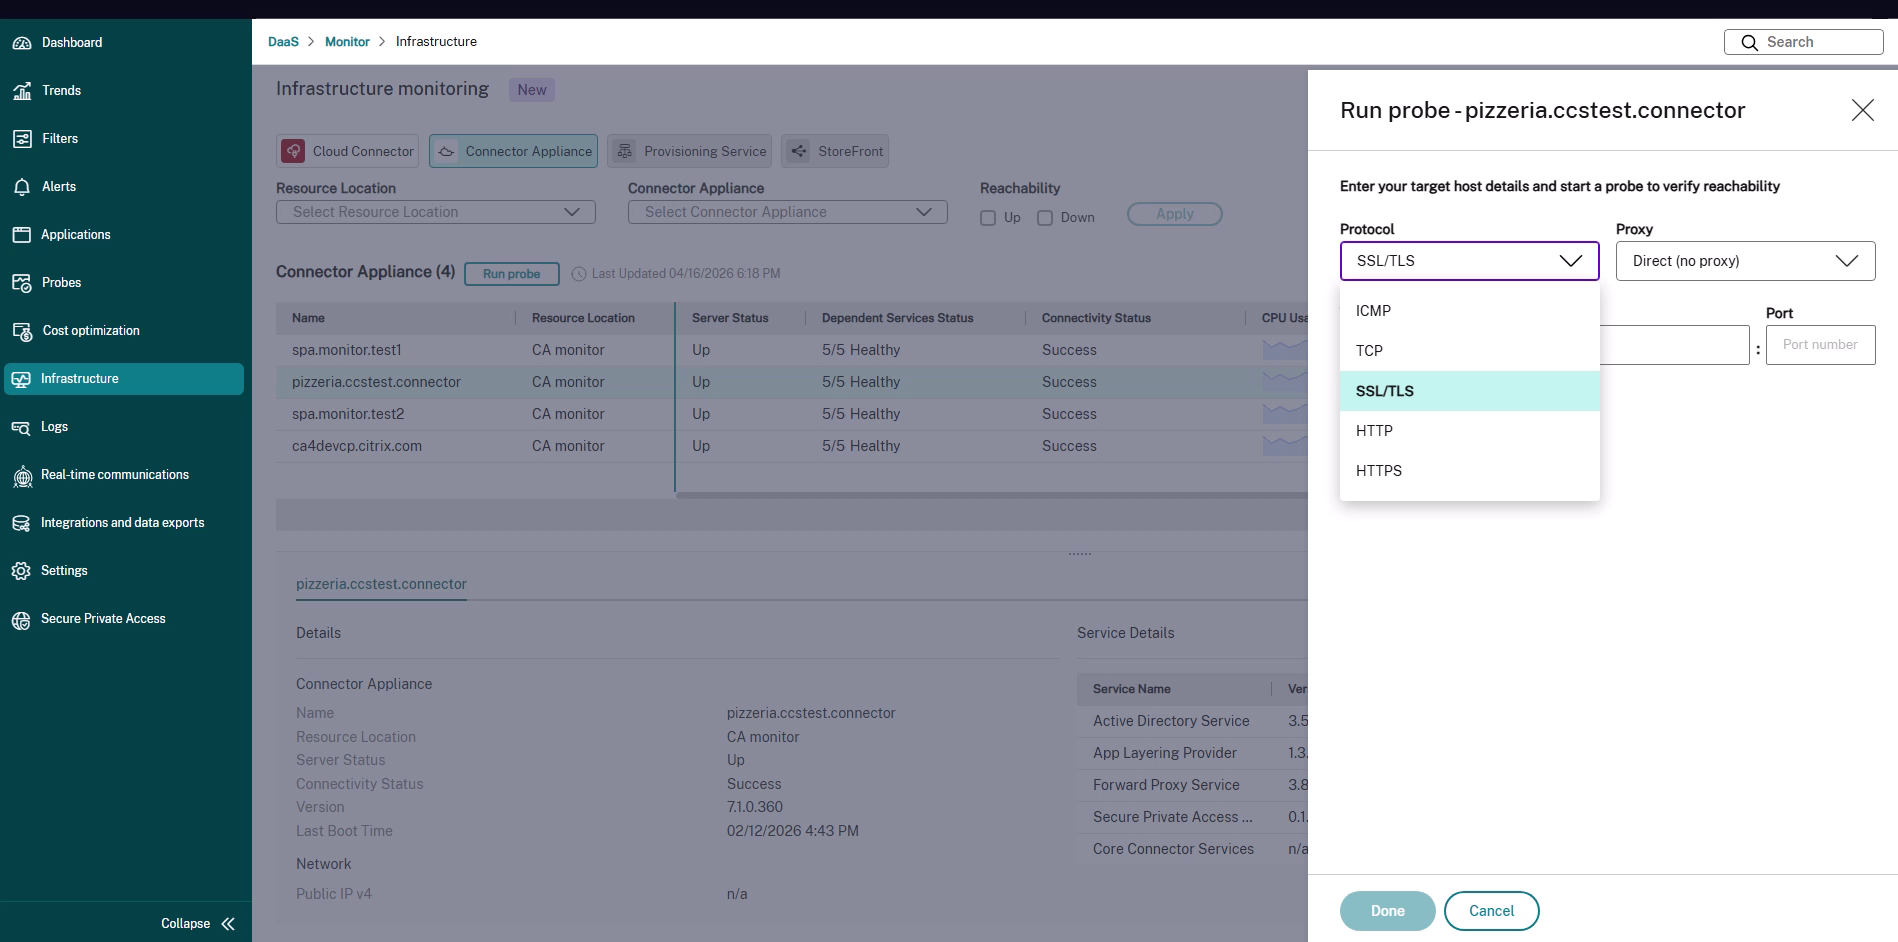
When you start a probe, you choose the Protocol that matches the backend you want to test. The protocol determines which connection stages are tested and which target details you provide.
| Protocol | What it tests | Target details to provide |
|---|---|---|
| ICMP | Whether the backend host responds to a ping from the Connector Appliance. | Target host (IP address or host name). No port required. |
| TCP | DNS resolution and whether a TCP connection can be opened on the port. | Target host and port. |
| SSL/TLS | DNS resolution, TCP connection, and the TLS handshake (including certificate negotiation). | Target host and port. |
| HTTP | DNS resolution, TCP connection, and the HTTP request or response. | Application URL. |
| HTTPS | DNS resolution, TCP connection, TLS handshake, and the HTTPS request or response. | Application URL. |
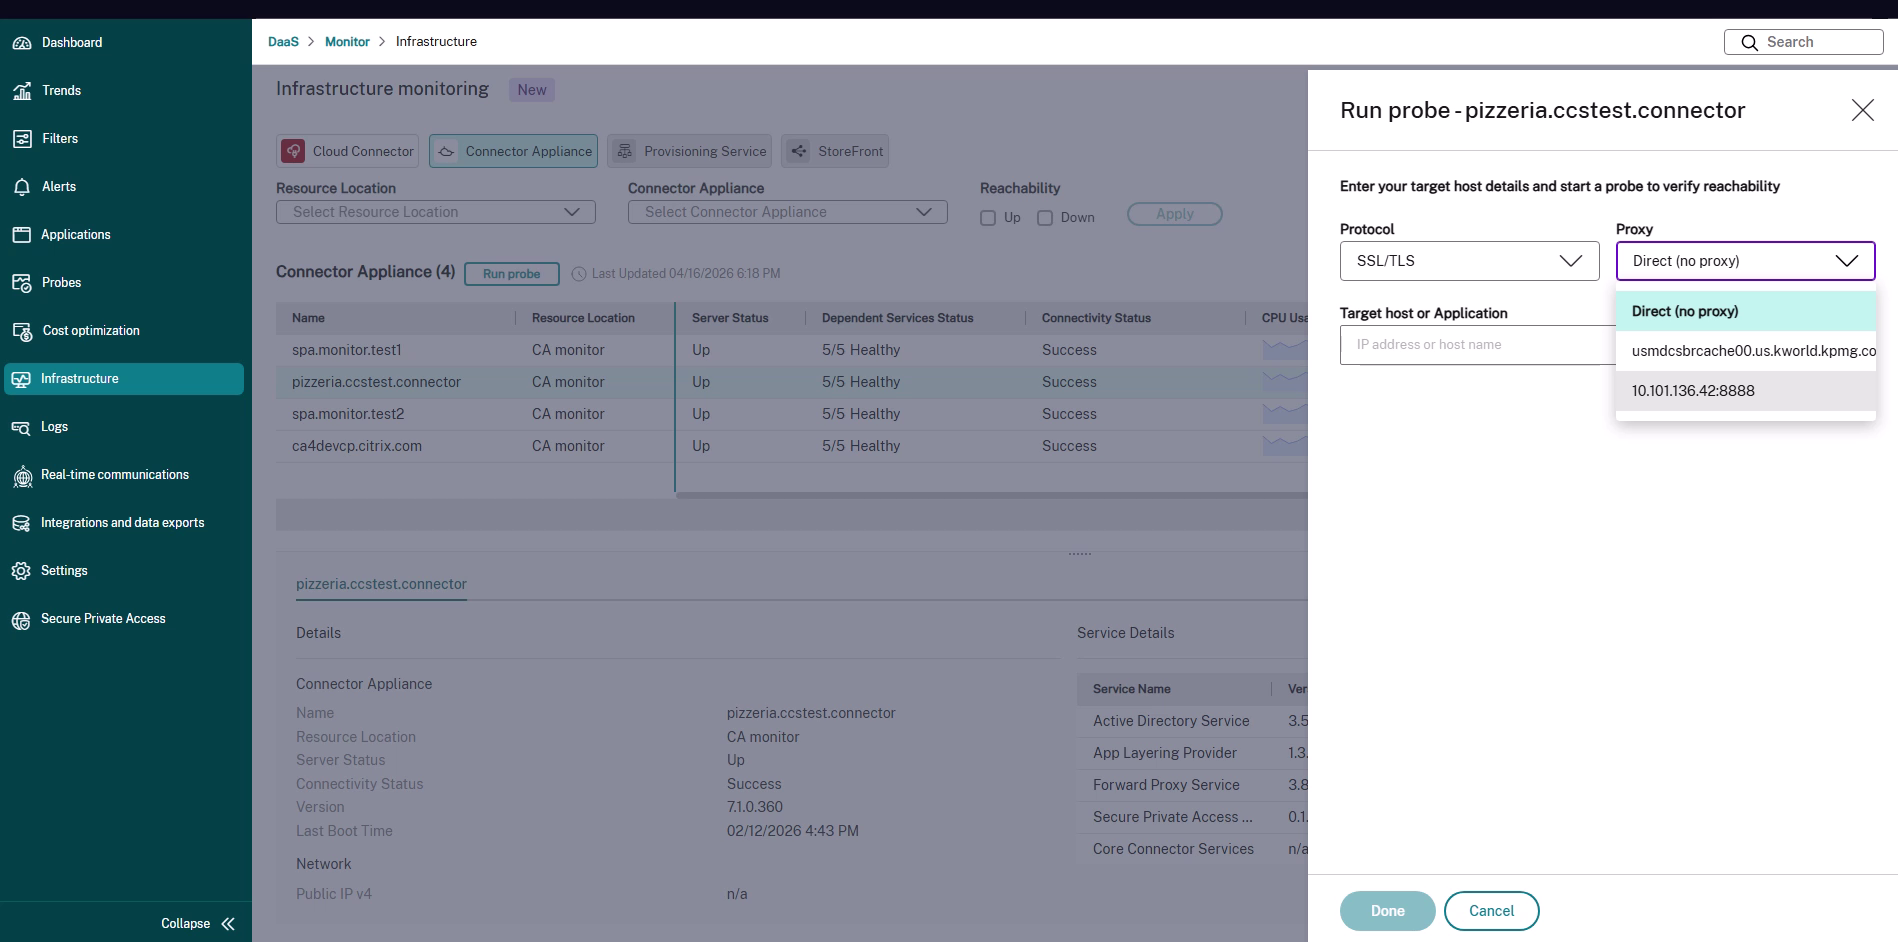
You can also choose whether the probe runs directly or through a proxy using the Proxy list:
- Direct (no proxy) – The Connector Appliance connects straight to the target.
-
<proxy> – The Connector Appliance routes the probe through the selected proxy. The list shows the proxies (as
FQDN:PORTorIP:PORT) that are available for the probe.
Run a probe from the Infrastructure view
Use this method when you want to test reachability to any host or application from a chosen Connector Appliance—for example, to check a backend server that an app depends on.
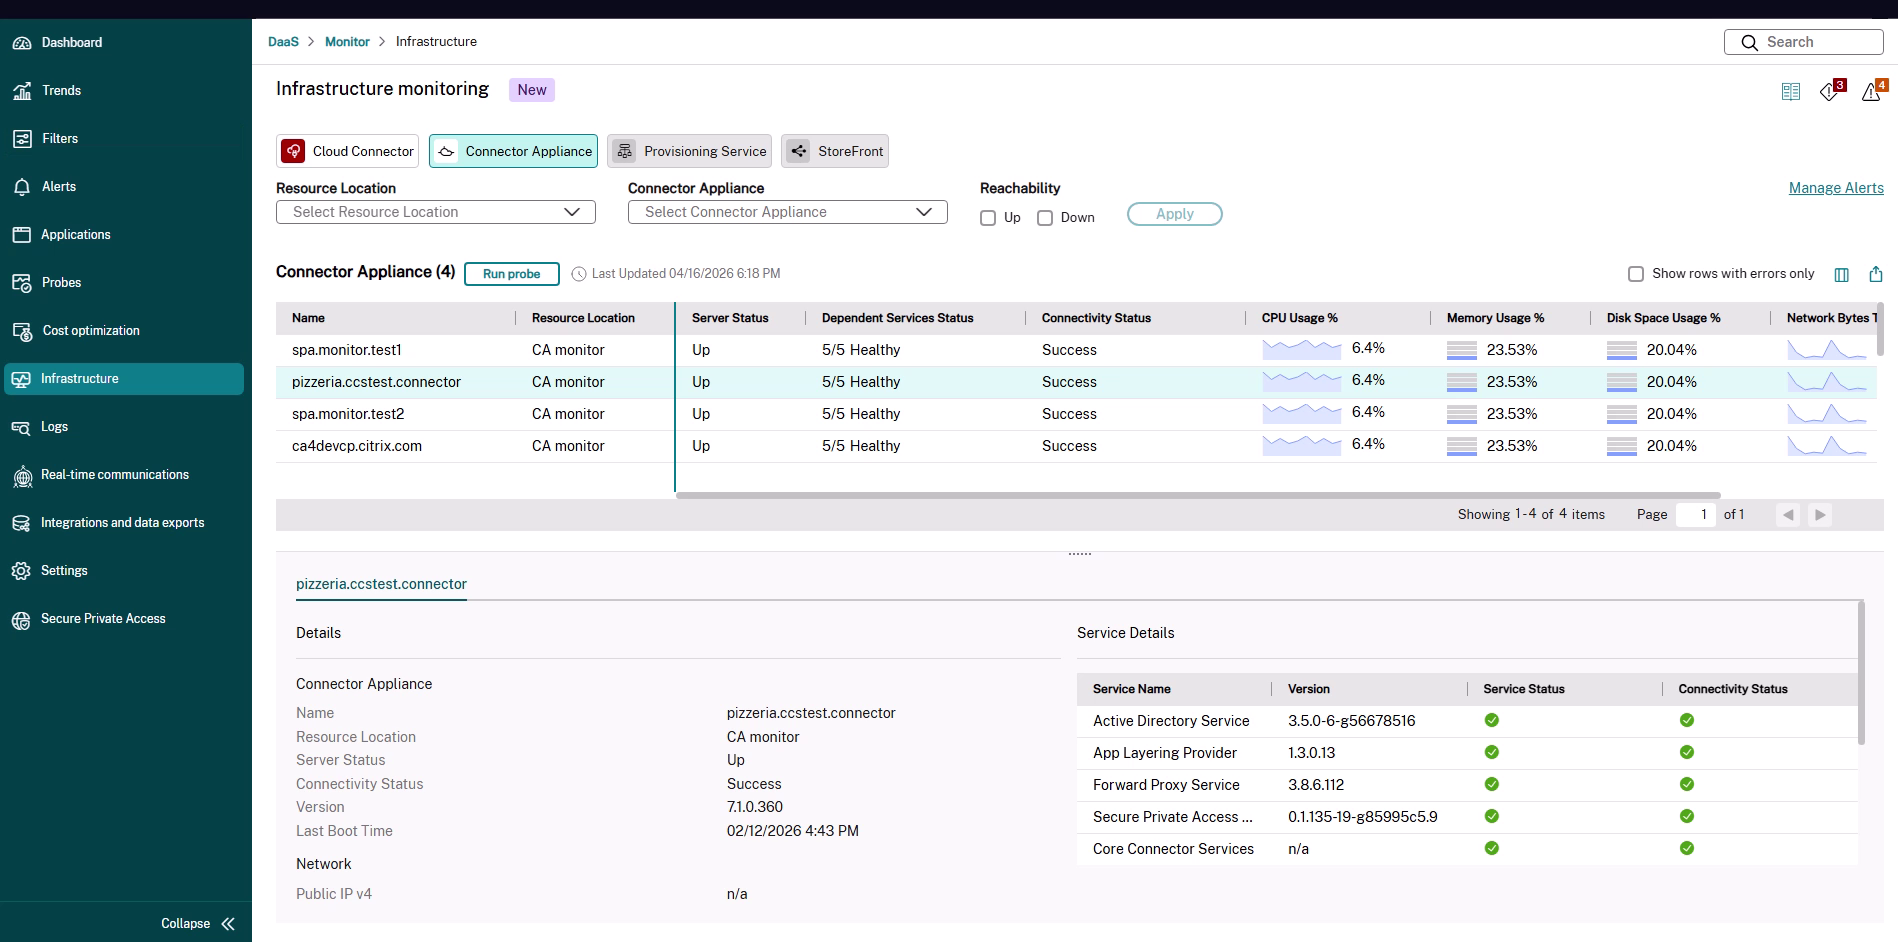
-
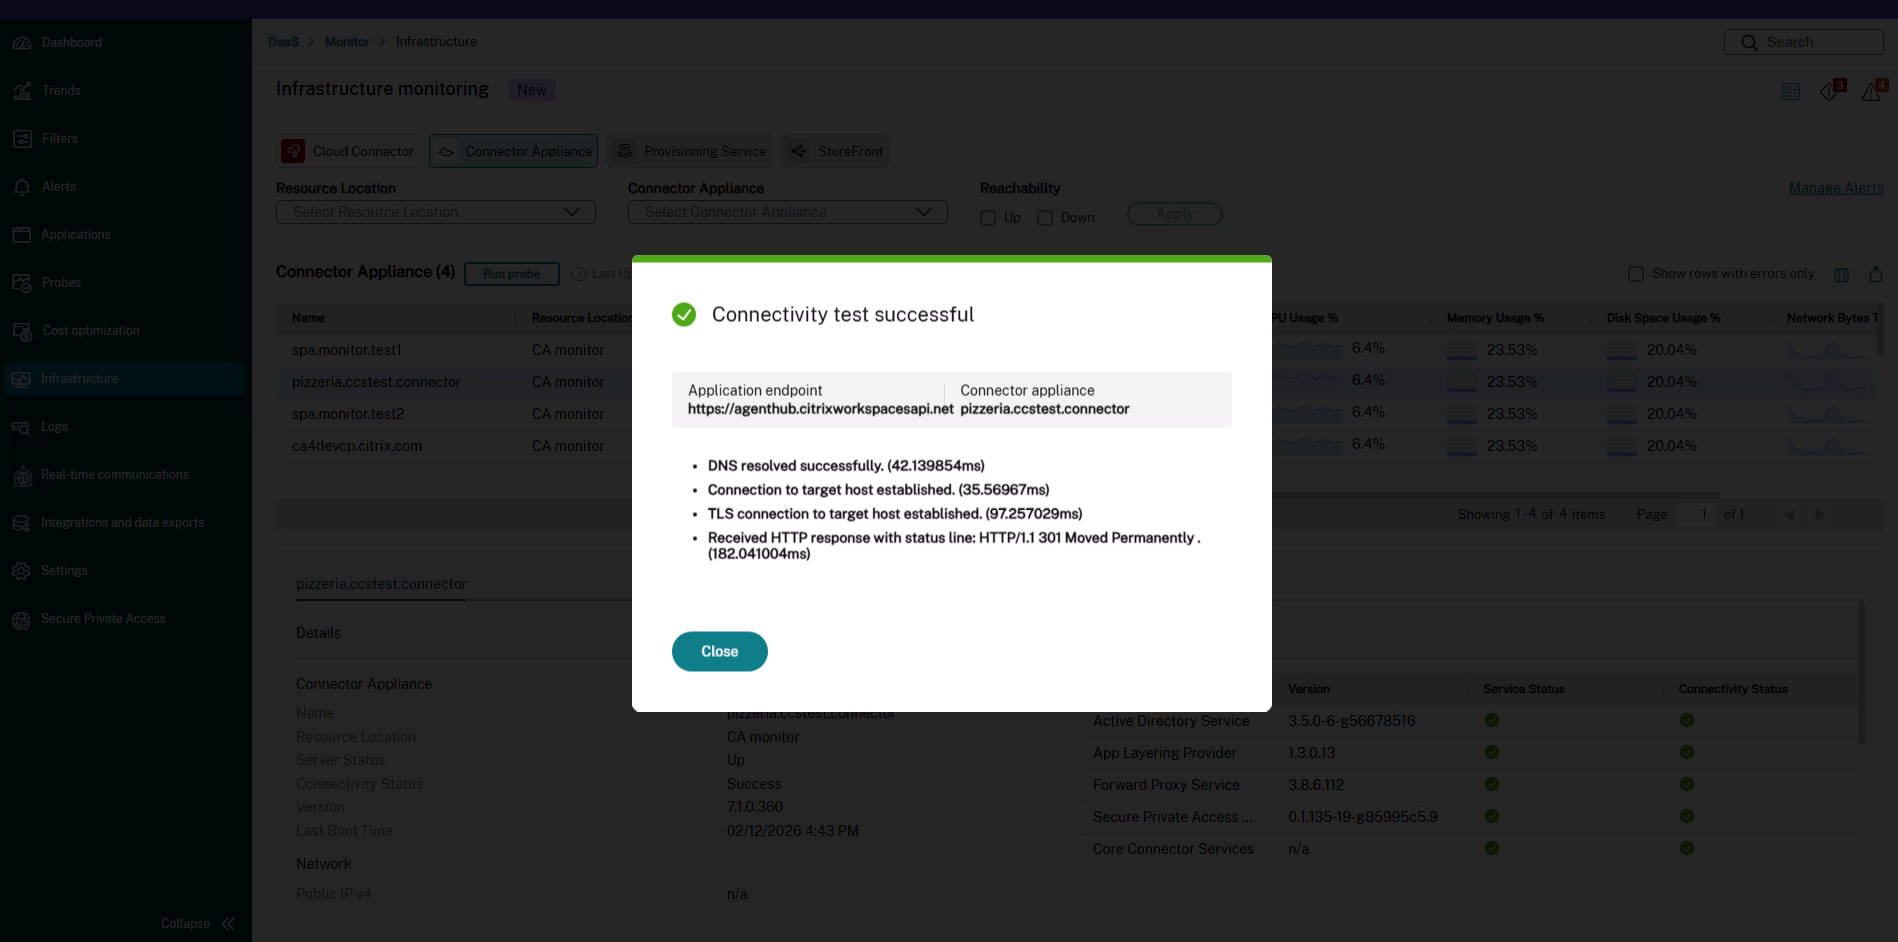
In Monitor, go to Infrastructure and select the Connector Appliance tab. The table lists the monitored Connector Appliances with their server status, dependent services status, connectivity status, and resource usage.
-
Select the row of the Connector Appliance that you want to probe from, and then click Run probe.
-
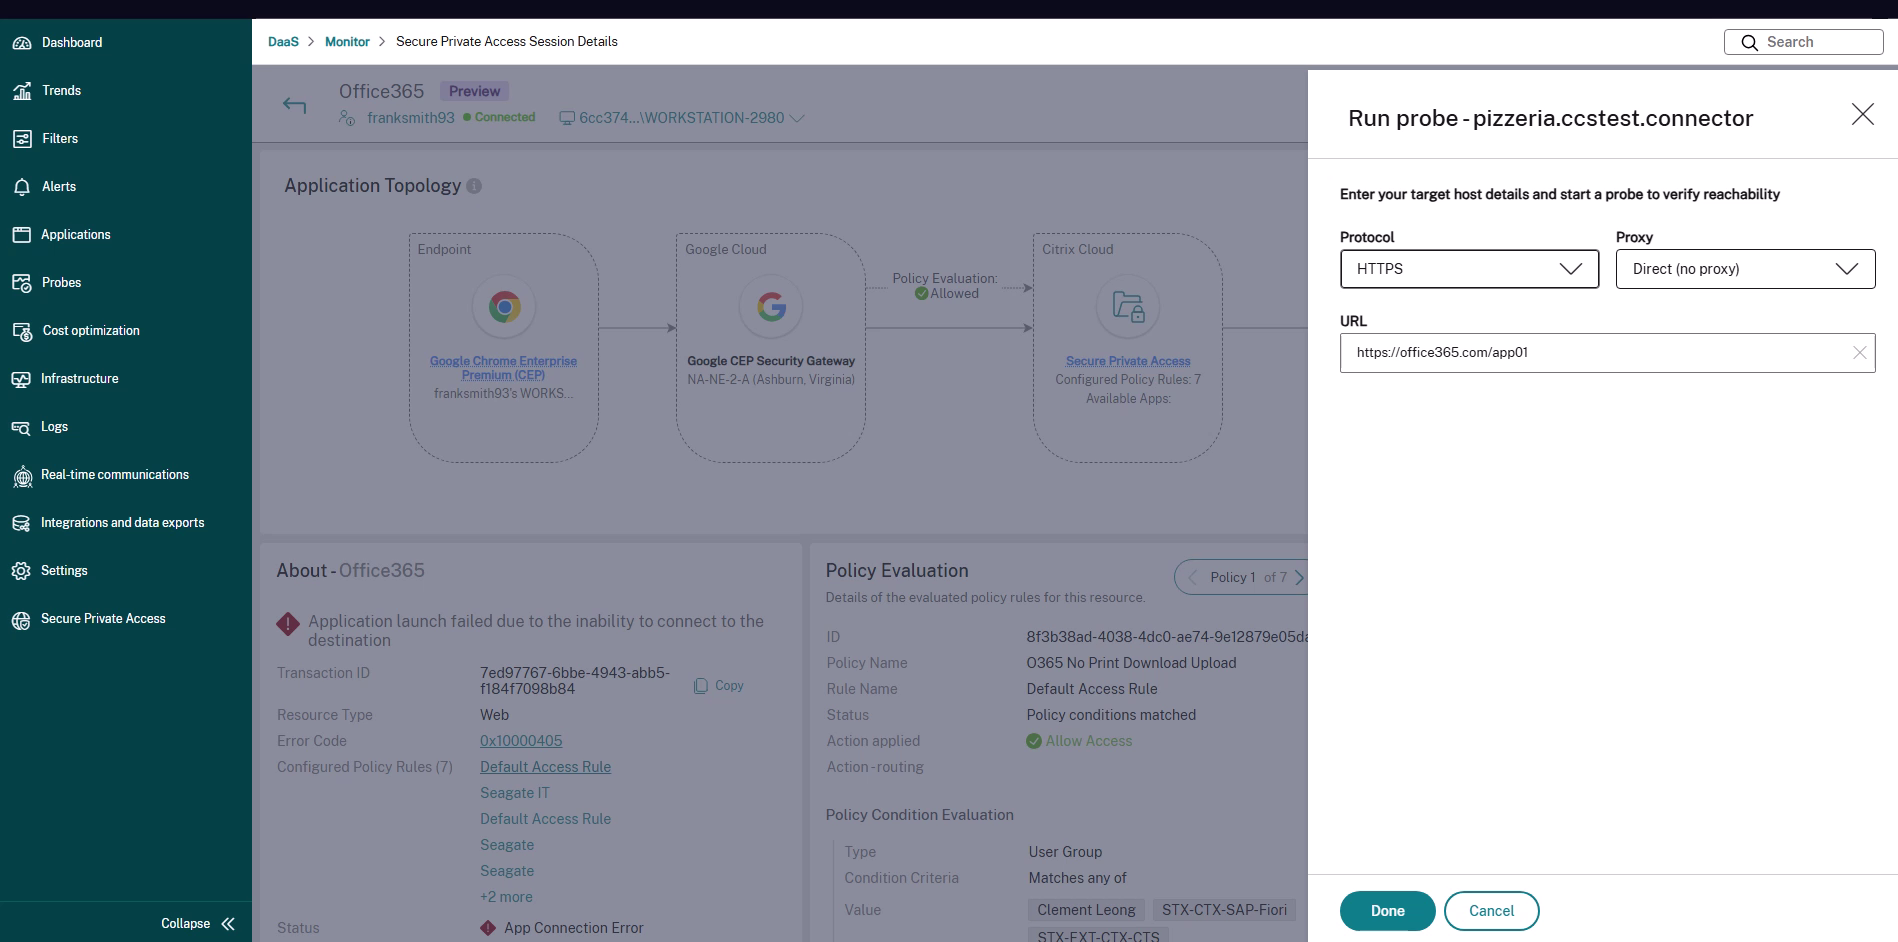
In the Run probe panel, select a Protocol and, if required, a Proxy.
-
If you want the probe to go through a proxy, select it from the Proxy list. Otherwise, leave Direct (no proxy) selected.
-
Enter the target details for the protocol you selected:
- For ICMP, TCP, and SSL/TLS, type the Target host or Application (IP address or host name) and, where applicable, the Port.
- For HTTP and HTTPS, type the application URL.
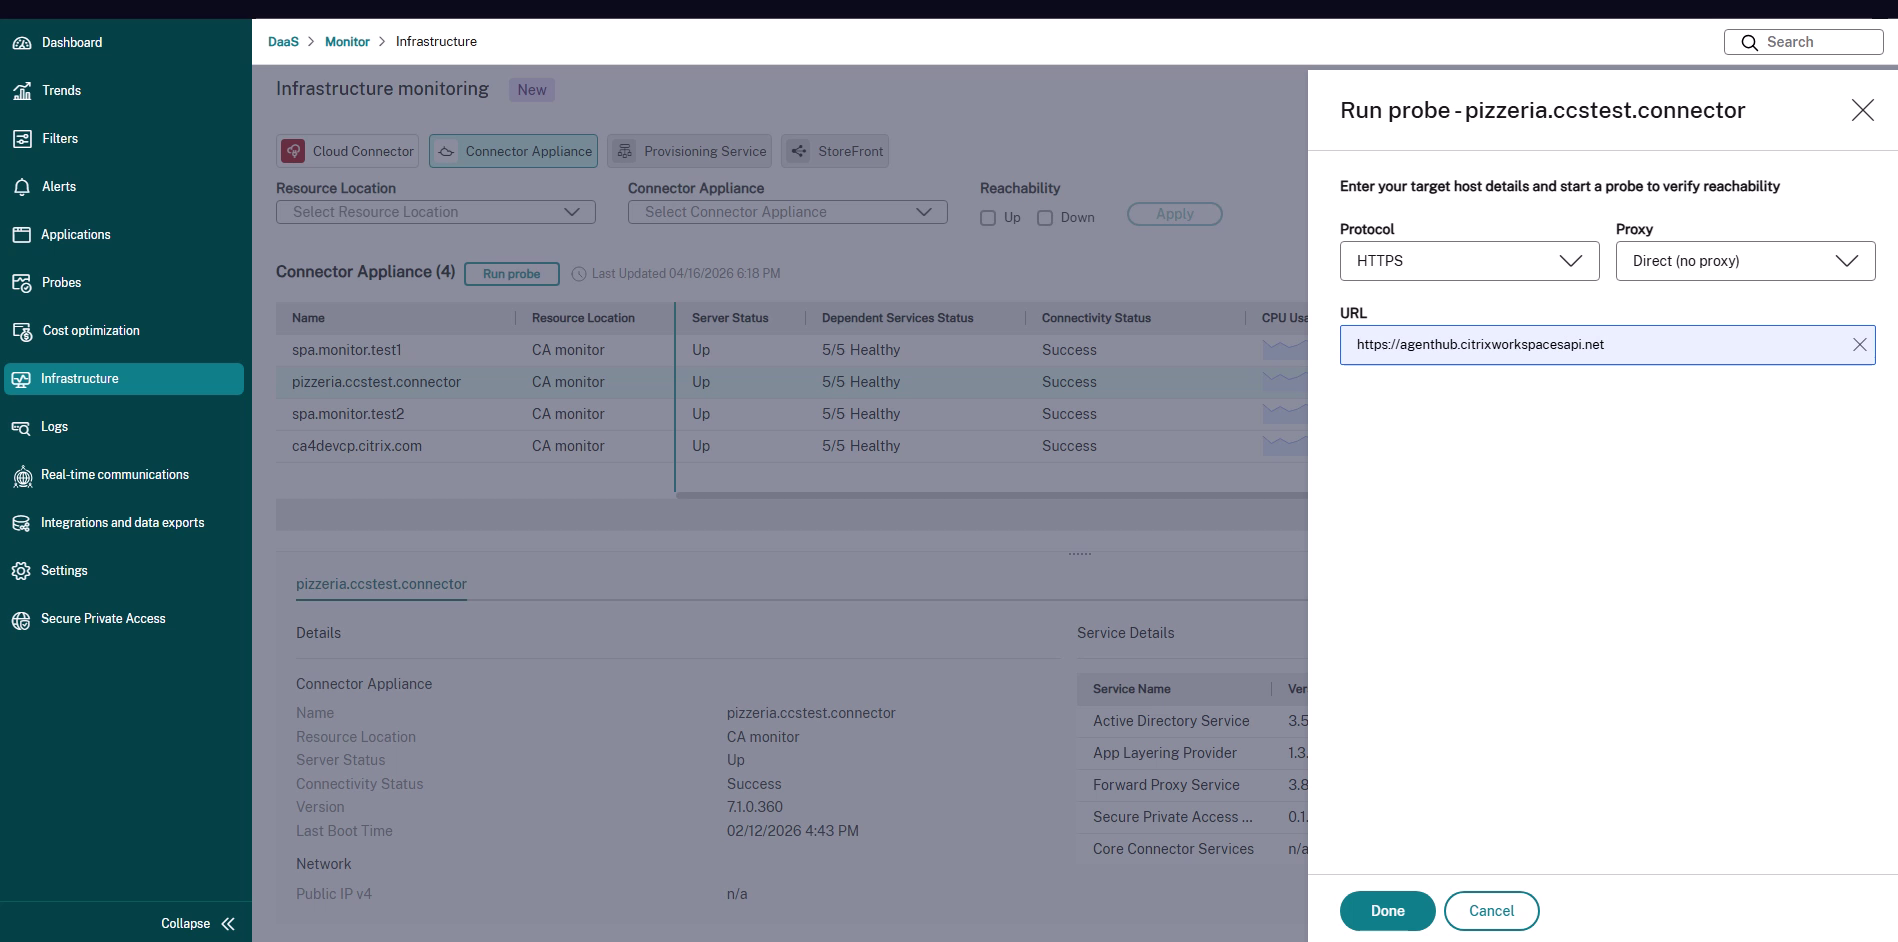
-
Click Done to start the probe.
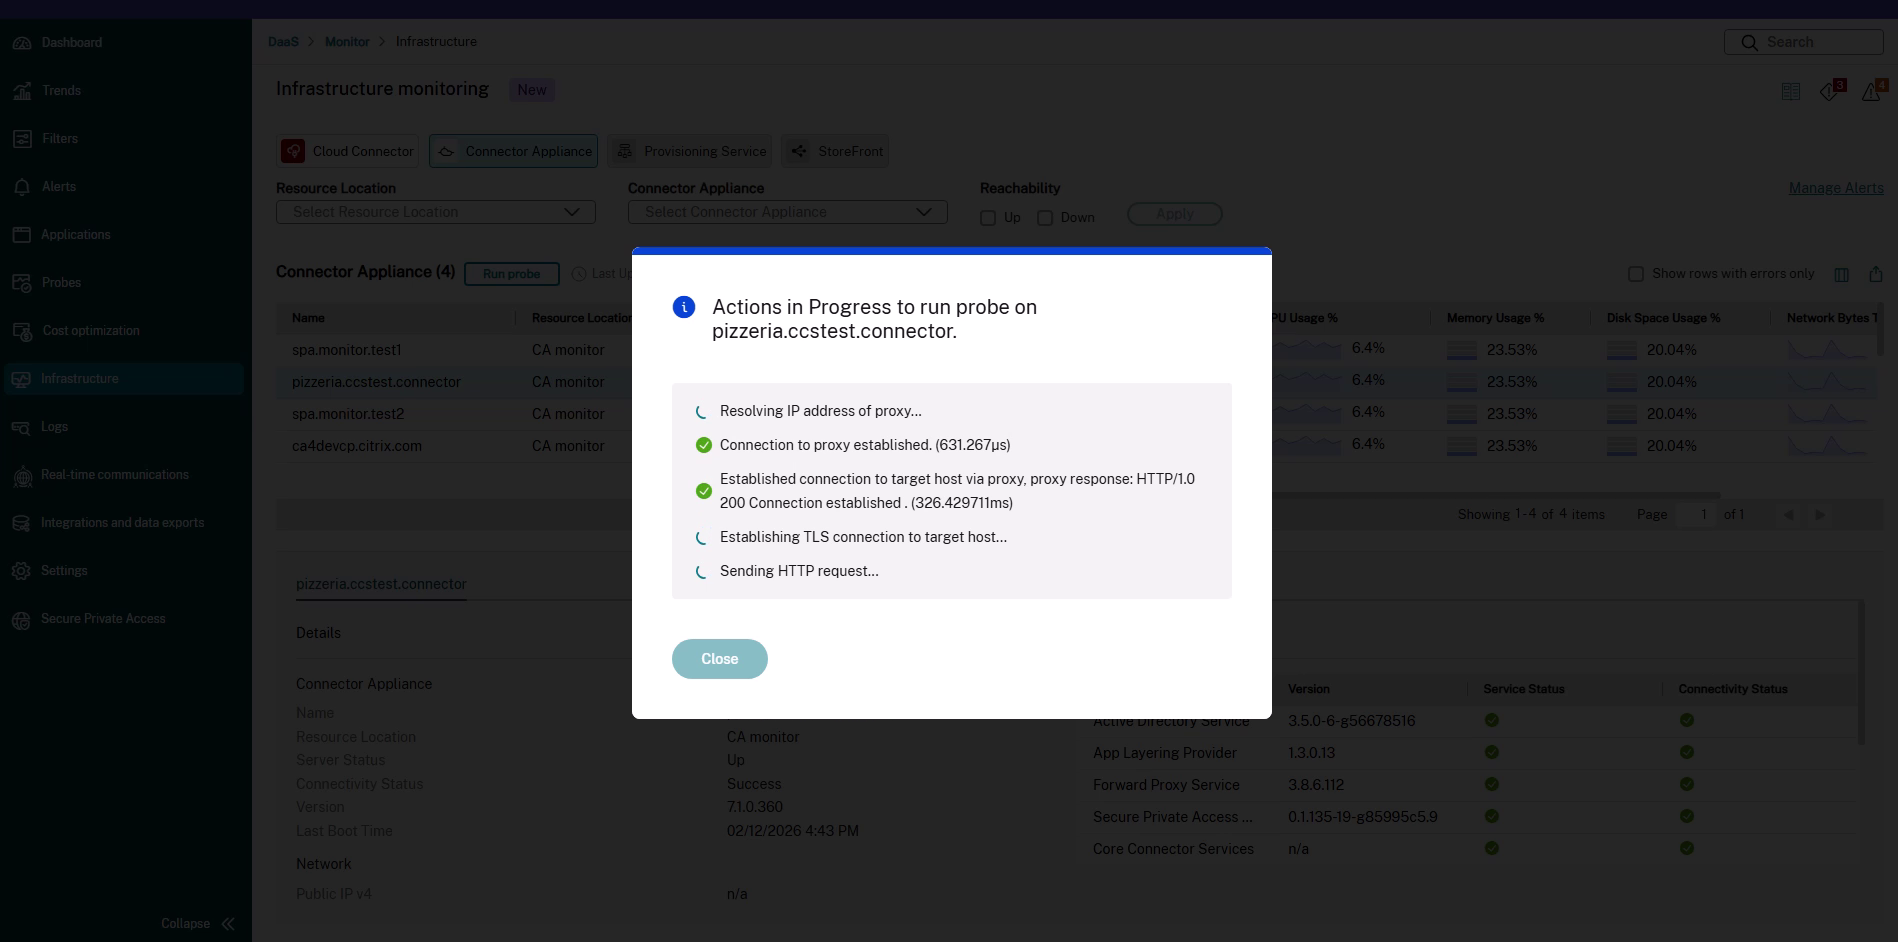
Monitor shows the Actions in Progress dialog and updates each connection stage as it runs.
-
When the probe finishes, review the result. For more information, see Understand the probe results. Click Close to dismiss the dialog.
Run a probe from the Application Topology view
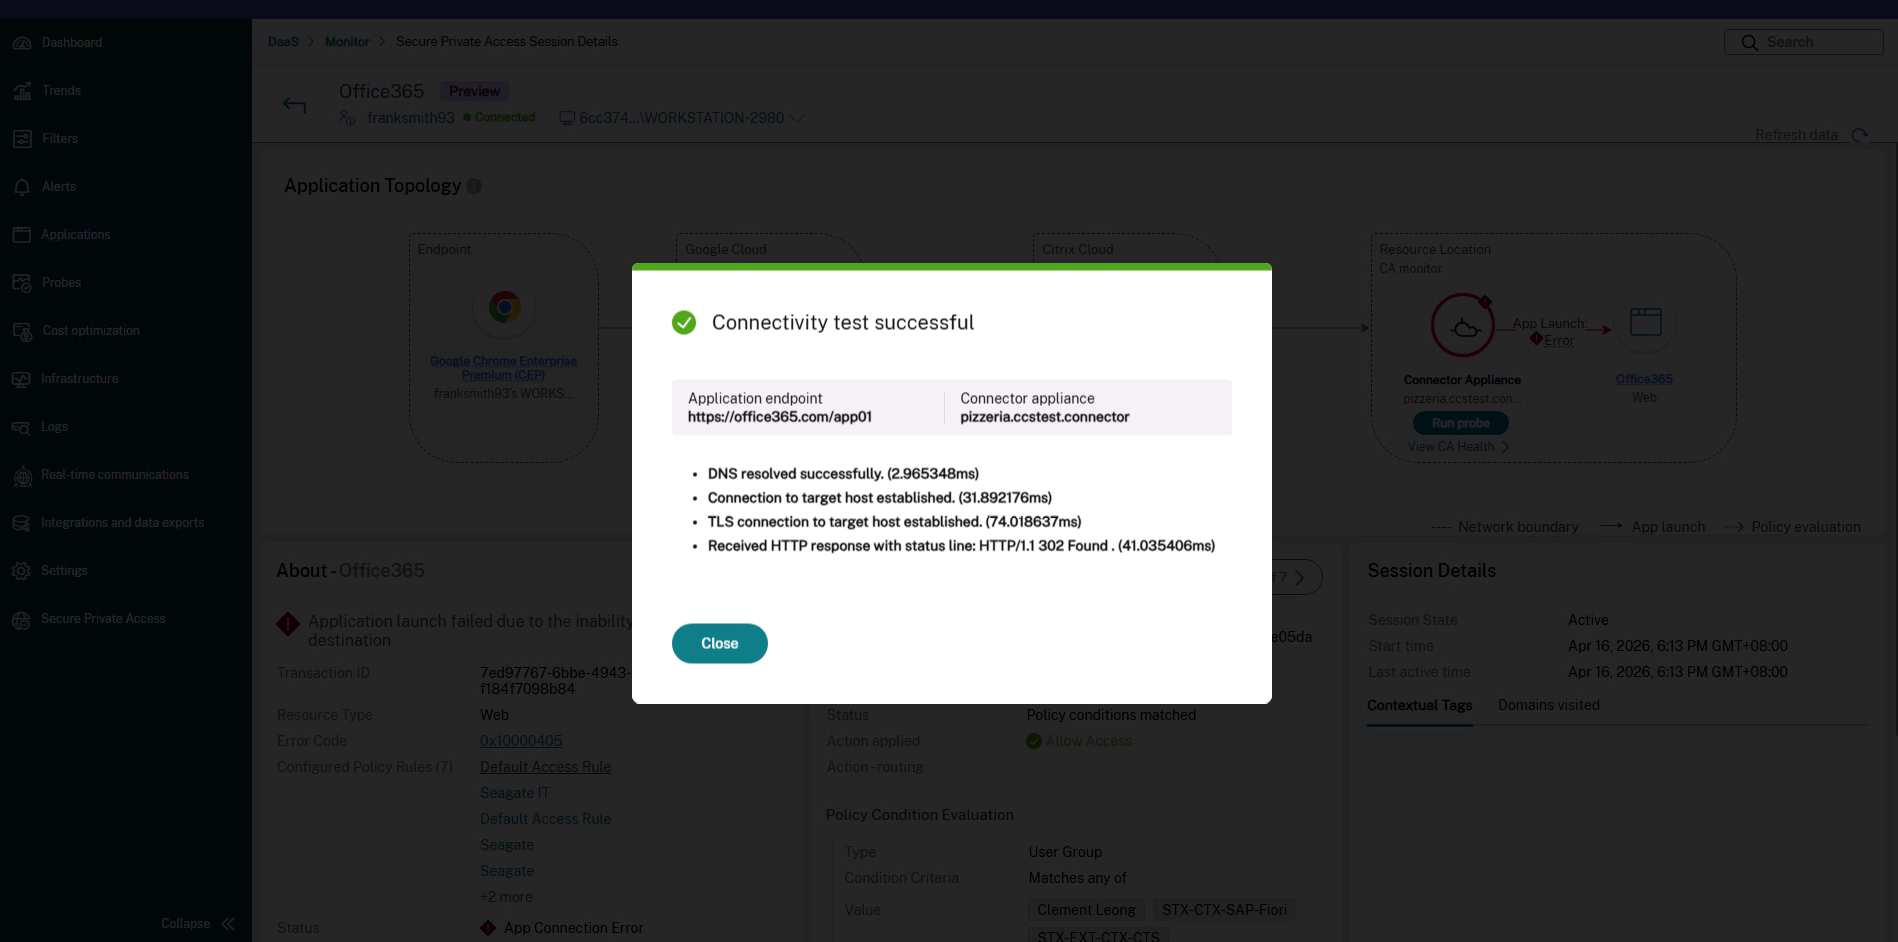
Use this method when you are already troubleshooting a failed Secure Private Access app launch. The probe is offered in context, with the protocol and target prefilled from the failing application.
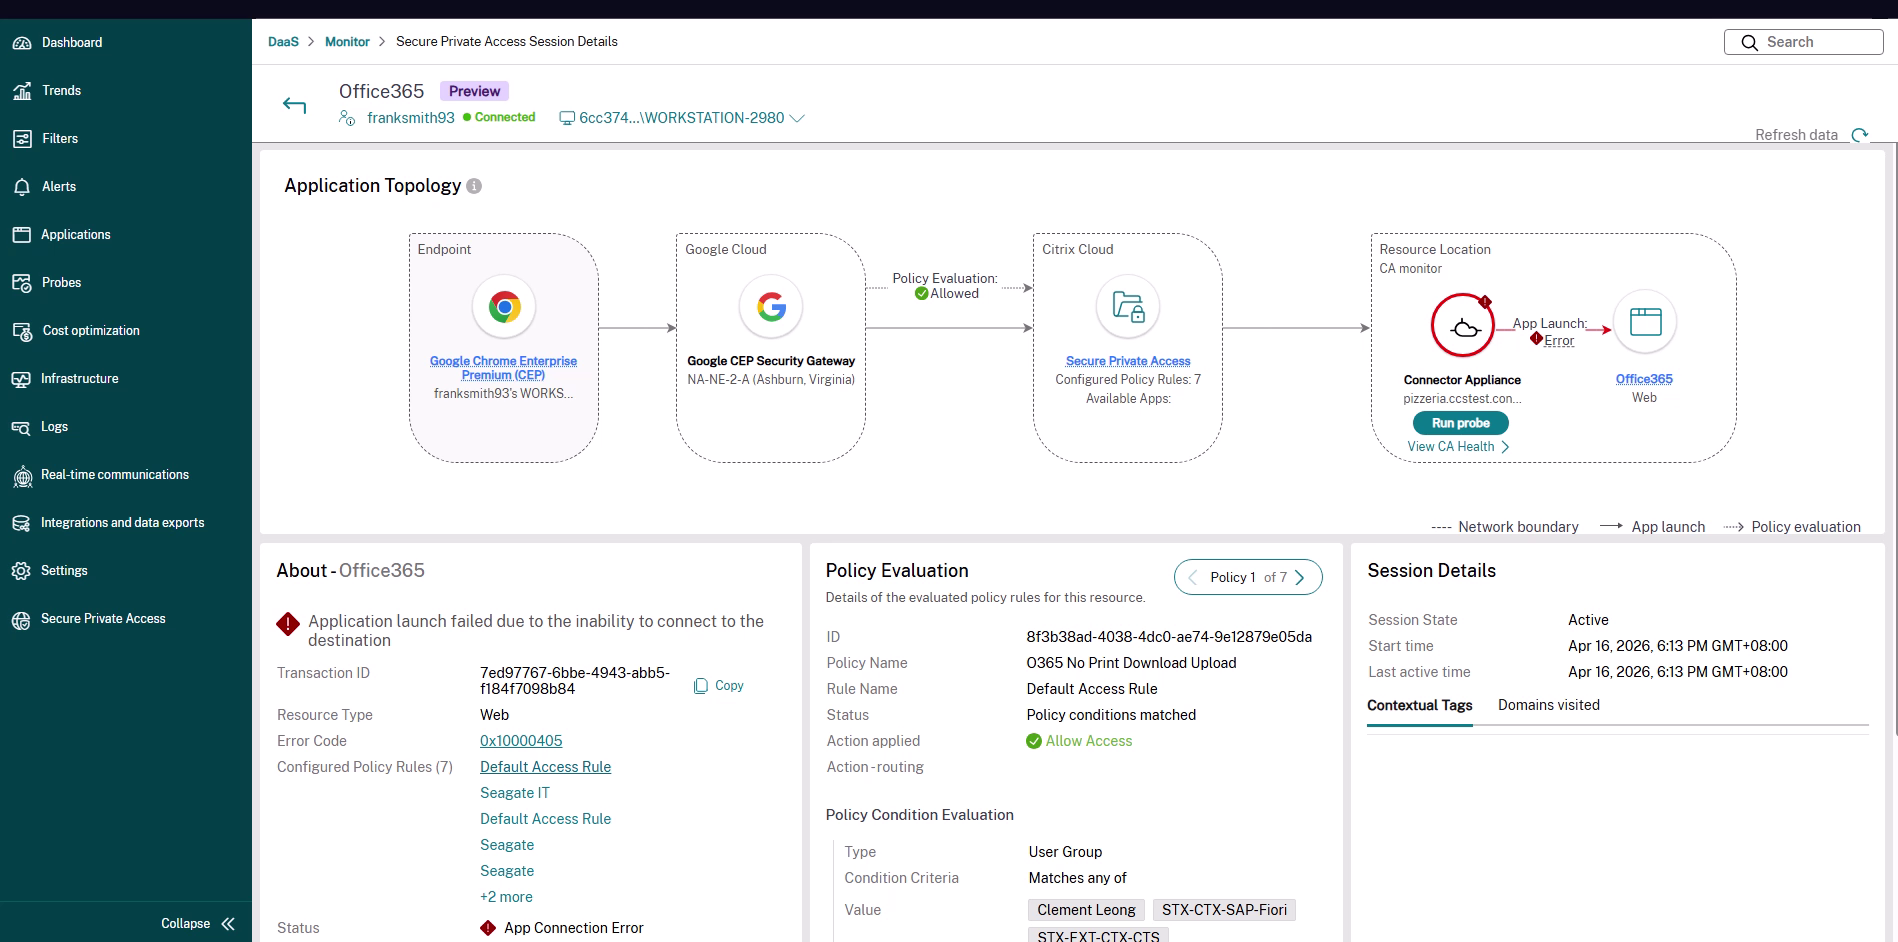
When a Web, SaaS, or TCP/UDP app fails to launch because the Connector Appliance can’t reach the backend, the Application Topology highlights the segment between the Connector Appliance and the backend application as an App Launch Error, and the About pane shows Application launch failed due to the inability to connect to the destination.
-
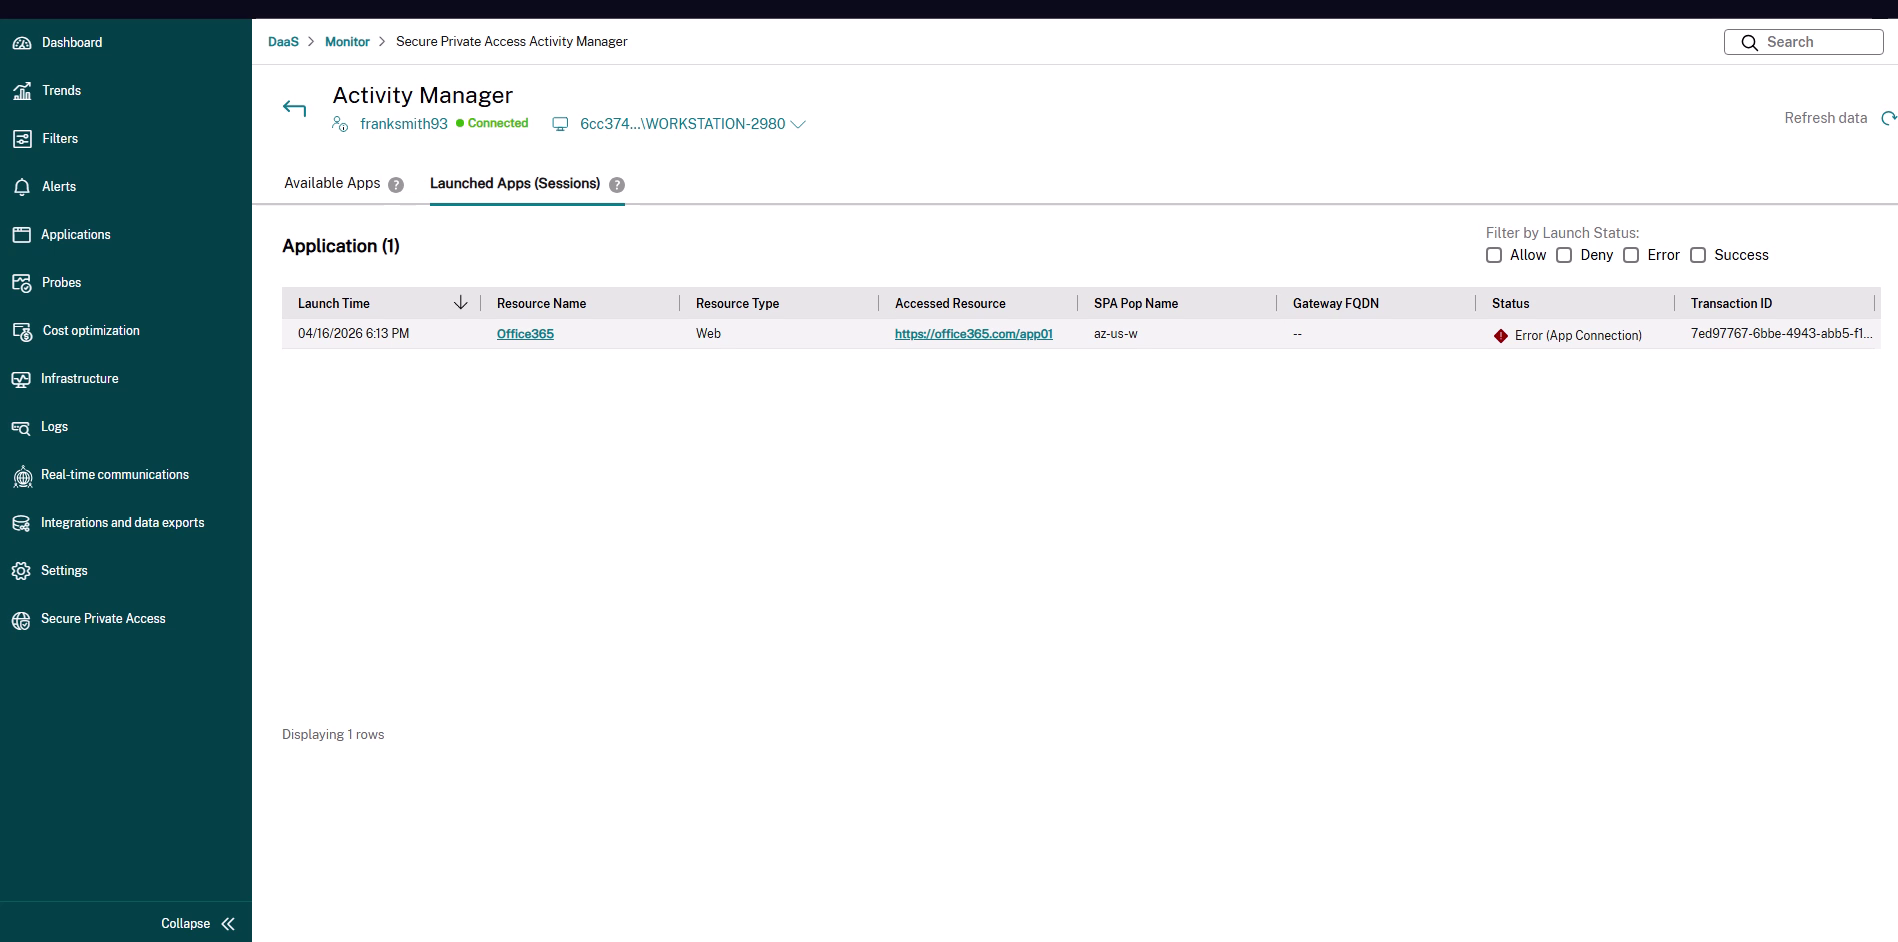
Open the Secure Private Access Session Details page for the affected session. A typical path is to search for the user, open the Activity Manager, select the Launched Apps (Sessions) tab, and then click the application that reports an Error (App Connection) status. For more information about navigating to a session, see Secure Private Access integration with Monitor.
-
In the Application Topology, locate the Connector Appliance node in the Resource Location. When the launch failed at this hop, the node shows a Run probe button (and a View CA Health link).
-
Click Run probe. The Run probe panel opens with the Protocol and the application URL prefilled from the failed launch. Adjust the details if needed.
-
Click Done to start the probe, and then review the result when it finishes.
Running the probe confirms whether the selected Connector Appliance can reach the application endpoint. If the probe succeeds while the app still fails to launch, you can rule out Connector-Appliance-to-backend reachability and focus your investigation elsewhere. If the probe fails, the result shows the stage that failed, which points you to the underlying network or backend issue.
Understand the probe results
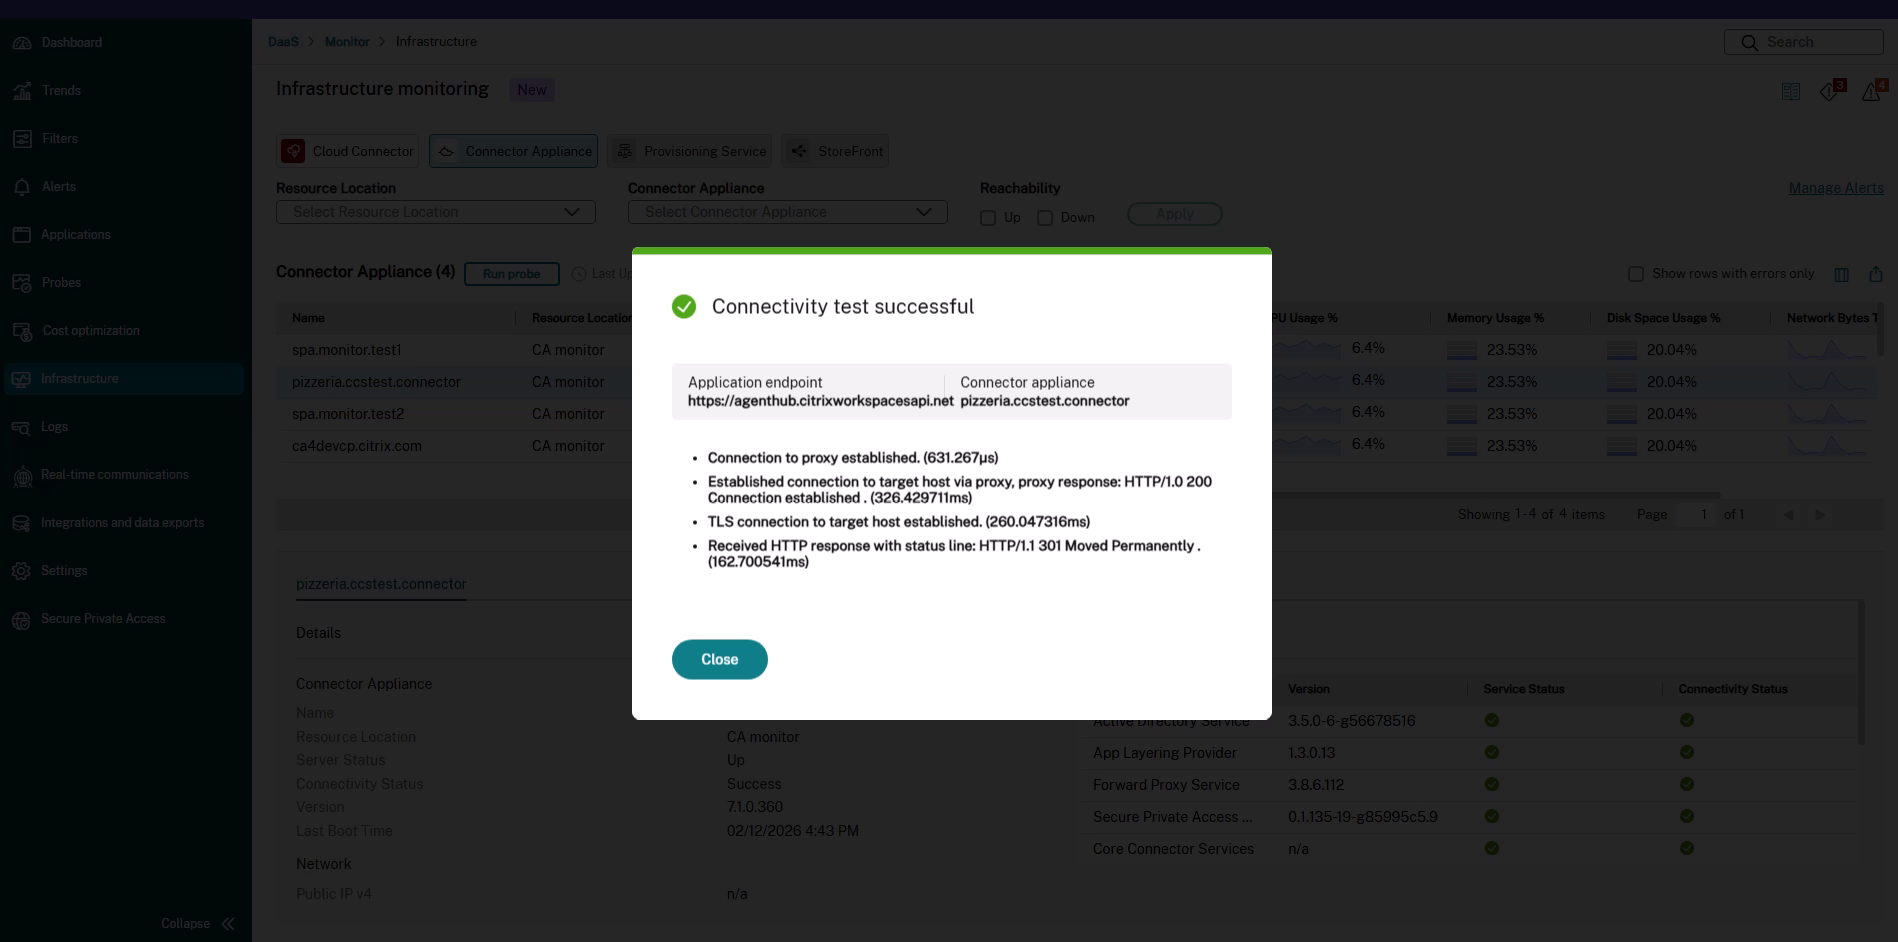
After the probe completes, Monitor shows the result for each connection stage along with the time taken. The dialog also shows the Application endpoint that was tested and the Connector Appliance that ran the probe.
Successful probe
If every stage succeeds, the dialog shows Connectivity test successful and lists each completed stage—for example:
- DNS resolved successfully.
- Connection to target host established.
- TLS connection to target host established.
- Received HTTP response with status line:
HTTP/1.1 301 Moved Permanently.
Note:
The stages shown depend on the protocol. For example, the TLS stage appears only for SSL/TLS and HTTPS probes, and the HTTP request or response stage appears only for HTTP and HTTPS probes.
Probe through a proxy
When you run the probe through a proxy, the result includes the proxy connection stages before the target host stages—for example, Connection to proxy established and Established connection to target host via proxy.
Failed probe
If a stage fails, the result identifies the stage that failed and shows the associated error detail (for example, a TCP connection error such as Connection refused). Because the probe runs from the selected Connector Appliance, the failed stage tells you where the path breaks:
- DNS resolution fails – The Connector Appliance can’t resolve the host name. Check DNS configuration and the host name or URL you entered.
- TCP connection fails – The host is unreachable or the port is closed or blocked. Check the target host, port, firewall rules, and that the backend service is running.
- TLS handshake fails – The TCP connection succeeds but the TLS negotiation fails. Check the certificate, the TLS version, and the SNI or host name.
- HTTP request fails – The connection succeeds but the application returns an error or doesn’t respond. Check the application and the URL path.
Considerations
- A probe is an on-demand, point-in-time connectivity test. It does not provide continuous monitoring.
- The probe runs from the data path of the selected Connector Appliance, so the result reflects that Connector Appliance’s view of the network.
- A probe is expected to complete within about two minutes.
- Collecting a packet trace from the Connector Appliance is not supported from Monitor. If a packet trace is required, the network administrator must collect it from the Connector Appliance console.