-
Integration with Google Chrome Enterprise Premium
-
Apps configuration and management
-
Citrix Enterprise Browser to Chrome Enterprise Premium migration
This content has been machine translated dynamically.
Dieser Inhalt ist eine maschinelle Übersetzung, die dynamisch erstellt wurde. (Haftungsausschluss)
Cet article a été traduit automatiquement de manière dynamique. (Clause de non responsabilité)
Este artículo lo ha traducido una máquina de forma dinámica. (Aviso legal)
此内容已经过机器动态翻译。 放弃
このコンテンツは動的に機械翻訳されています。免責事項
이 콘텐츠는 동적으로 기계 번역되었습니다. 책임 부인
Este texto foi traduzido automaticamente. (Aviso legal)
Questo contenuto è stato tradotto dinamicamente con traduzione automatica.(Esclusione di responsabilità))
This article has been machine translated.
Dieser Artikel wurde maschinell übersetzt. (Haftungsausschluss)
Ce article a été traduit automatiquement. (Clause de non responsabilité)
Este artículo ha sido traducido automáticamente. (Aviso legal)
この記事は機械翻訳されています.免責事項
이 기사는 기계 번역되었습니다.책임 부인
Este artigo foi traduzido automaticamente.(Aviso legal)
这篇文章已经过机器翻译.放弃
Questo articolo è stato tradotto automaticamente.(Esclusione di responsabilità))
Translation failed!
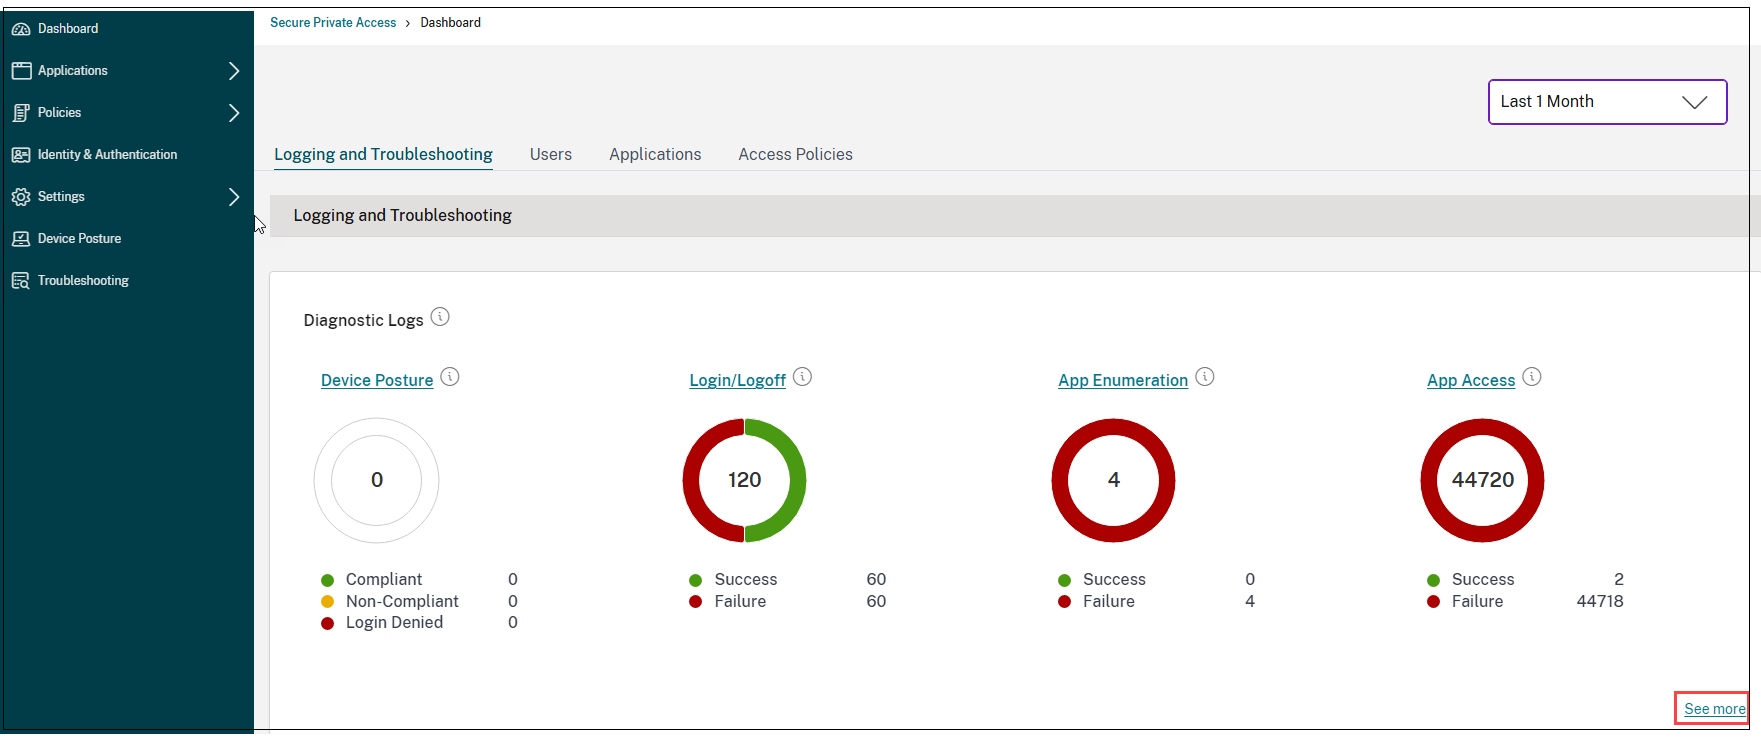
Diagnostic logs
The Secure Private Access service dashboard displays the diagnostics and usage data of the SaaS, Web, TCP, and UDP apps. Use the Diagnostics Logs chart to view the logs related to authentication, application launch, app enumeration, and also logs related to device posture. You can click the See more link to view the details of the logs. The details are presented in a tabular format. You can view the logs for the pre-set time or for a custom timeline. You can add columns to the chart by clicking the + sign depending on what information you want to see in the dashboard. You can export the user logs into CSV format.
-
You can use the Add Filter option to refine you search based on the various criteria such as app type, category, description. For example, in the search field, you can click
Transaction ID,= (equals to some value), and enter7456c0fb-a60d-4bb9-a2a2-edab8340bb15, to search for all logs related to this transaction ID. For details on search operators that can be used with the filter option, see Search operators. -
Device posture logs: You can refine your search based on the policy results (Compliant, Non-compliant, and login Denied). For details on device posture, see Device Posture.
Note:
- Every failure event within the Secure Private Access diagnostic logs dashboard has an associated info code. For details, see Info code.
- Transaction ID correlates all Secure Private Access logs for an access request. For details, see Transaction ID.
Note:
- By default, the Diagnostic Logs page displays the current week’s data and only the recent 10000 records. Use the custom date search and filters to refine your search results further.
Share
Share
In this article
This Preview product documentation is Citrix Confidential.
You agree to hold this documentation confidential pursuant to the terms of your Citrix Beta/Tech Preview Agreement.
The development, release and timing of any features or functionality described in the Preview documentation remains at our sole discretion and are subject to change without notice or consultation.
The documentation is for informational purposes only and is not a commitment, promise or legal obligation to deliver any material, code or functionality and should not be relied upon in making Citrix product purchase decisions.
If you do not agree, select I DO NOT AGREE to exit.