Secure Private Access usage dashboard
The Secure Private Access service dashboard displays the diagnostics and usage data of the SaaS, Web, TCP, and UDP apps. The dashboard provides admins full visibility into their apps, users, connectors health status, and bandwidth usage in a single place for consumption. This data is fetched from Citrix Analytics. The data for the various entities can be viewed for the preset time or for a custom timeline. For some of the entities, you can drilldown to view further details.
The metrics are broadly classified into the following categories.
-
Logging and Troubleshooting
- Diagnostic logs: Logs related to authentication, application launch, app enumeration, and device posture checks.
-
Users
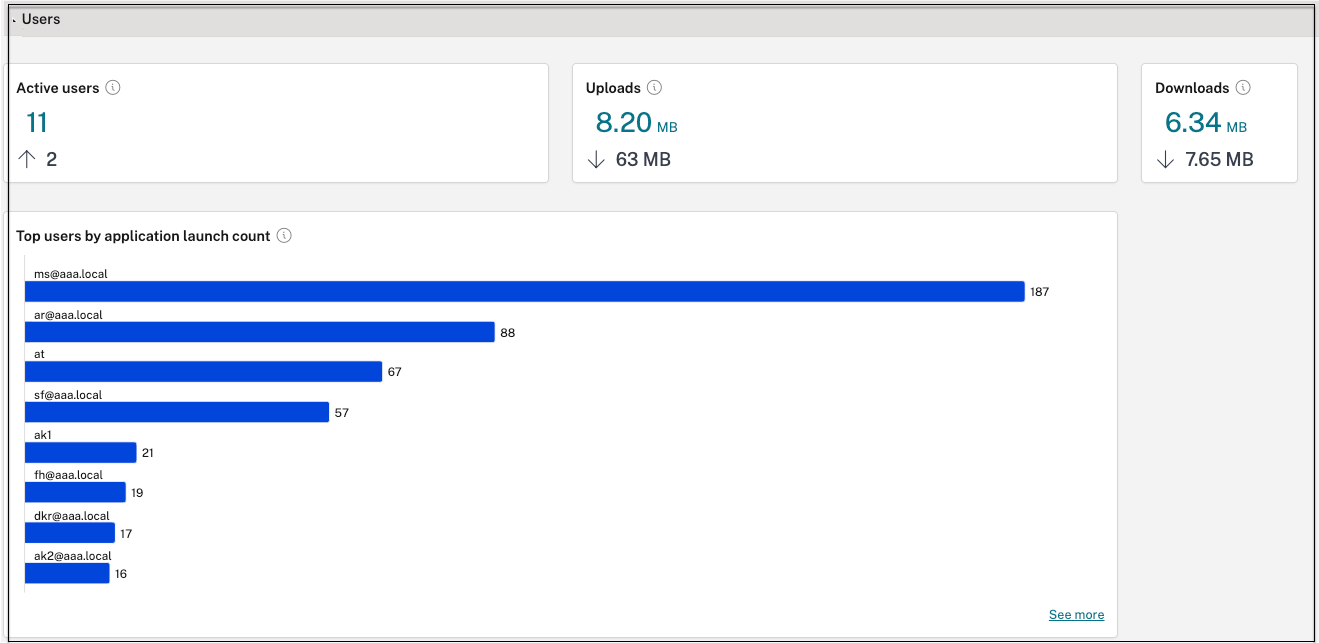
- Active users: Total number of unique users accessing the applications (SaaS, Web, and TCP) for the selected time interval.
- Uploads: Total volume data uploaded through the Secure Private Access service for the selected time interval.
- Downloads: Total volume of data downloaded through the Secure Private Access service for the selected time interval.
-
Applications:
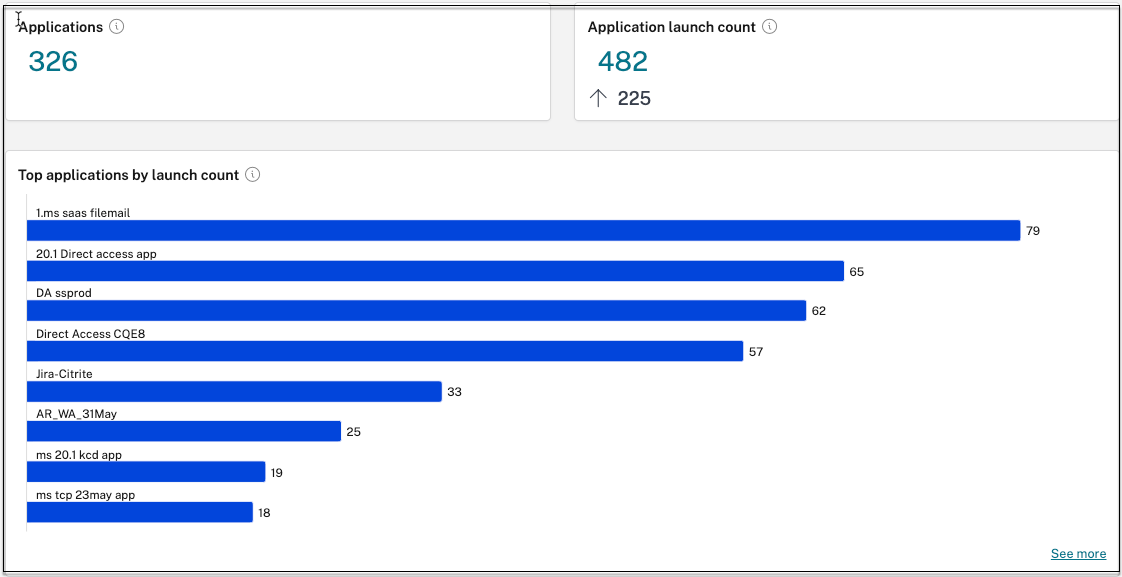
- Applications: Total number of applications (independent of the time interval) configured currently.
- Application launch count: Total number of applications (app sessions) launched by each user for the selected time interval.
- Domains configured: Total number of domains configured for the selected time interval.
- Applications discovered: Total number of unique, individual domains that have been accessed but are not associated with any apps
-
Access policies
- Access policies: Total number of access policies (independent of the time interval) configured currently.
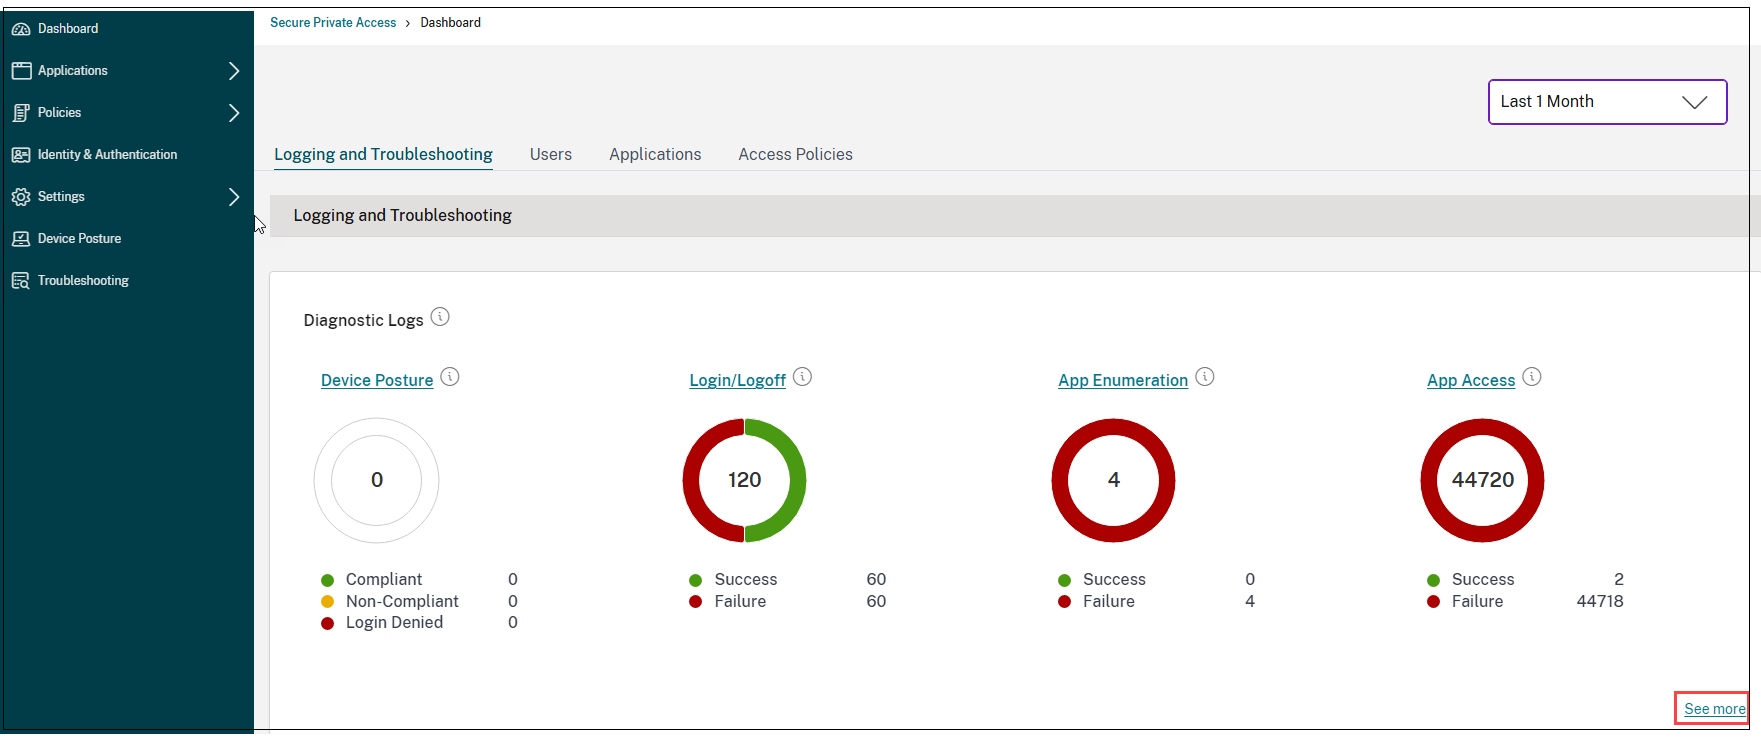
Diagnostic logs
Use the Diagnostics Logs chart to view the logs related to authentication, application launch, app enumeration, and also logs related to device posture. You can click the See more link to view the details of the logs. The details are presented in a tabular format. You can view the logs for the pre-set time or for a custom timeline. You can add columns to the chart by clicking the + sign depending on what information you want to see in the dashboard. You can export the user logs into CSV format.
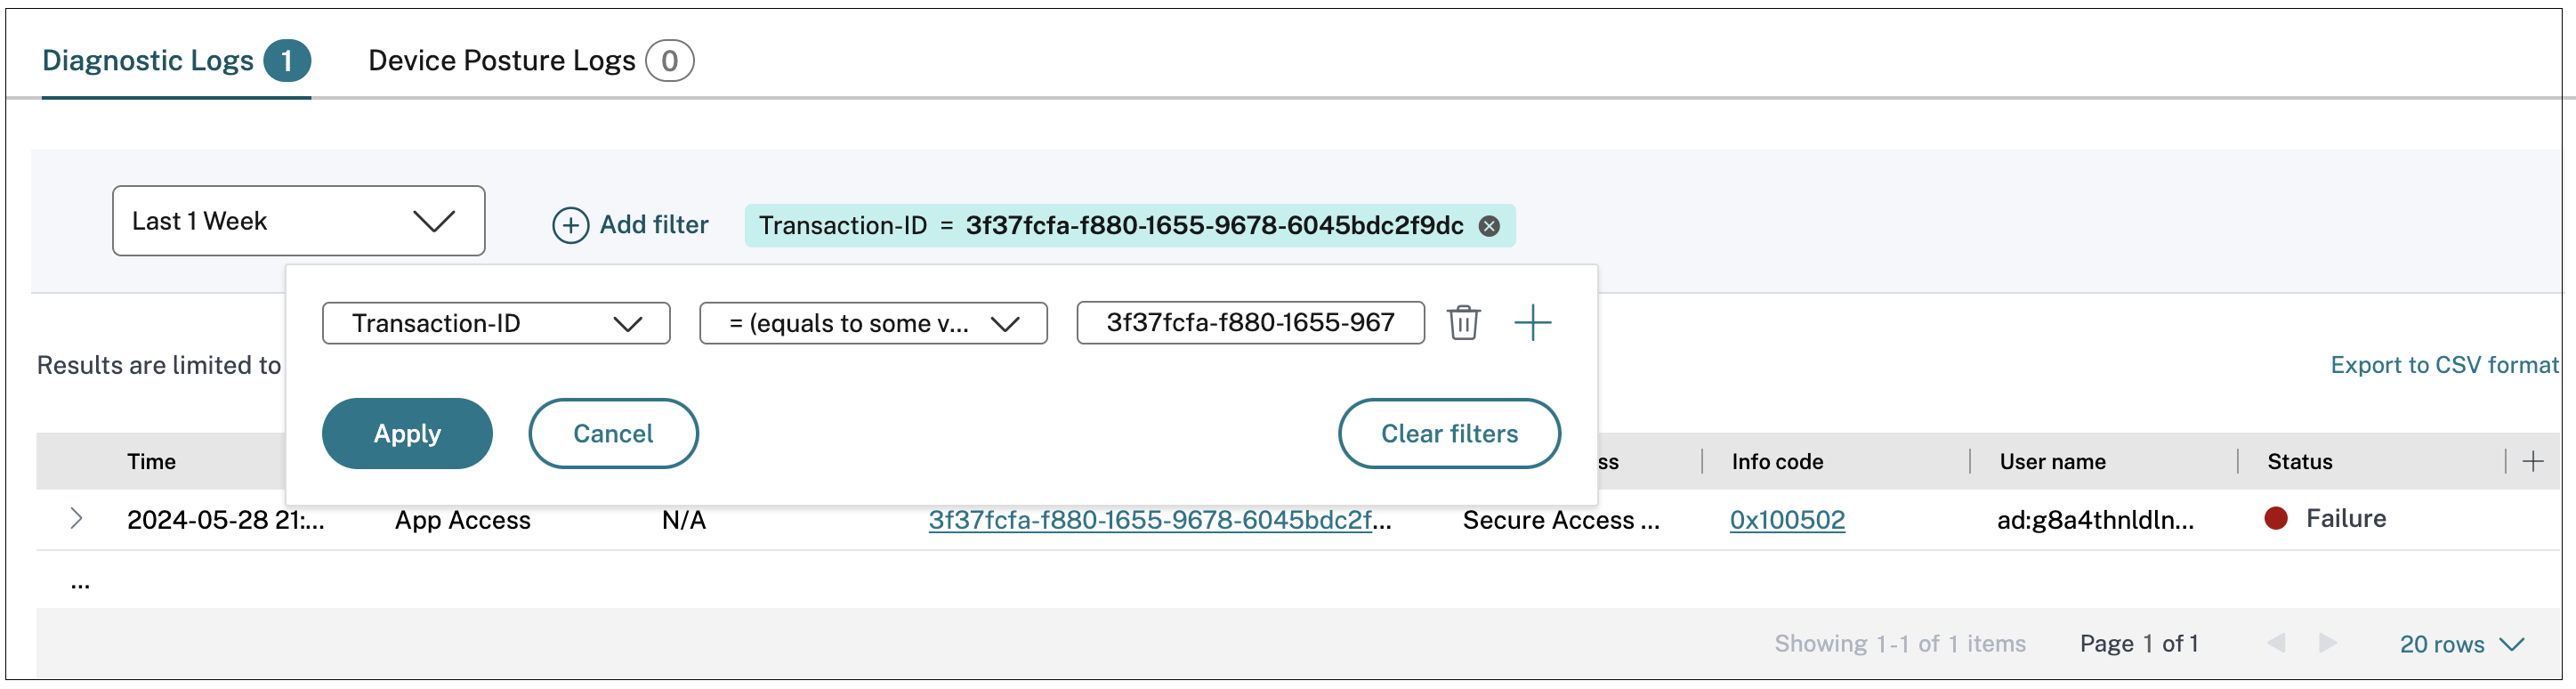
- You can use the Add Filter option to refine you search based on the various criteria such as app type, category, description. For example, in the search fields, you can select
Transaction ID,= (equals to some value), and enter7456c0fb-a60d-4bb9-a2a2-edab8340bb15in this sequence, to search for all logs related to this transaction ID. For details on search operators that can be used with the filter option, see Search operators.
- Device posture logs: You can refine your search based on the policy results (Compliant, Non-compliant, and login Denied). For details on device posture, see Device Posture.
Note:
- Every failure event within the Secure Private Access diagnostic logs dashboard has an associated info code. For details, see Info code.
- Transaction ID correlates all Secure Private Access logs for an access request. For details, see Transaction ID.
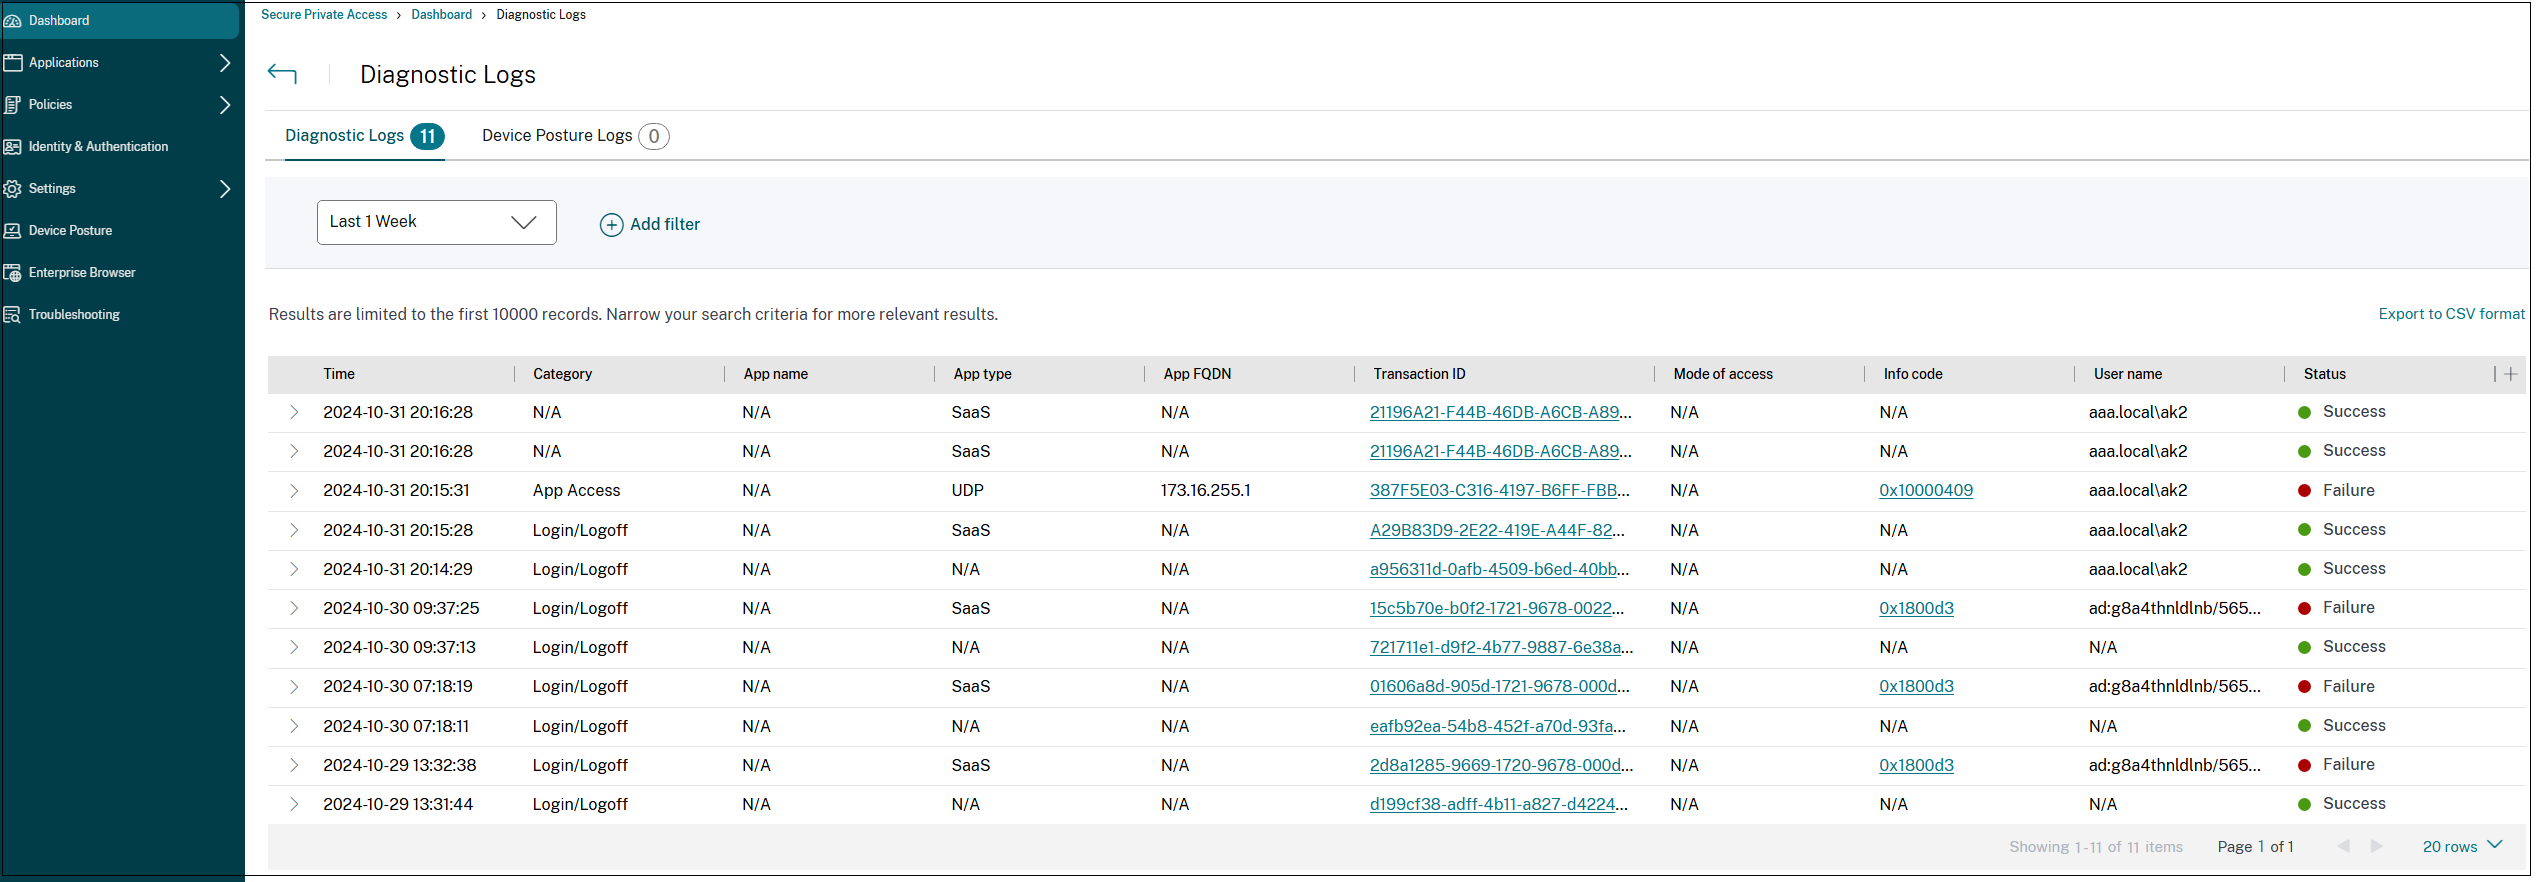
- You can click the expand icon (>) to view the complete details of the logs.
- The Diagnostic Logs page displays the embedded domains for each of the main URLs that are accessed. Admins can view the embedded domains by clicking the expand icon (>) from the main URL. Admins can use the embedded domains list to address issues related to app access or app rendering. For example, if a domain was missed in the application configuration, then the specific app cannot be accessed by the end user. In this case, the admin can view the list of embedded domains, identify the missing domain, and then update the app configuration with the missing domain.
By default, the Diagnostic Logs page displays the current week’s data and only the recent 10000 records. Use the custom date search and filters to refine your search results further.
Important:
For a comprehensive list of errors that users might encounter when using the Secure Private Access service, see Info code lookup table.
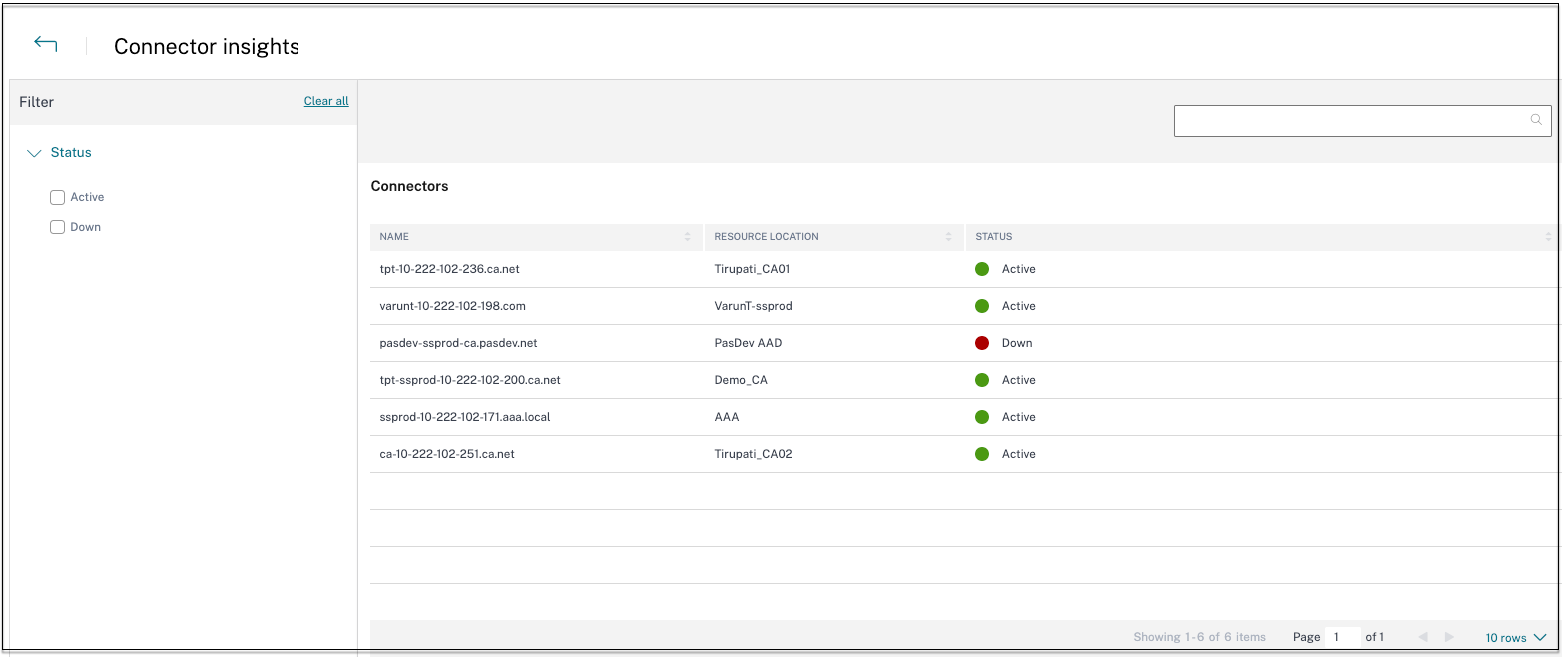
Connector status
Use the Connector status chart to view the status of the connectors and the resource locations where the connectors are deployed. Click the See more link to view the details. In the Connector insights page, you can use the filters Active or Inactive to filter the connectors based on their status.
Top applications by launch count
Use the Top applications by launch count chart to view the list of top applications based on the number of the times the app was launched, the total volume of data uploaded to the app server, and the total volume of data downloaded from the app server. You can apply the filters SaaS Apps, Web Apps, or TCP/UDP Apps to narrow down your search to specific apps. You can filter the data for a pre-set timeline or for a custom timeline.
Top users by applications launch count
Use the Top users by applications launch count chart to view the data per user. For example, the number of times a user has launched the TCP app, the total volume of data uploaded to the app server, and the total volume of data downloaded from the app server. You can filter the data for a pre-set timeline or for a custom timeline.
Top access policies by enforcement
Use the Top access policies by enforcement chart to view the list of access policies that are enforced on the apps. Click the See more link to view the list of policies that are associated with the apps and the number of times the policies are enforced. You can also use the Search option in the Access policies page to filter the policies based on the policy name. You can also search for specific policies using the search operators to further refine your search. For details, see Search operators.
Top discovered applications
Use the Top discovered applications by total visits to view the list of unique, individual domains that have been accessed at some point but are not associated with any apps. These domains are listed based on the number of total visits to those domains. Admins can use this chart to see if any domain of particular interest is accessed by many users. In such cases, admins can create an app with that domain for easy accessibility.
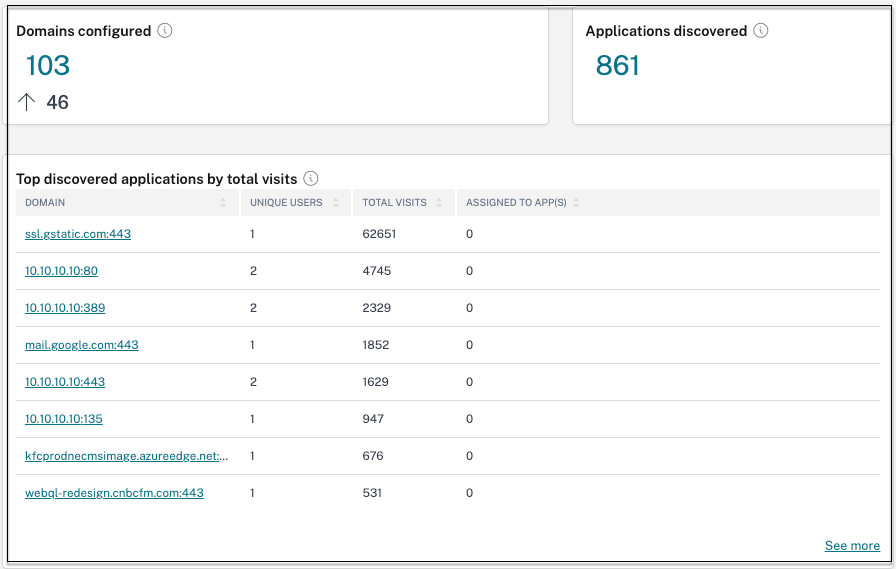
In the chart, the ASSIGNED TO APPs column displays the total number of applications that have this domain configured as a part of their related URL or Destination URL values. Clicking the number displays the apps that are assigned to this domain.
You can click the See more link to view more details about all the domains.
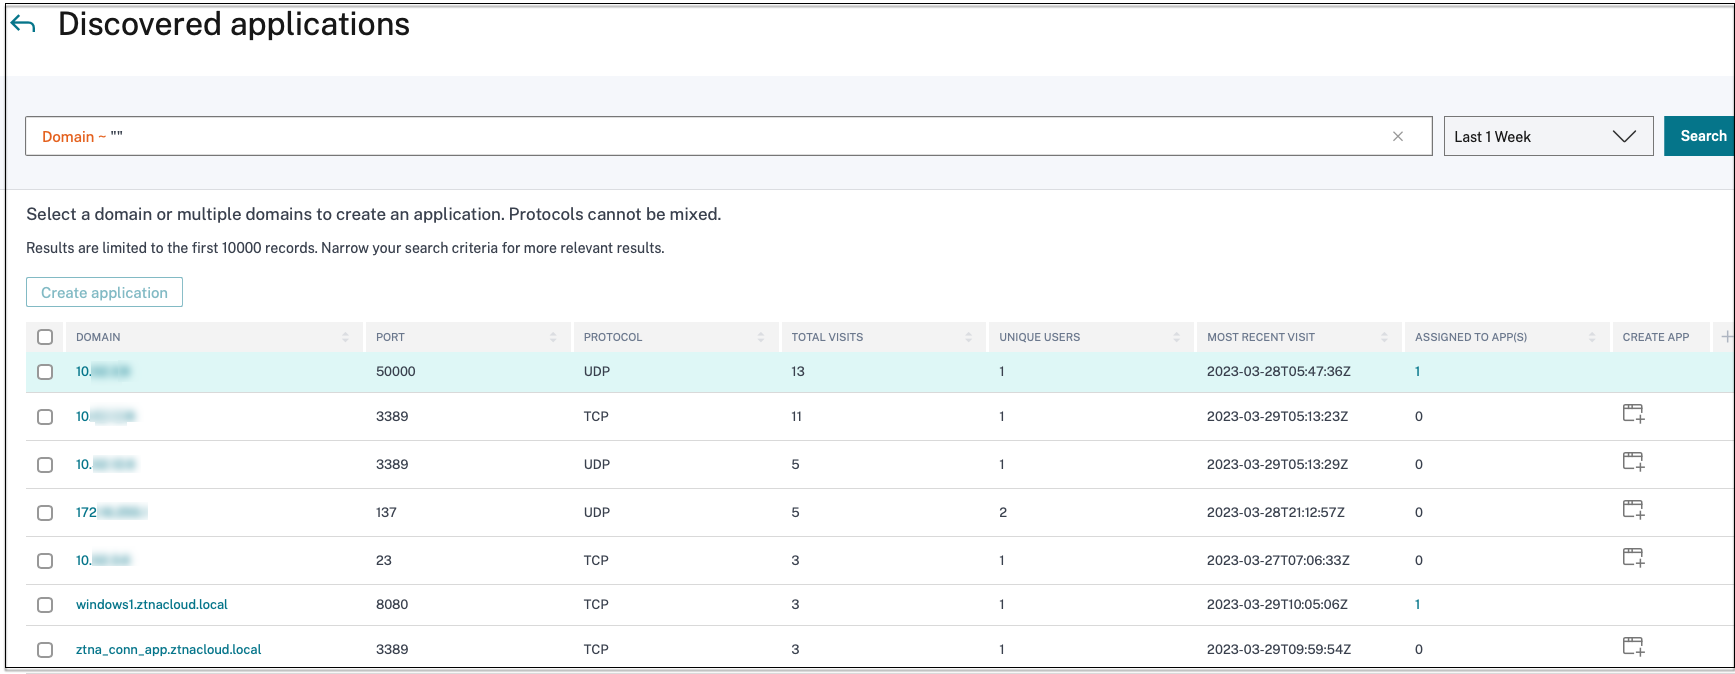
The Discovered applications page displays the details of the domains such as domain name, port, protocol, total visits, unique users, and the most recent visit date. All the columns in the chart are sortable. You can use the search bar to search based on domain.
Note:
- The protocols are derived based on the standard ports used by customers.
- The list of discovered domains is limited to 10000 records.
Creating an app from the chart
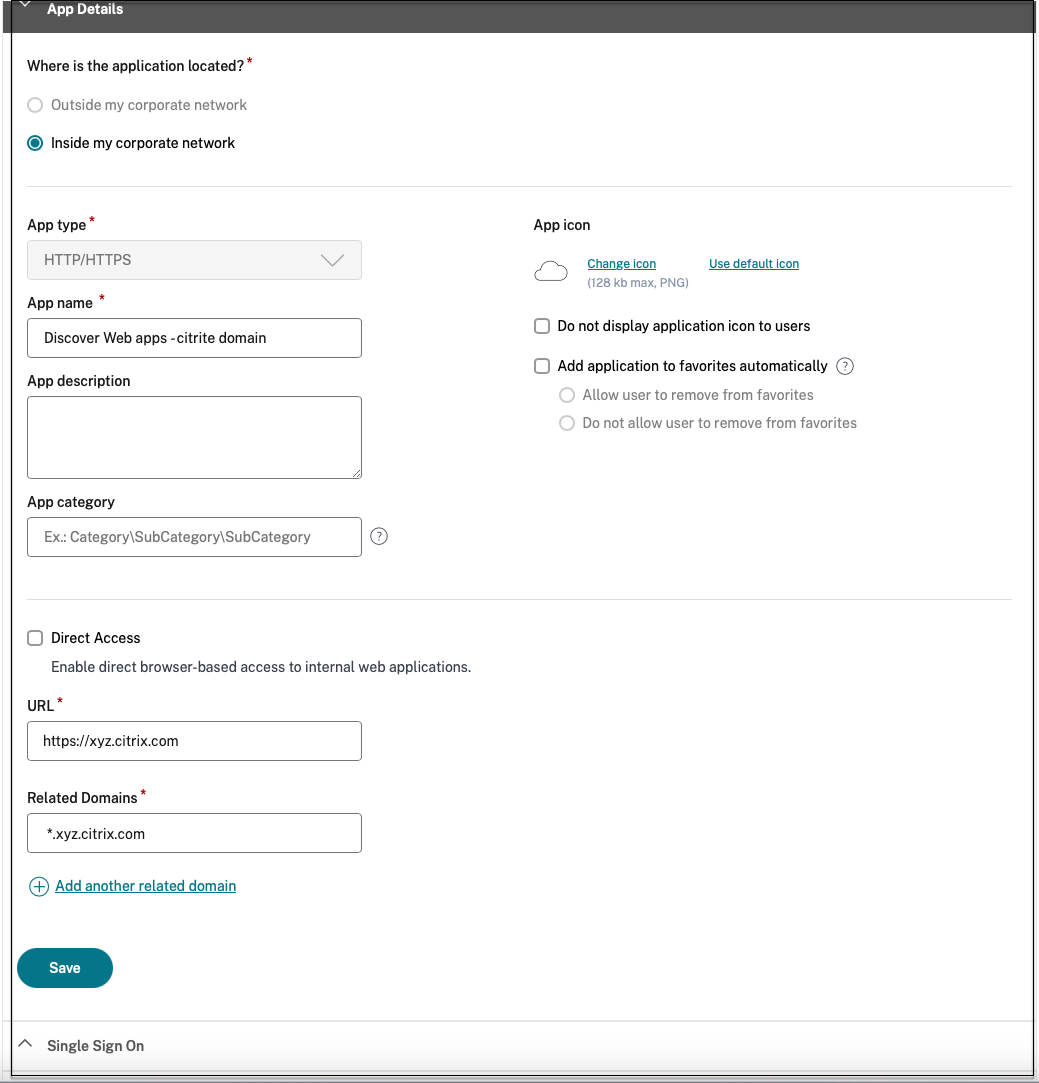
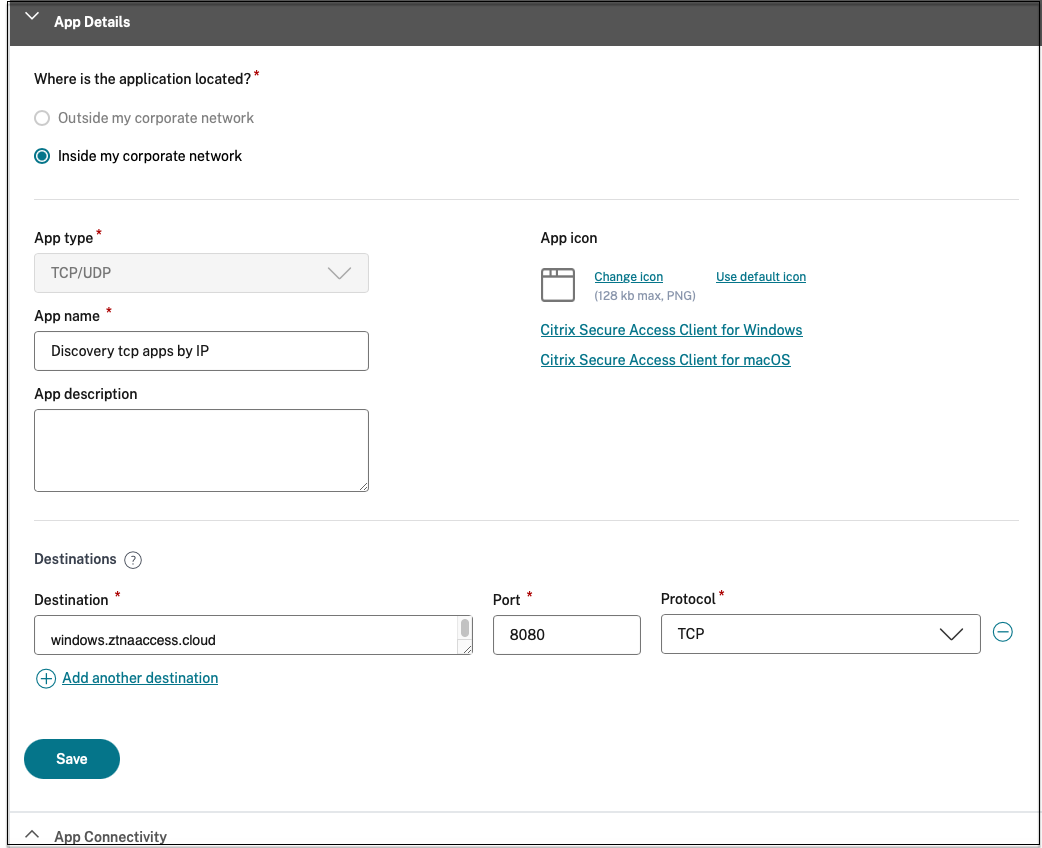
Click the + icon in line with the respective domain to create an app. The app configuration wizard pops up. The create app icon does not appear for the rows in which an app is already created with the same domain, port, and protocol combination, and is in complete state.
- The app type is auto populated based on the app’s protocol that you have selected. However, you can change the type, if necessary.
- The values in the URL, Related Domains, Destination, Port, Protocol fields are all auto-populated. Complete the steps for adding an app. For details, see Admin-guided workflow for easy onboarding and set up.
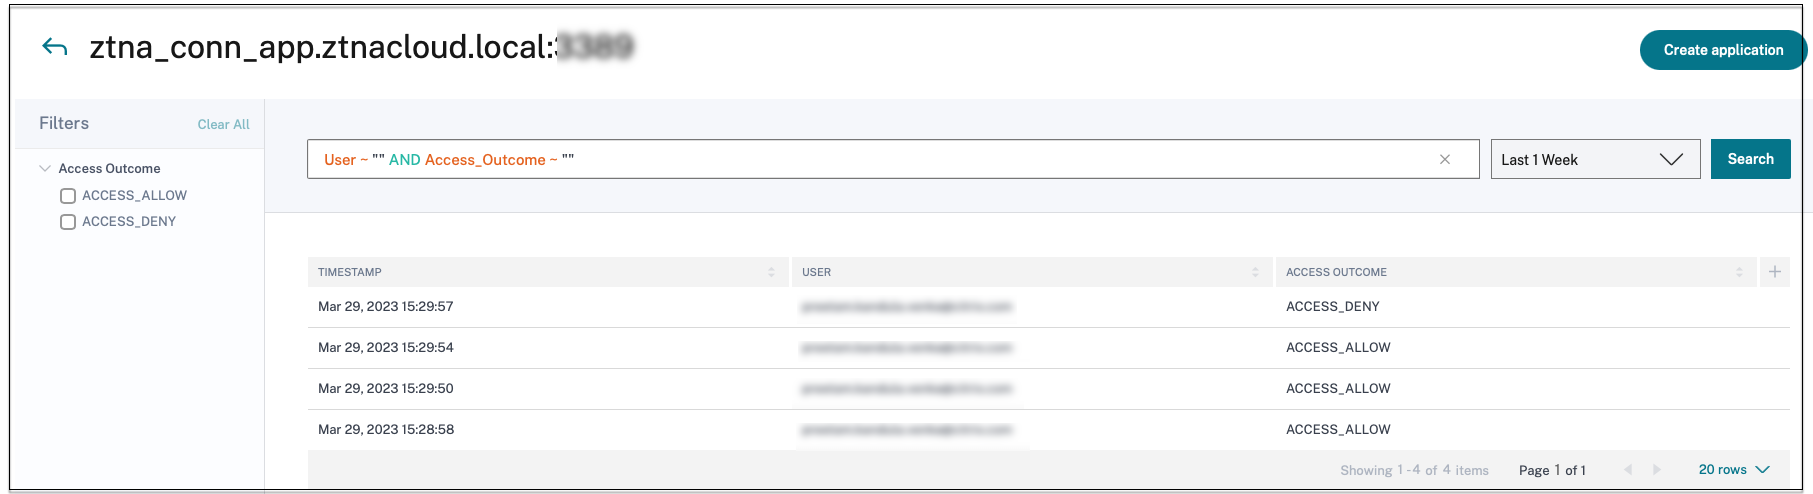
You can also click the unique domain link to see more details and create an application for that domain. When you click a domain link, the user authentication logs for the domain are displayed. Click the Create application button. Complete the steps for adding an app.
Search operators
The following are the search operators that you can use to refine your search:
- = (equals to some value): To search for the logs/policies that exactly match the search criteria.
- != (not equal some value): To search for the logs/policies that do not contain the specified criteria.
- ~ (contains some value): To search for the logs/policies that match the search criteria partially.
- !~ (does not contain some value): To search for the logs/policies that do not contain some of the specified criteria.