Alerts and notifications
Alerts are displayed in Monitor on the dashboard and other high level views with warning and critical alert symbols. Alerts update automatically every minute; you can also update alerts on demand.
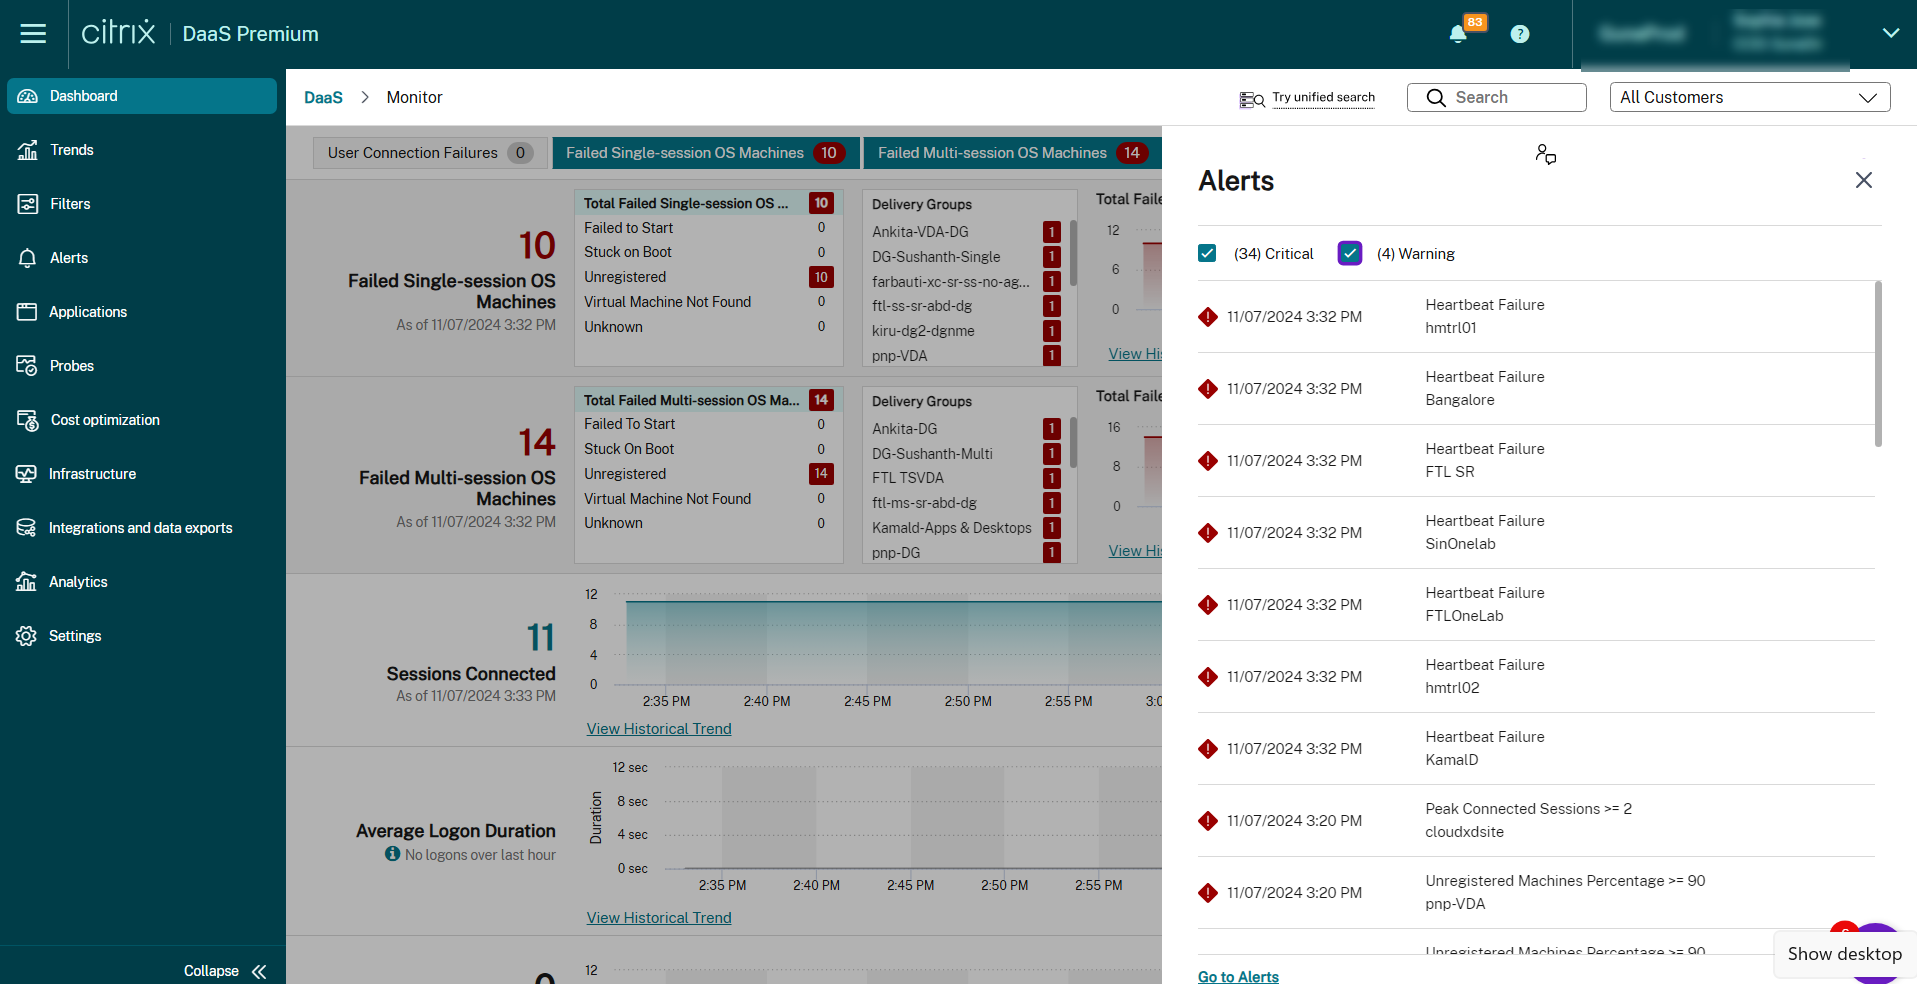
A warning alert (amber triangle) indicates that the warning threshold of a condition has been reached or exceeded.
A critical alert (red circle) shows that the critical threshold of a condition has been reached or exceeded.
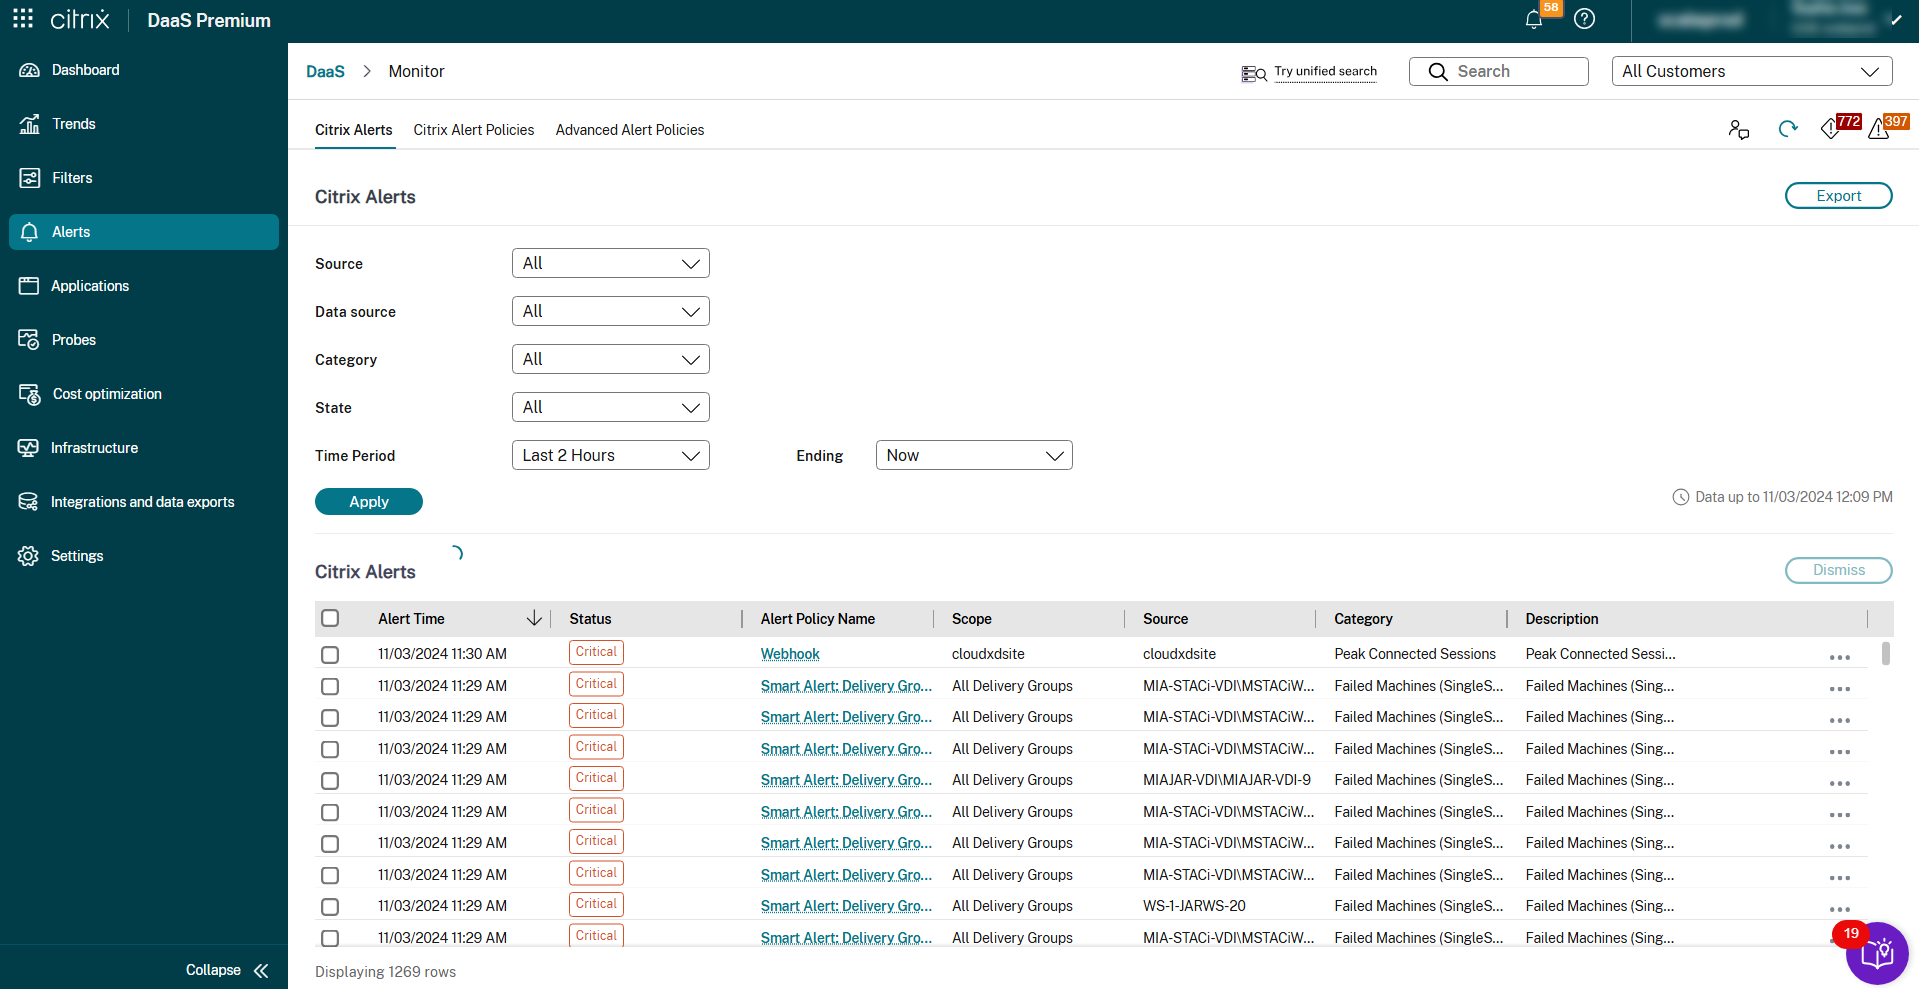
You can view more detailed information on alerts by selecting an alert from the sidebar, clicking the Go to Alerts link at the bottom of the sidebar or by selecting Alerts from the top of the Monitor page.
In the Alerts view, you can filter and export alerts. For example, Failed Multi-session OS machines for a specific delivery group over the last month, or all alerts for a specific user. For more information, see Export reports.
Citrix® alerts
Citrix alerts are the ones that originate from Citrix components. You can configure Citrix alerts within Monitor in Alerts > Citrix Alerts Policy. As part of the configuration, you can set notifications to be sent by email to individuals and groups when alerts exceed the thresholds you have set up. For more information on setting up Citrix Alerts, see Create alerts policies.
Smart alert policies
A set of built-in alert policies with predefined threshold values are available for delivery groups and Multi-session OS VDAs’ scope. You can modify the threshold parameters of the built-in alert policies in Alerts > Citrix Alerts Policy. These policies are created when there is at least one alert target -a delivery group or a Multi-session OS VDA defined in your site. Also, these built-in alerts are automatically added to a new delivery group or a Multi-session OS VDA.
Built-in alert policies are created only if no corresponding alert rules exist in the Monitor database.
For the threshold values of the built-in alert policies, see the Alerts policies conditions section.
Advanced alert policies
The Proactive Notification and Alerting feature of the Monitor is enhanced to include a new alerting framework named Advanced Alert Policies. With this feature, you can create alerts by including granular details for each element or condition, thereby enhancing the control over the alerts scope. Currently, these policies include alerts for cost savings and infrastructure.
With the introduction of Advanced alert policies, which is a data source-driven alert you can use multi-condition scope filtering.
This feature helps you to reduce excessive alerts which might lead to reduced responsiveness or effectiveness in addressing important issues. This policy helps to measure effectiveness of alert policies and engagement from admins.
You can create an Advanced alert policy from the Alerts > Advanced alert policy > Create Policy section. You can select one of the following Data sources:
- Machines
- Provisioning Service
- StoreFront™
Alerts for cost savings
You can create alerts for cost savings which helps you to optimize cost. Currently, you can create alerts for machines.
To create alerts on Machines, do the following:
- Click Alerts tab > Advanced Alert Policies. The Advanced Alert Policies page appears.
- Click Create Policy. The Create Advanced Alert Policies section appears.
- Select Machines from the Data source drop-down list. The Cost savings condition and corresponding condition types are displayed.
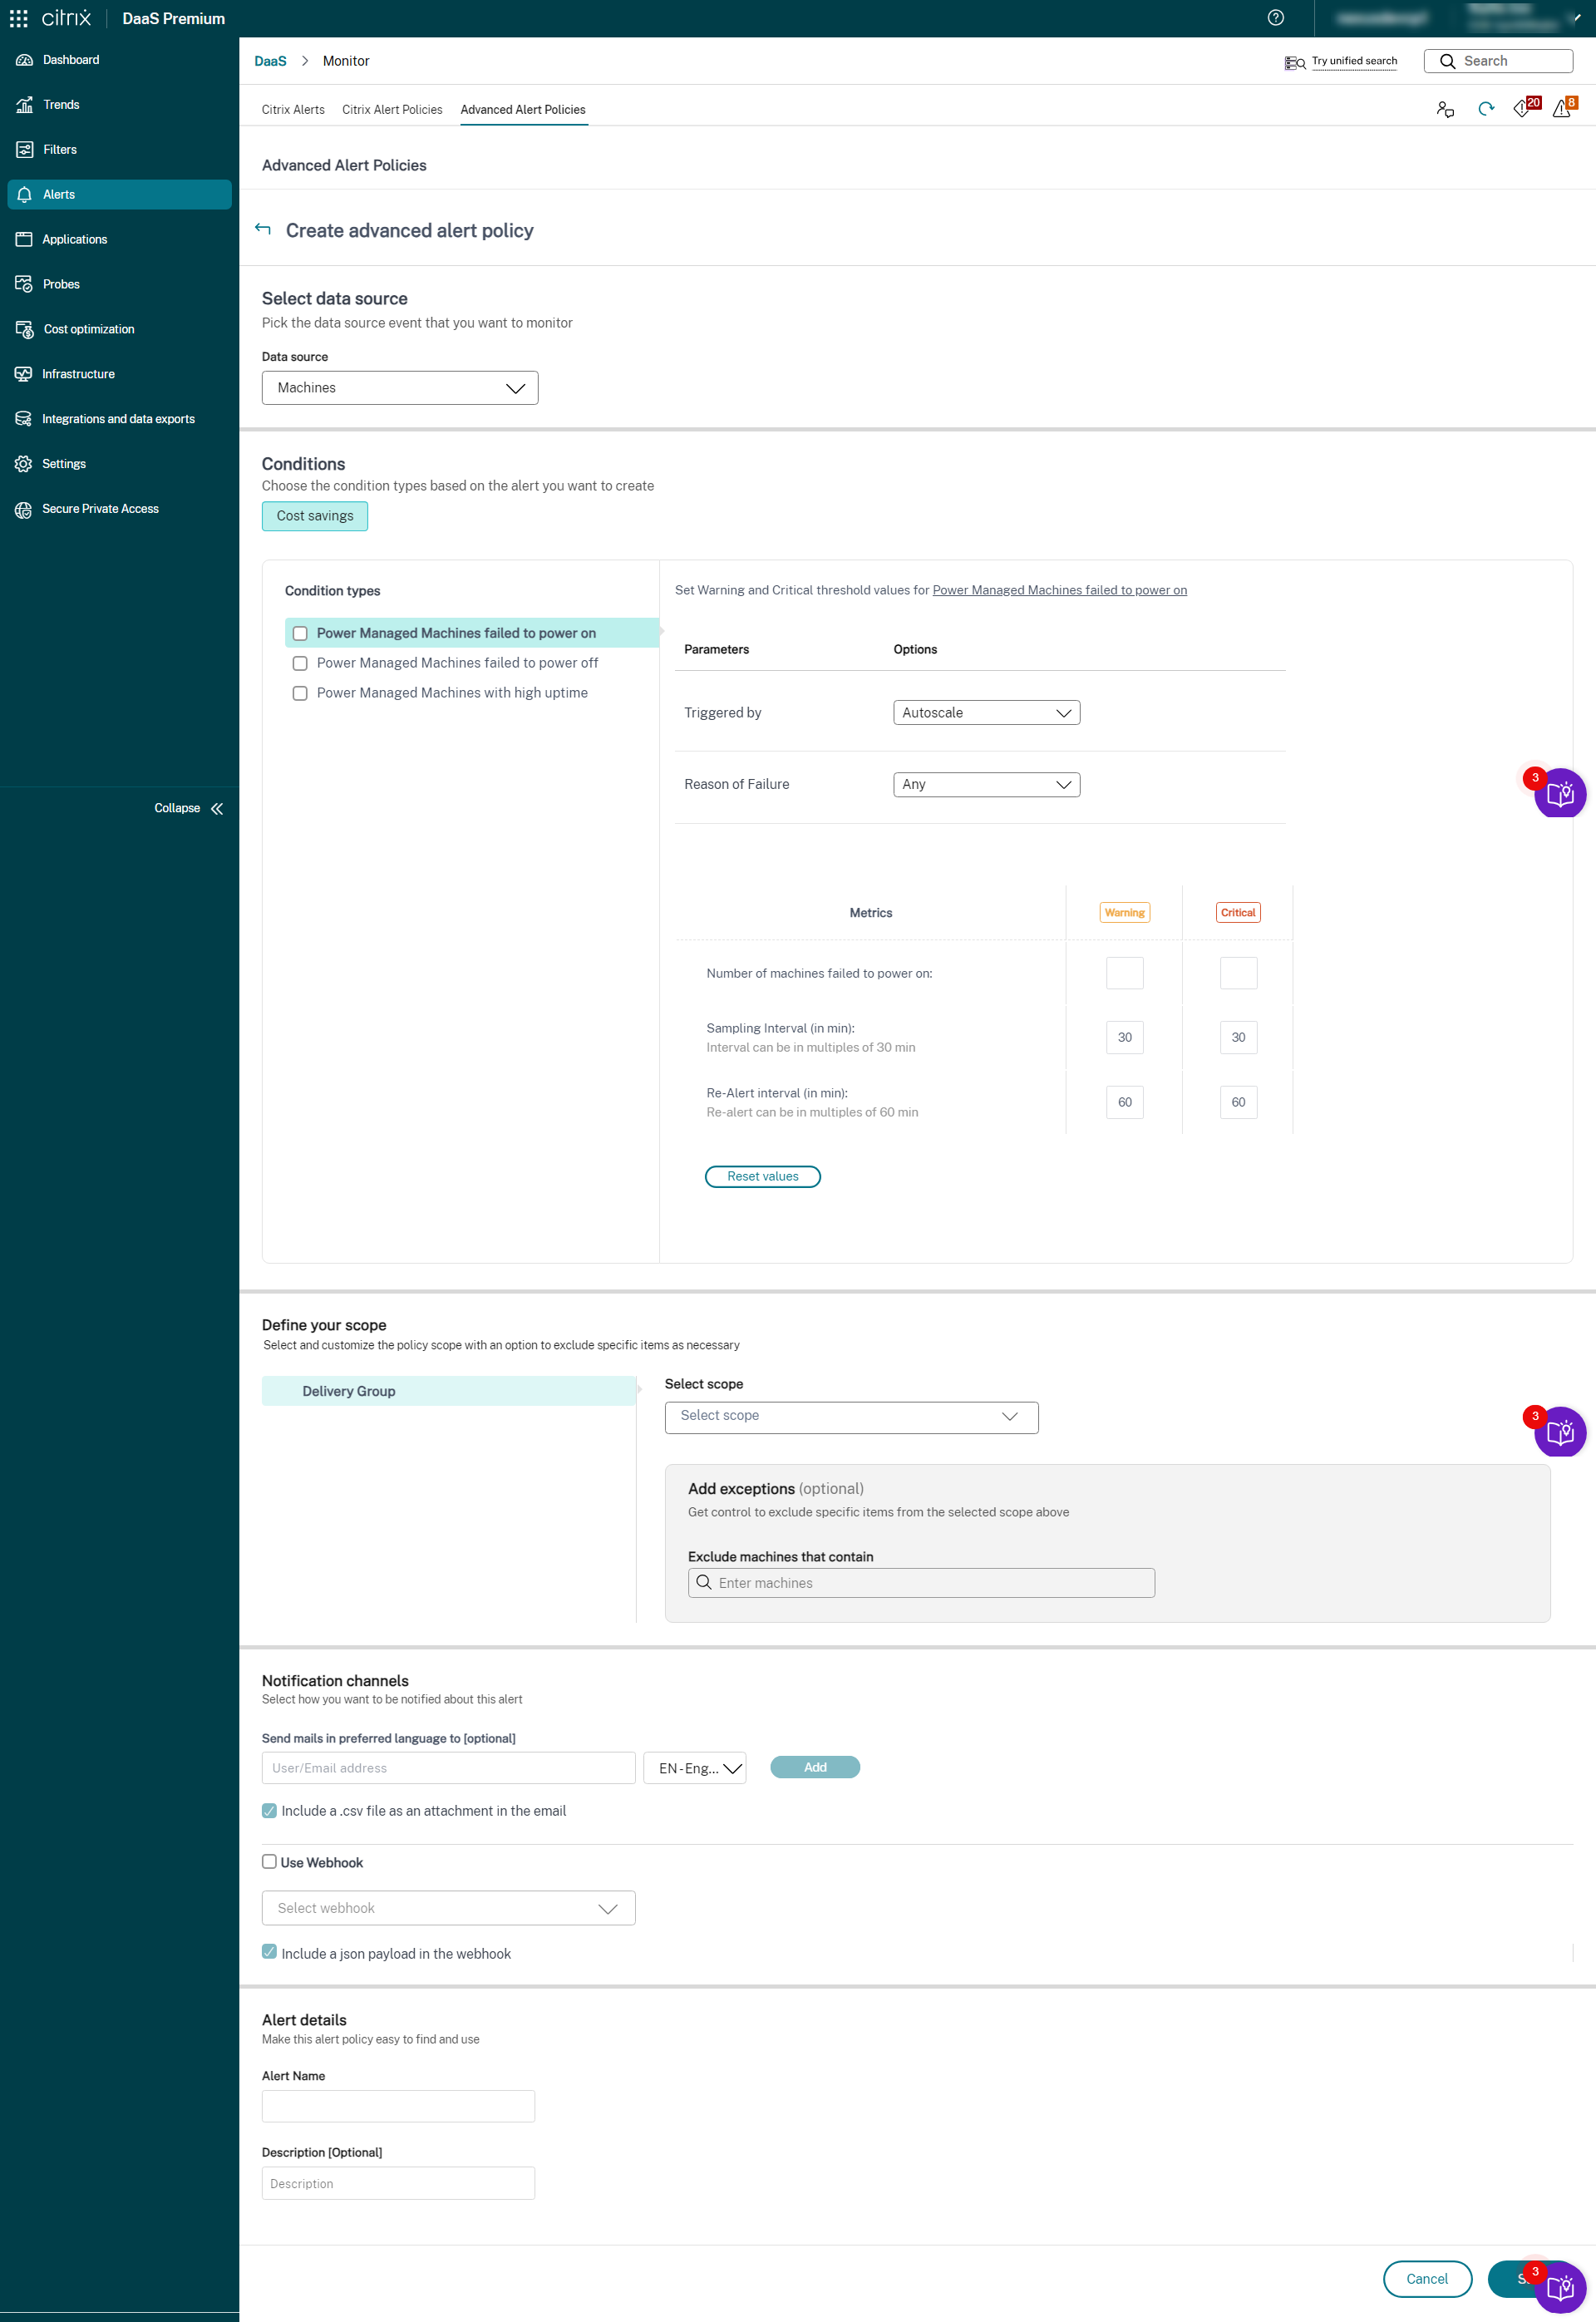
-
Select the following condition types as required:
- Power Managed Machines failed to power on
- Power Managed Machines failed to power off
- Power Managed Machines with high uptime
- Select the specific parameters and the corresponding options for each of the selected conditions.
-
Set the Warning and Critical metrics for the selected condition type:
-
For Power Managed Machines with high uptime:
- Number of machines crossing uptime threshold
- Re-alert interval (in min) interval can be minimum 60 min
-
For Power Managed Machines failed to power on and Power Managed Machines failed to power off:
- Number of machines crossing uptime threshold
- Sampling interval (in min) intervals can be multiples of 30 min
- Re-alert interval (in min) re-alert can be multiples of 60 min
-
- Schedule re-alert intervals for the selected alerts as needed.
- Define the scope of the alert.
-
Set the notification channels. This can be email or Webhook.
-
You can select the following checkboxes:
- Include a JSON payload as an attachment in the webhook
- Include a CSV file as an attachment in the email
-
- Enter the Alert details such as Alert Name and Description (optional).
- Click Save. The alert is created.
Alerts for SPA Connection Latency
The Advanced Alert Policies framework supports proactive alerting for Secure Private Access (SPA) connectivity. Use this policy to detect and act on end-to-end latency affecting SPA user connections.
Configure SPA Connection Latency alert
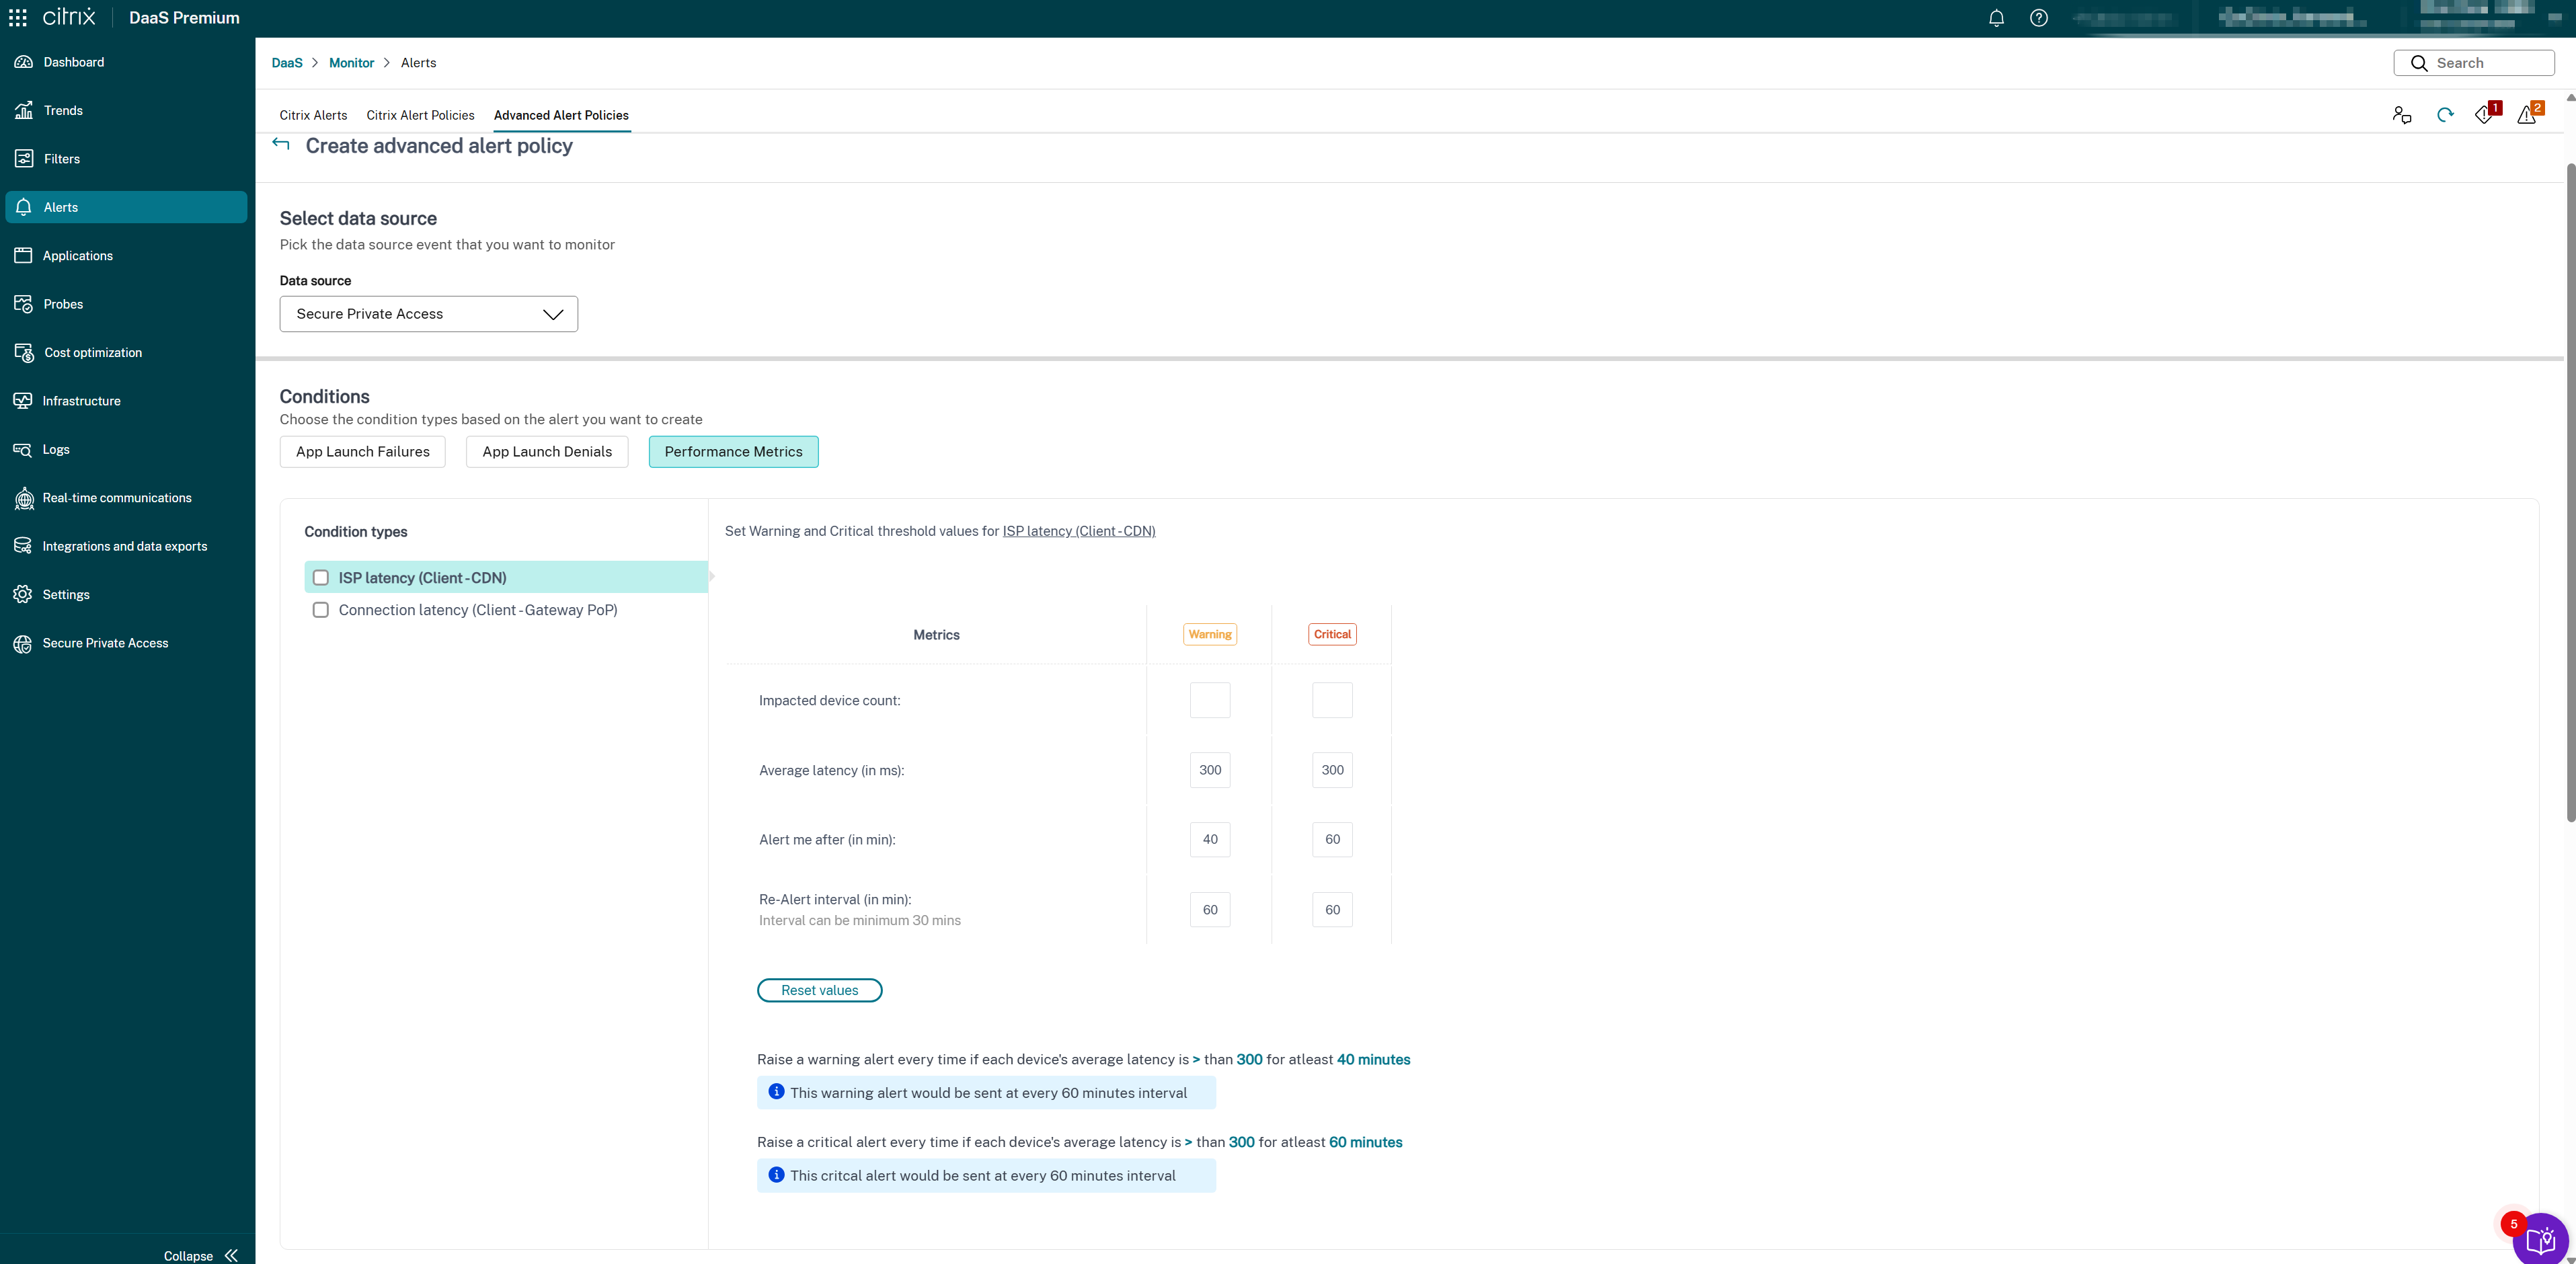
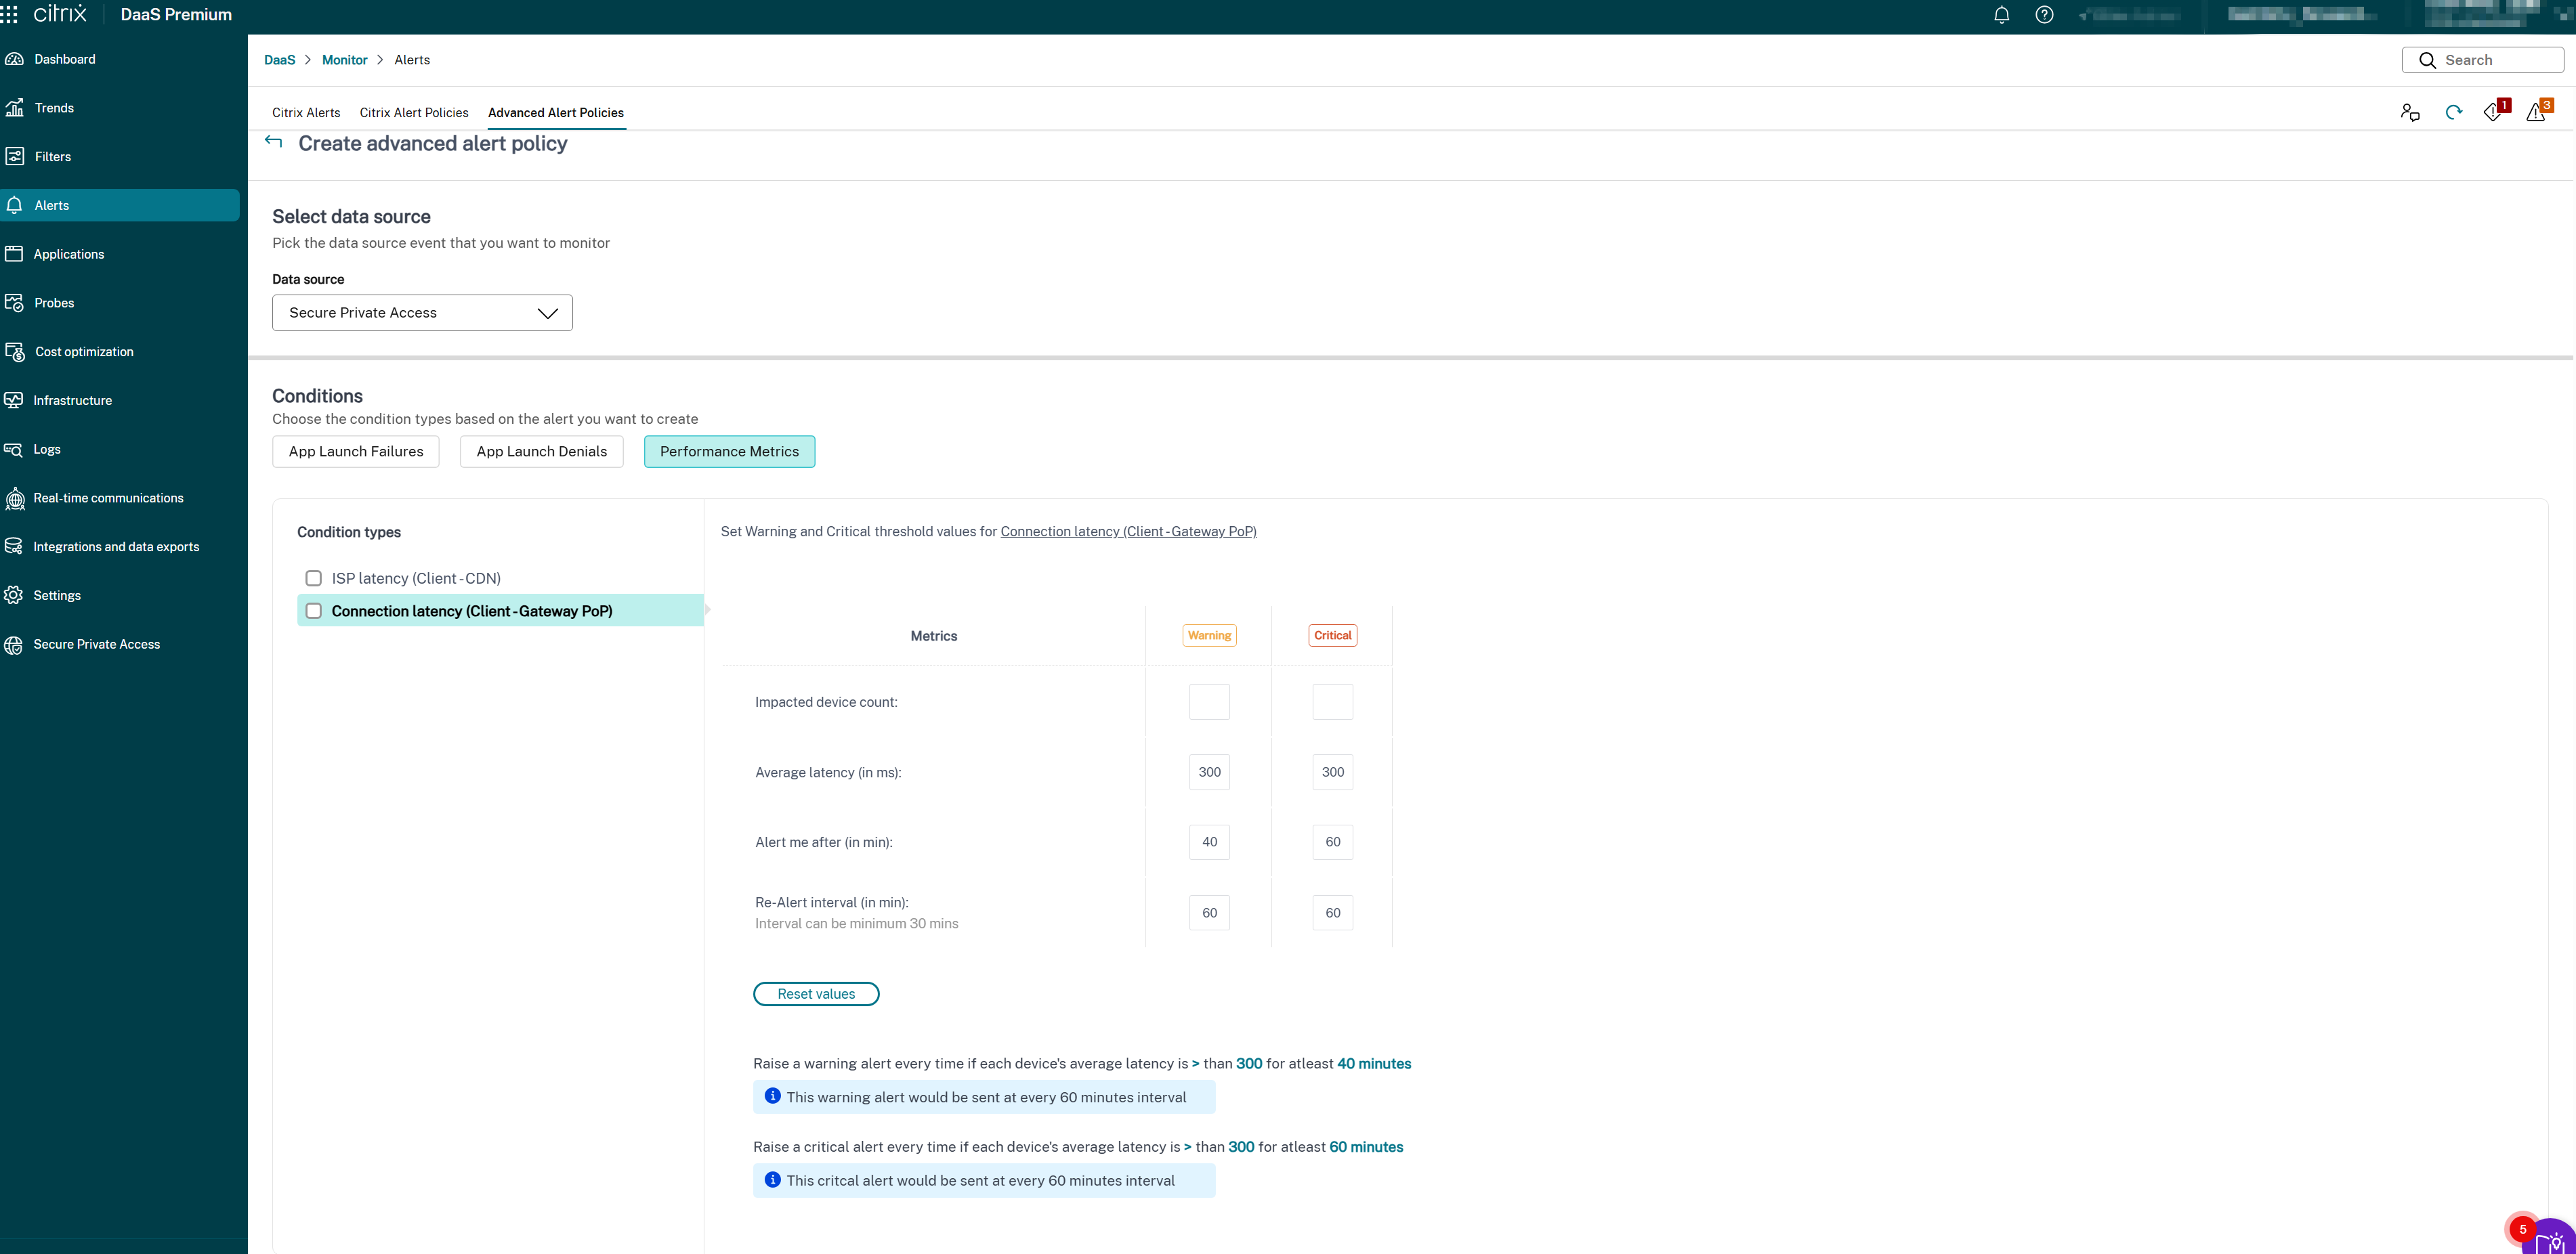
To create alerts for SPA Connection Latency, do the following:
- Click Alerts tab > Advanced Alert Policies. The Advanced Alert Policies page appears.
- Click Create Policy. The Create Advanced Alert Policies section appears.
- Select Secure Private Access from the Data source drop-down list. The SPA Connection Latency condition is displayed.
-
Select the following metric types as required:
- ISP latency (Client → CDN)
- Connection latency (Client → Gateway PoP)
- ISP latency (Client → CDN)
- Connection latency (Client → Gateway PoP)
- Select the specific parameters and the corresponding options for each of the selected metrics.
-
Set the Warning and Critical metrics for the selected condition type:
- Latency threshold (in ms): Set Warning (for example, 150–200 ms) and Critical (for example, 300–400 ms) values
- Impacted users (count): Number of users experiencing latency above threshold
- Sampling interval (in min): How often to evaluate latency (for example, 5–15 minutes)
- Re-alert interval (in min): Minimum 60 minutes recommended to avoid alert fatigue
- Schedule re-alert intervals for the selected alerts as needed.
- Define the scope of the alert. Select site, delivery group, or targeted subset.
-
Set the notification channels. This can be email or Webhook.
-
You can select the following checkboxes:
- Include a JSON payload as an attachment in the webhook
- Include a CSV file as an attachment in the email
-
- Enter the Alert details such as Alert Name (for example, “SPA Connection Latency – PoP East”) and Description (optional).
- Click Save. The alert is created.
Recommendation:
For proactive alerting, adjust latency thresholds based on baseline measurements per region. Include webhook integration to route high-latency alerts into incident management for faster triage.
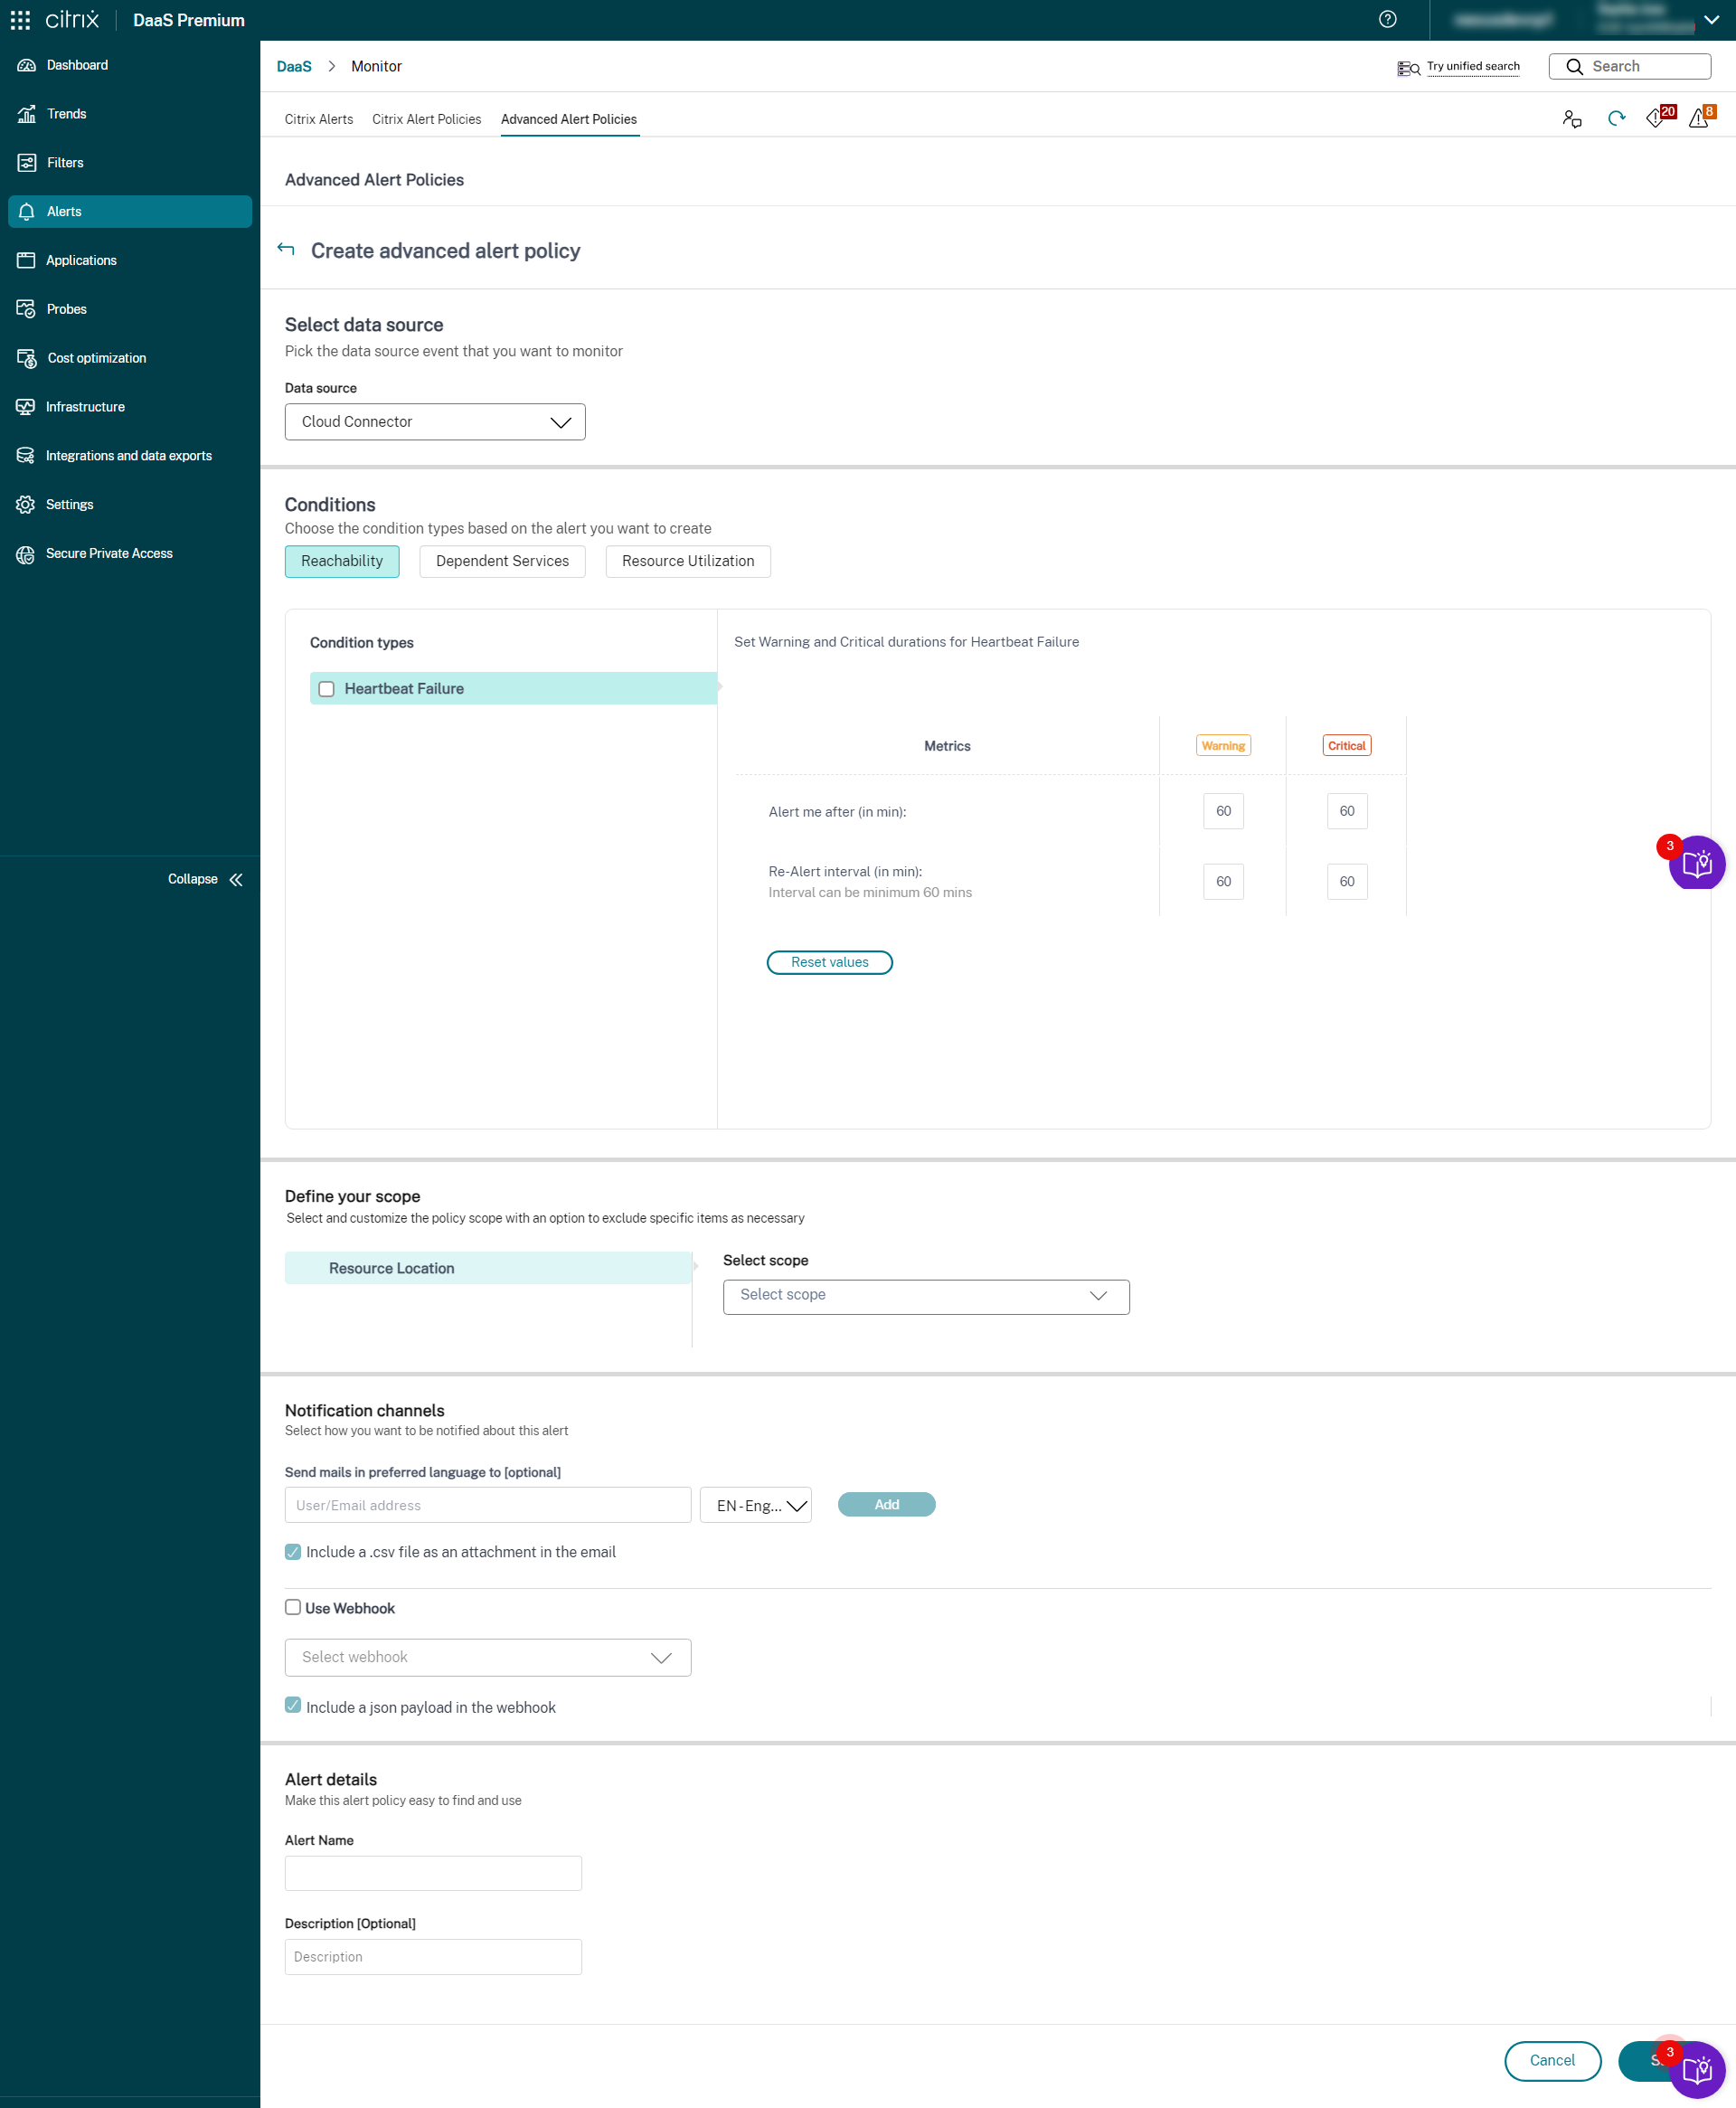
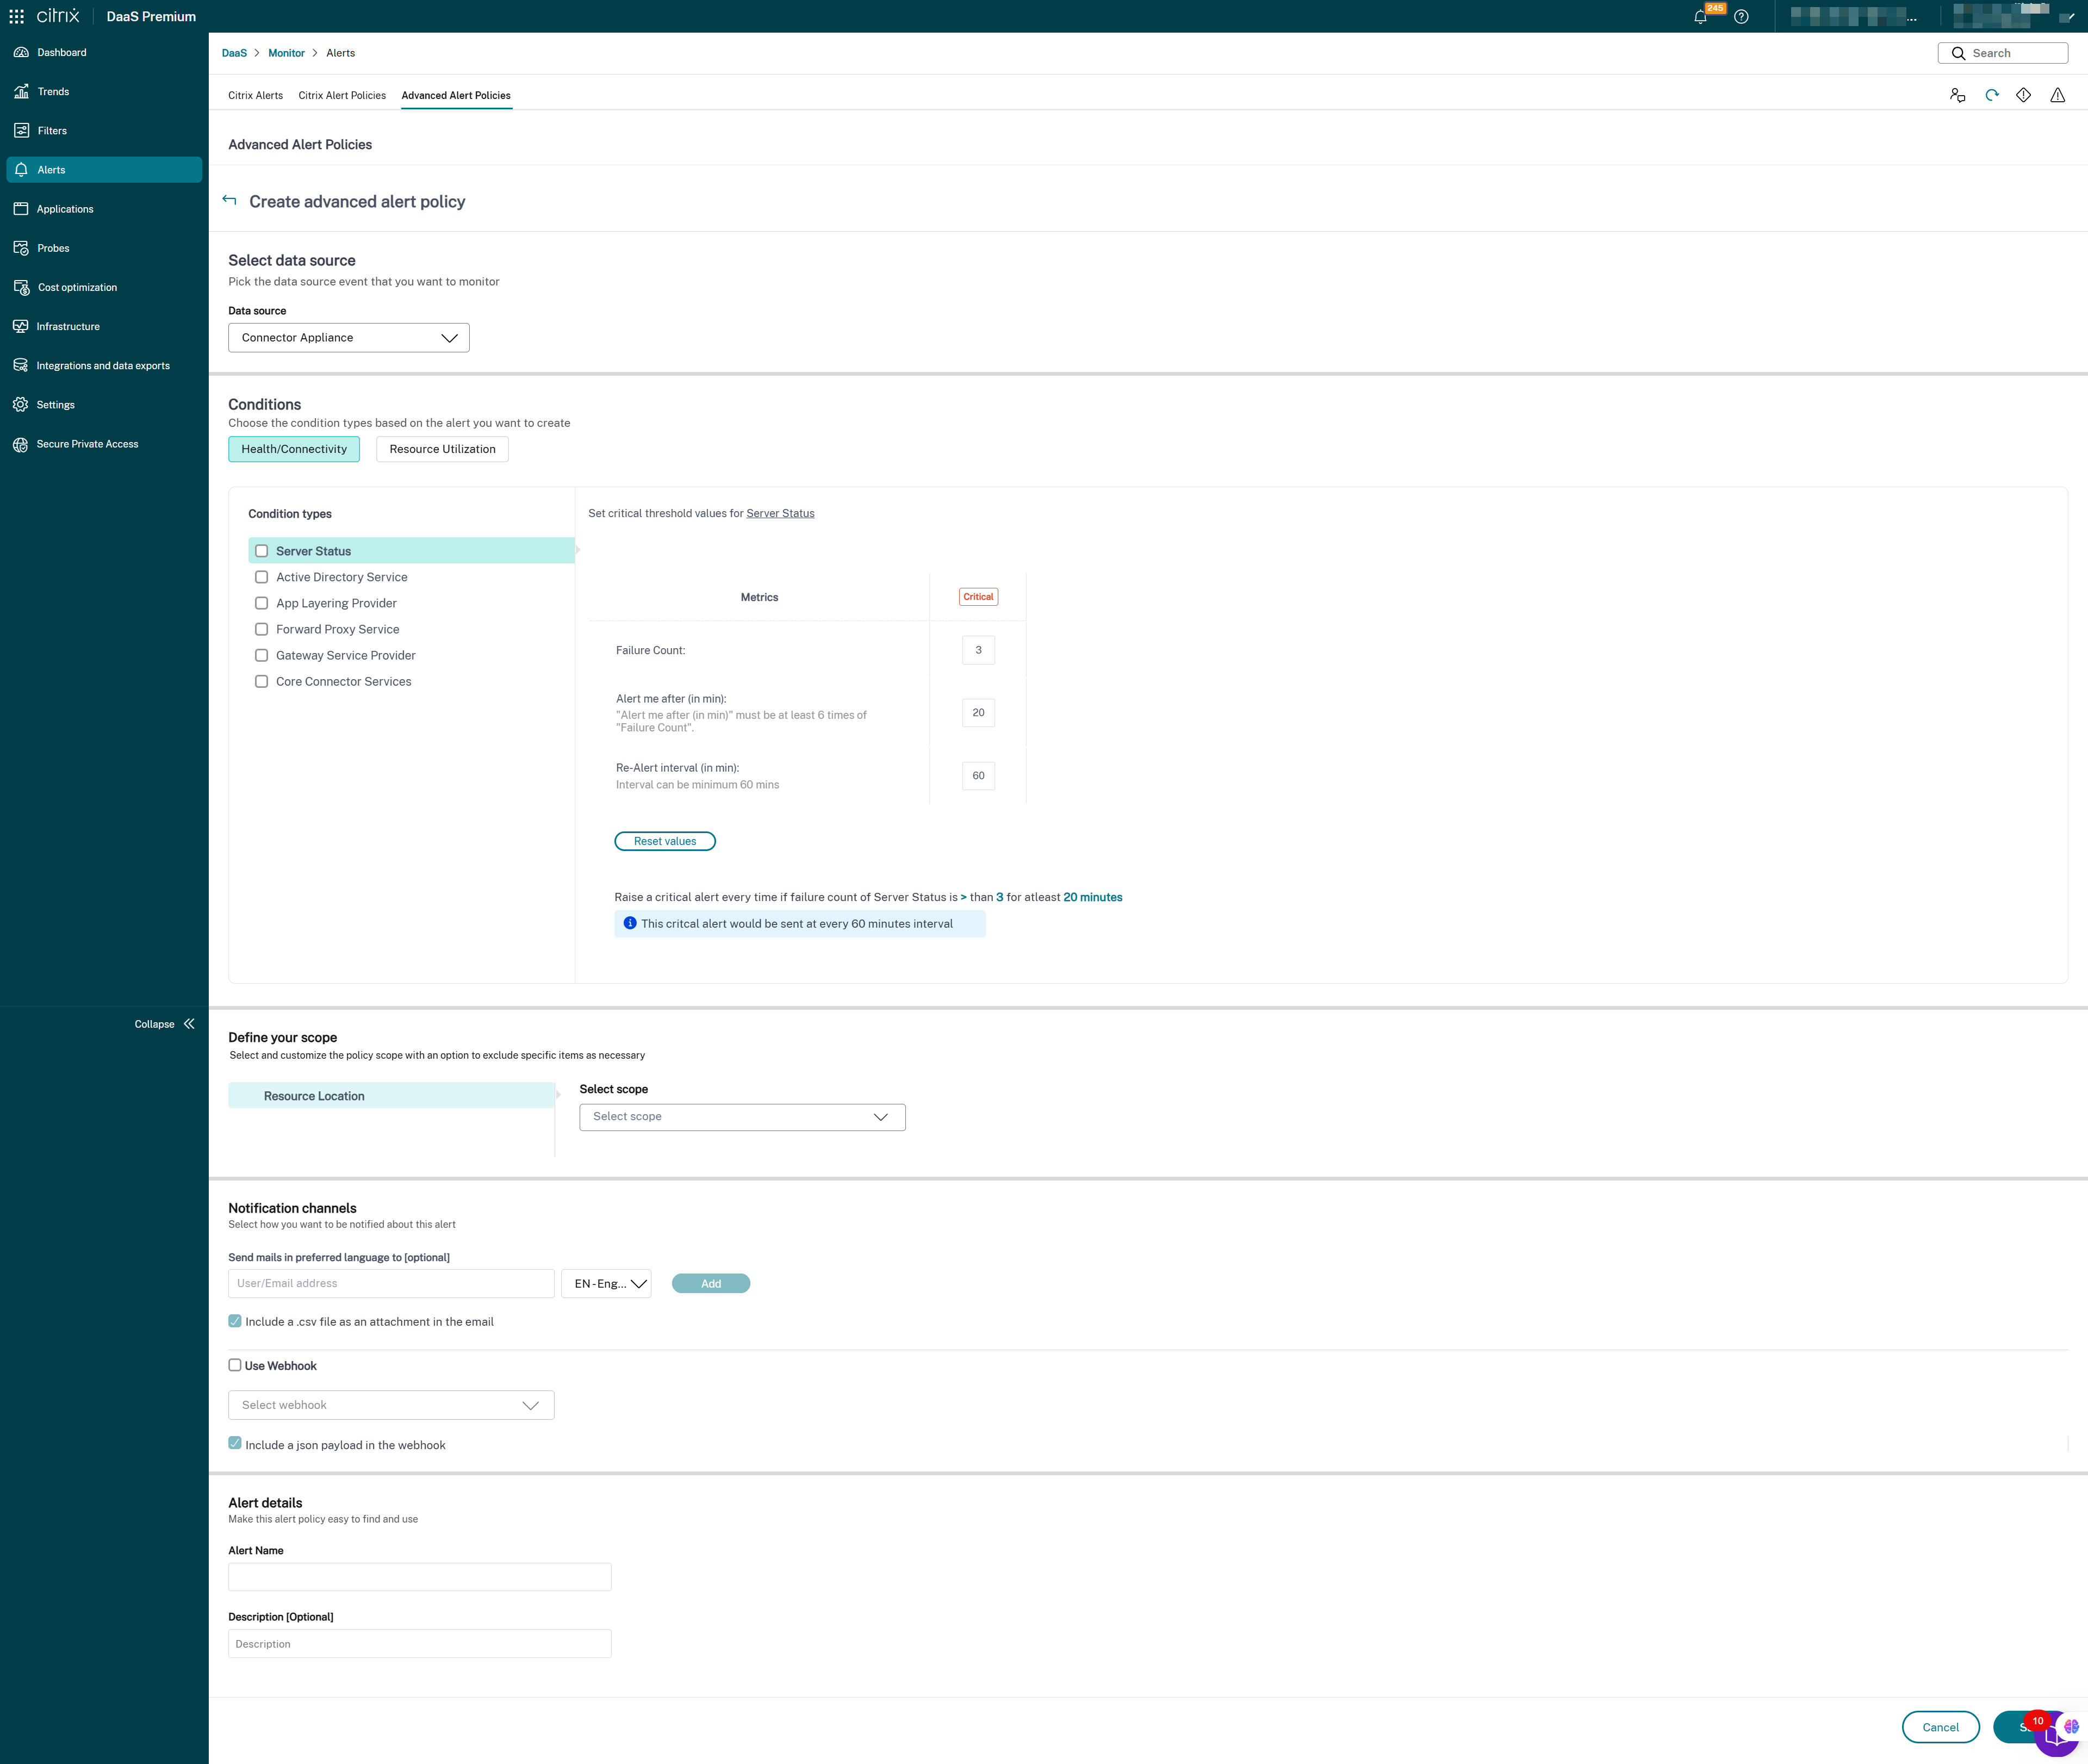
Infrastructure policies
You can create alerts to monitor the health of the following supported Citrix DaaS™ components:
- Provisioning Service
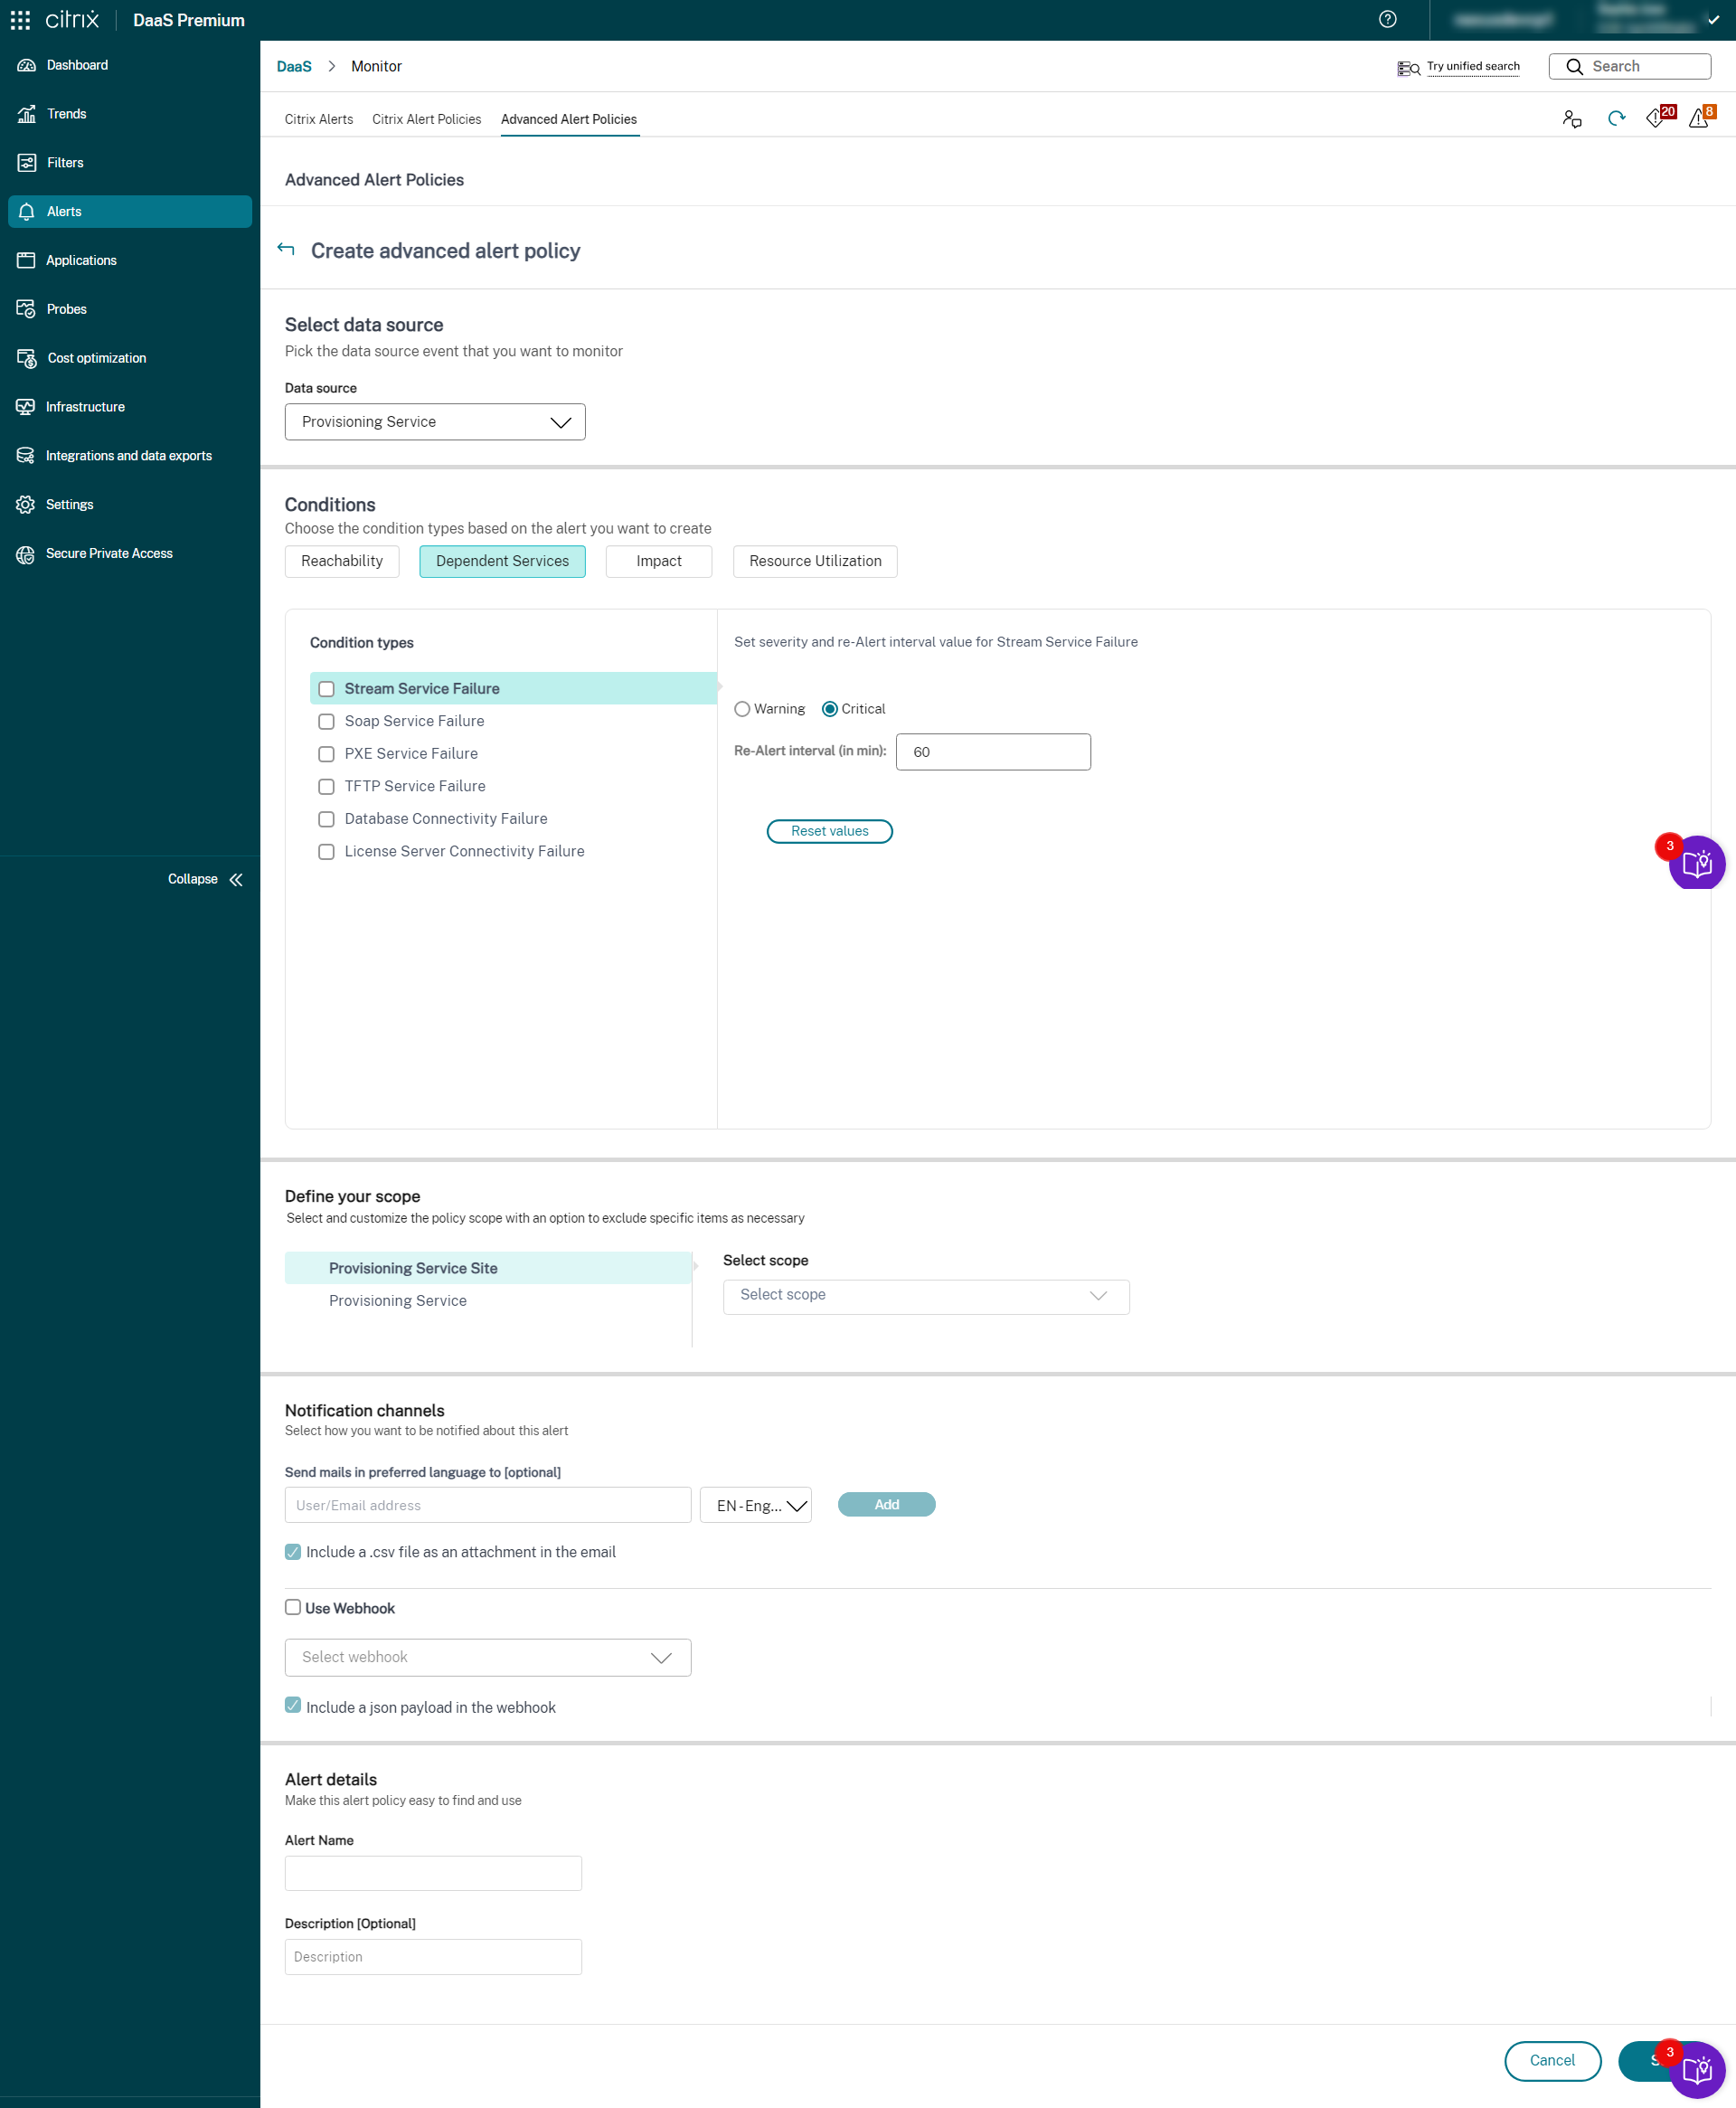
- StoreFront
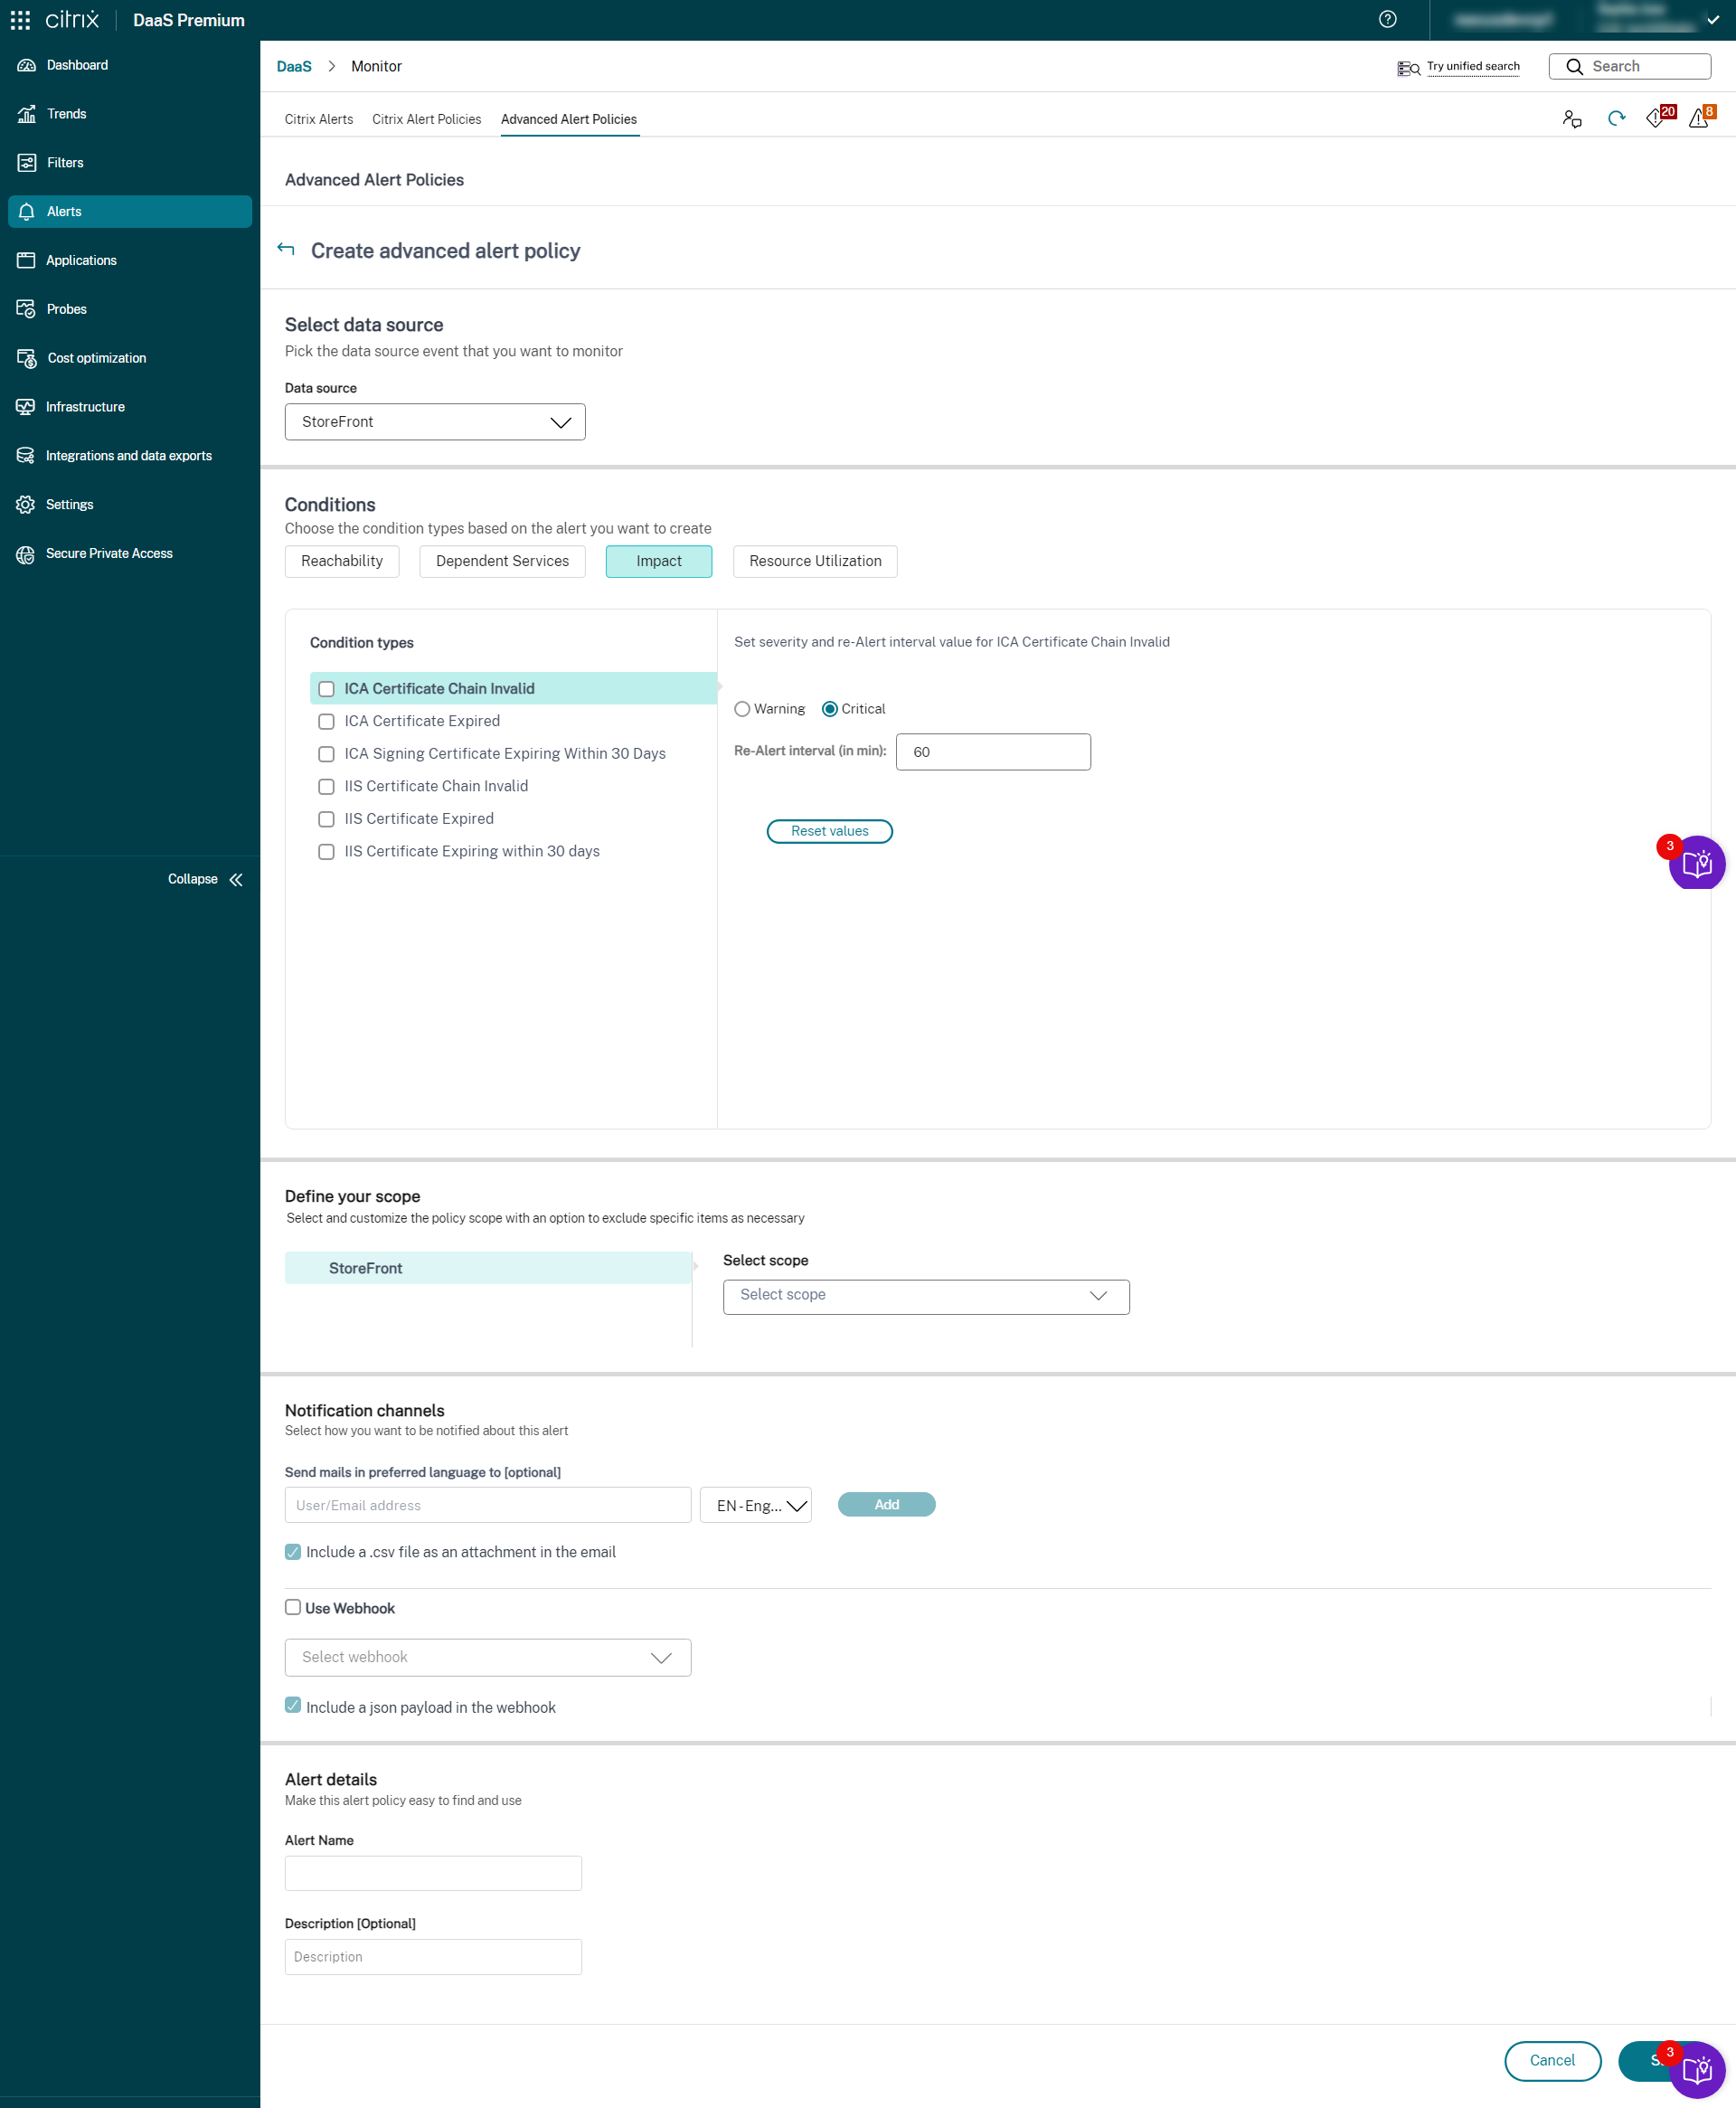
- Cloud Connector
- Connector Appliance
Once the Infrastructure monitoring setup is completed, you can use the health data available in Monitor to configure alerts for any required component. Admins can set conditions, scopes, and notification mediums to receive important alerts through emails or a json payload through webhooks. The alerts raised are also available in the Citrix Alerts section for analysis and management.
As a part of the newly introduced Infrastructure policy, alert conditions are categorized into four sections as follows:
- Reachability
- Dependent services
- Impact
- Resource utilization
Conditions within each category can be set with the severity of Critical and Warning based on your organizational priorities. You can also schedule re-alert intervals for these alerts.
You can create an infrastructure policy from the Alerts > Citrix Alert Policies section. You can select the required category and then select the required conditions for the policy. For more information on how to create a policy, see Create alert policies. After the policy is created, you can edit, delete, or disable the policy on the Citrix Alerts page.
For more details on the conditions supported in each category and component, see the following:
- Provisioning health metrics
- StoreFront health metrics
- Cloud Connector health metrics
- Connector Appliance health metrics
The following data is received as an alert over email or on the Citrix Alert page:
| Field | Description |
|---|---|
| Customer ID | The customer ID of the site. |
| Alert level | The possible values are Critical and Warning. |
| Target | The name of the machine for which the alert is triggered. |
| Time | The time when the alert is triggered. |
| Scope | The scope of the policy. |
| Policy | The name of the policy. |
| Description | The description of the issue for which the alert is triggered. |
Define the scope of the policy
You can define the scope of your alert and add exceptions. The alert is generated only for the selected scope and the subscope excluded using add exceptions aren’t included in alert generation. This feature helps you to create alerts on a granular level.
You can create notifications through emails or through webhook URLs. You can also select your preferred language in which you would like to receive alerts. You can also select an option to receive the alert parameters in a .CSV file attachment for email or in a json payload through a webhook URL. The attachment includes details of the required parameters. For more information, see Enhancements on alert content.
The following data is received as an alert over email or on the Citrix Alerts page:
| Field | Description |
|---|---|
| Customer ID | The customer ID of the site. |
| Alert level | This value is the predefined value set for each alert condition. The possible values are Critical and Warning. |
| Condition | This value is the condition set while creating the policy. For example, the number of unregistered machines is equal to or more than 20. |
| Target | The name of the delivery group or site for which the alert is triggered. |
| Site | The name of the site. |
| Scope | The scope of the policy. This value includes subscope also. |
| Policy | The name of the policy. |
| Description | The description of the issue for which the alert is triggered. |
How to create an Advanced alert policy using a PowerShell script?
PowerShell script to create an alert policy:
asnp Citrix.Monitor.*
# Add Parameters
$timeSpan = New-TimeSpan -Seconds 30
$alertThreshold = 1
$alarmThreshold = 2
# Add Target UID's
$targetIds = @()
$targetIds += "e9a211b4-a1f3-4f74-b6c7-85225902e997"
# Add email addresses
$emailaddress = @()
$emailaddress += "loki@abc.com"
# Create new policy
$policy = New-MonitorNotificationPolicy -Name "FailedMachinePercentageAlertCreationViaPowershell" -Description "Policy created to test urm" -Enabled $true
<!--NeedCopy-->
Replace the following line with the correct condition for FailedMachinePercentage
Add-MonitorNotificationPolicyCondition -Uid $policy.Uid -ConditionType FailedMachinePercentage -AlertThreshold $alertThreshold -AlarmThreshold $alarmThreshold -AlertRenotification $timeSpan -AlarmRenotification $timeSpan
Add-MonitorNotificationPolicyTargets -Uid $policy.Uid -Scope "DG-Multisession" -TargetKind DesktopGroup -TargetIds $targetIds
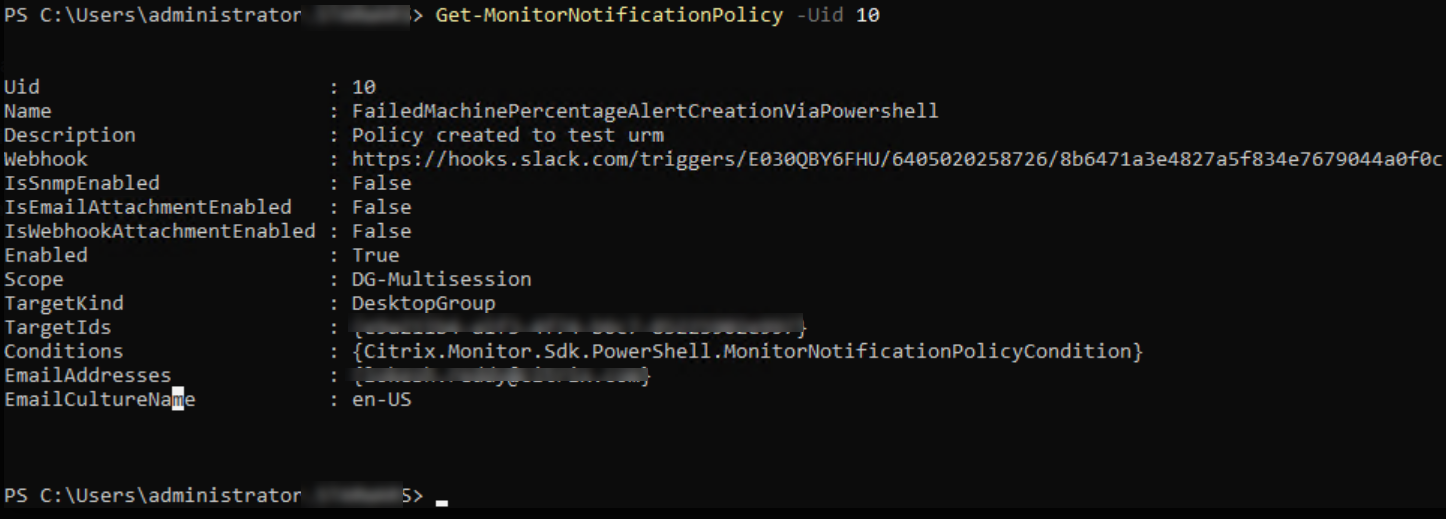
$policy = Get-MonitorNotificationPolicy -Uid $policy.Uid
$policy
<!--NeedCopy-->
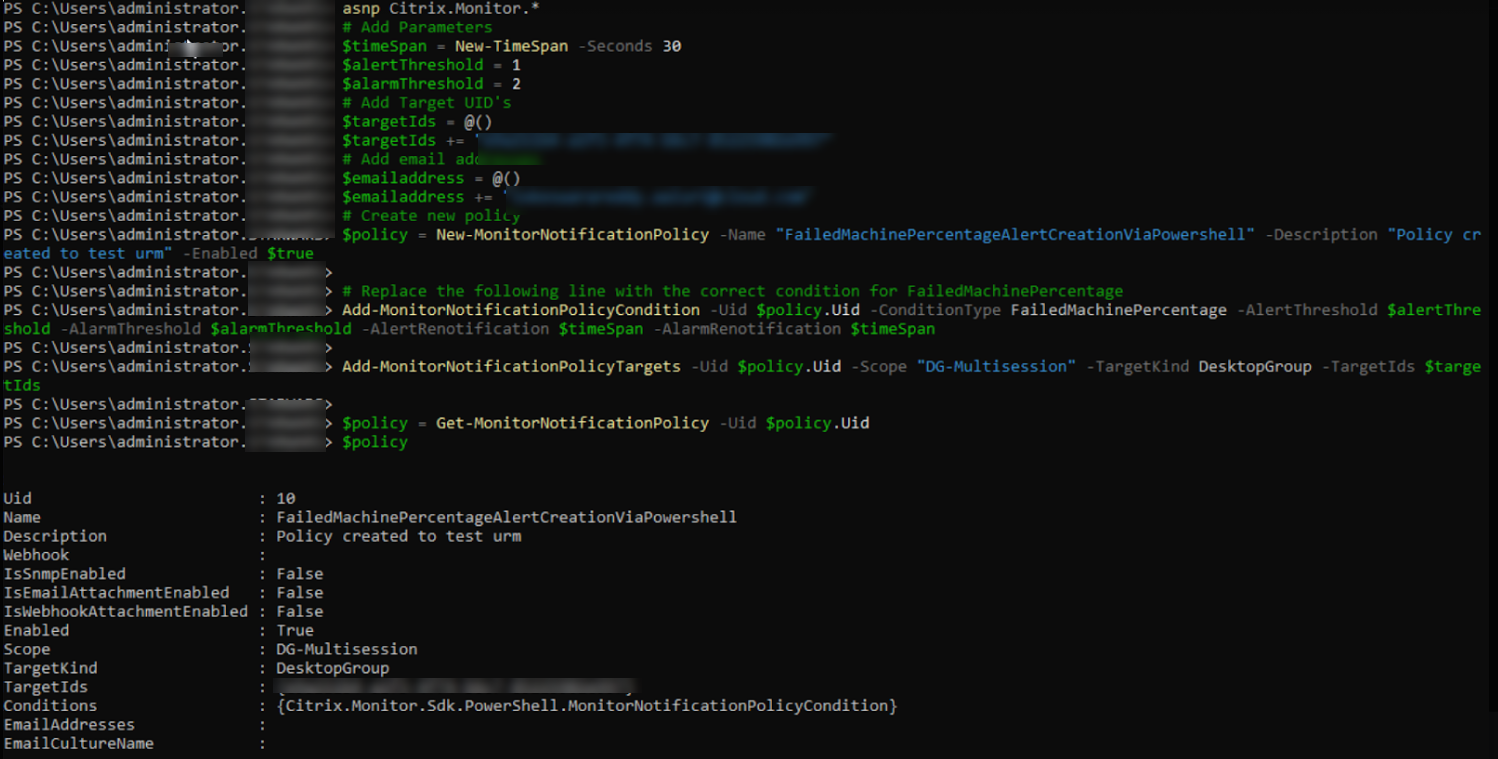
From the preceding image, you can see that the policy is created and Uid is 10.
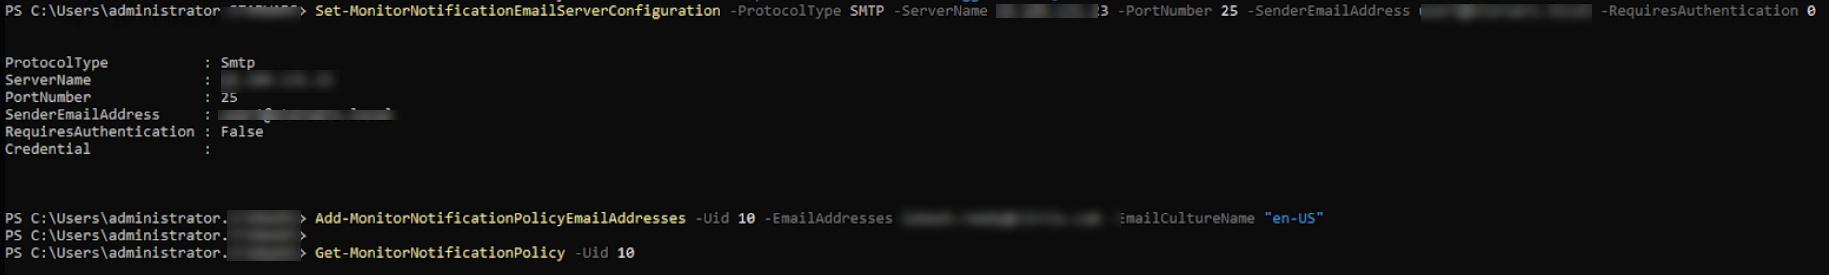
To add email to configuration
Set-MonitorNotificationEmailServerConfiguration -ProtocolType SMTP -ServerName NameOfTheSMTPServerOrIPAddress -PortNumber 80 -SenderEmailAddress loki@abc.com -RequiresAuthentication 0
<!--NeedCopy-->
To add email to policy
Add-MonitorNotificationPolicyEmailAddresses -Uid $policy.Uid -EmailAddresses $emailaddress -EmailCultureName "en-US"
<!--NeedCopy-->
Sample script to add email:
Add-MonitorNotificationPolicyEmailAddresses -Uid 10 -EmailAddresses $emailaddress -EmailCultureName "en-US"
<!--NeedCopy-->
To add Webhook URL to policy
Set-MonitorNotificationPolicy –Uid $polcy.Uid –Webhook 'URL'
<!--NeedCopy-->

Sample scipt to add webhook URL:
Set-MonitorNotificationPolicy –Uid 10  –Webhook  'https://hooks.slack.com/triggers/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'
<!--NeedCopy-->
Get Created Policy details
Get-MonitorNotificationPolicy -Uid 10
<!--NeedCopy-->
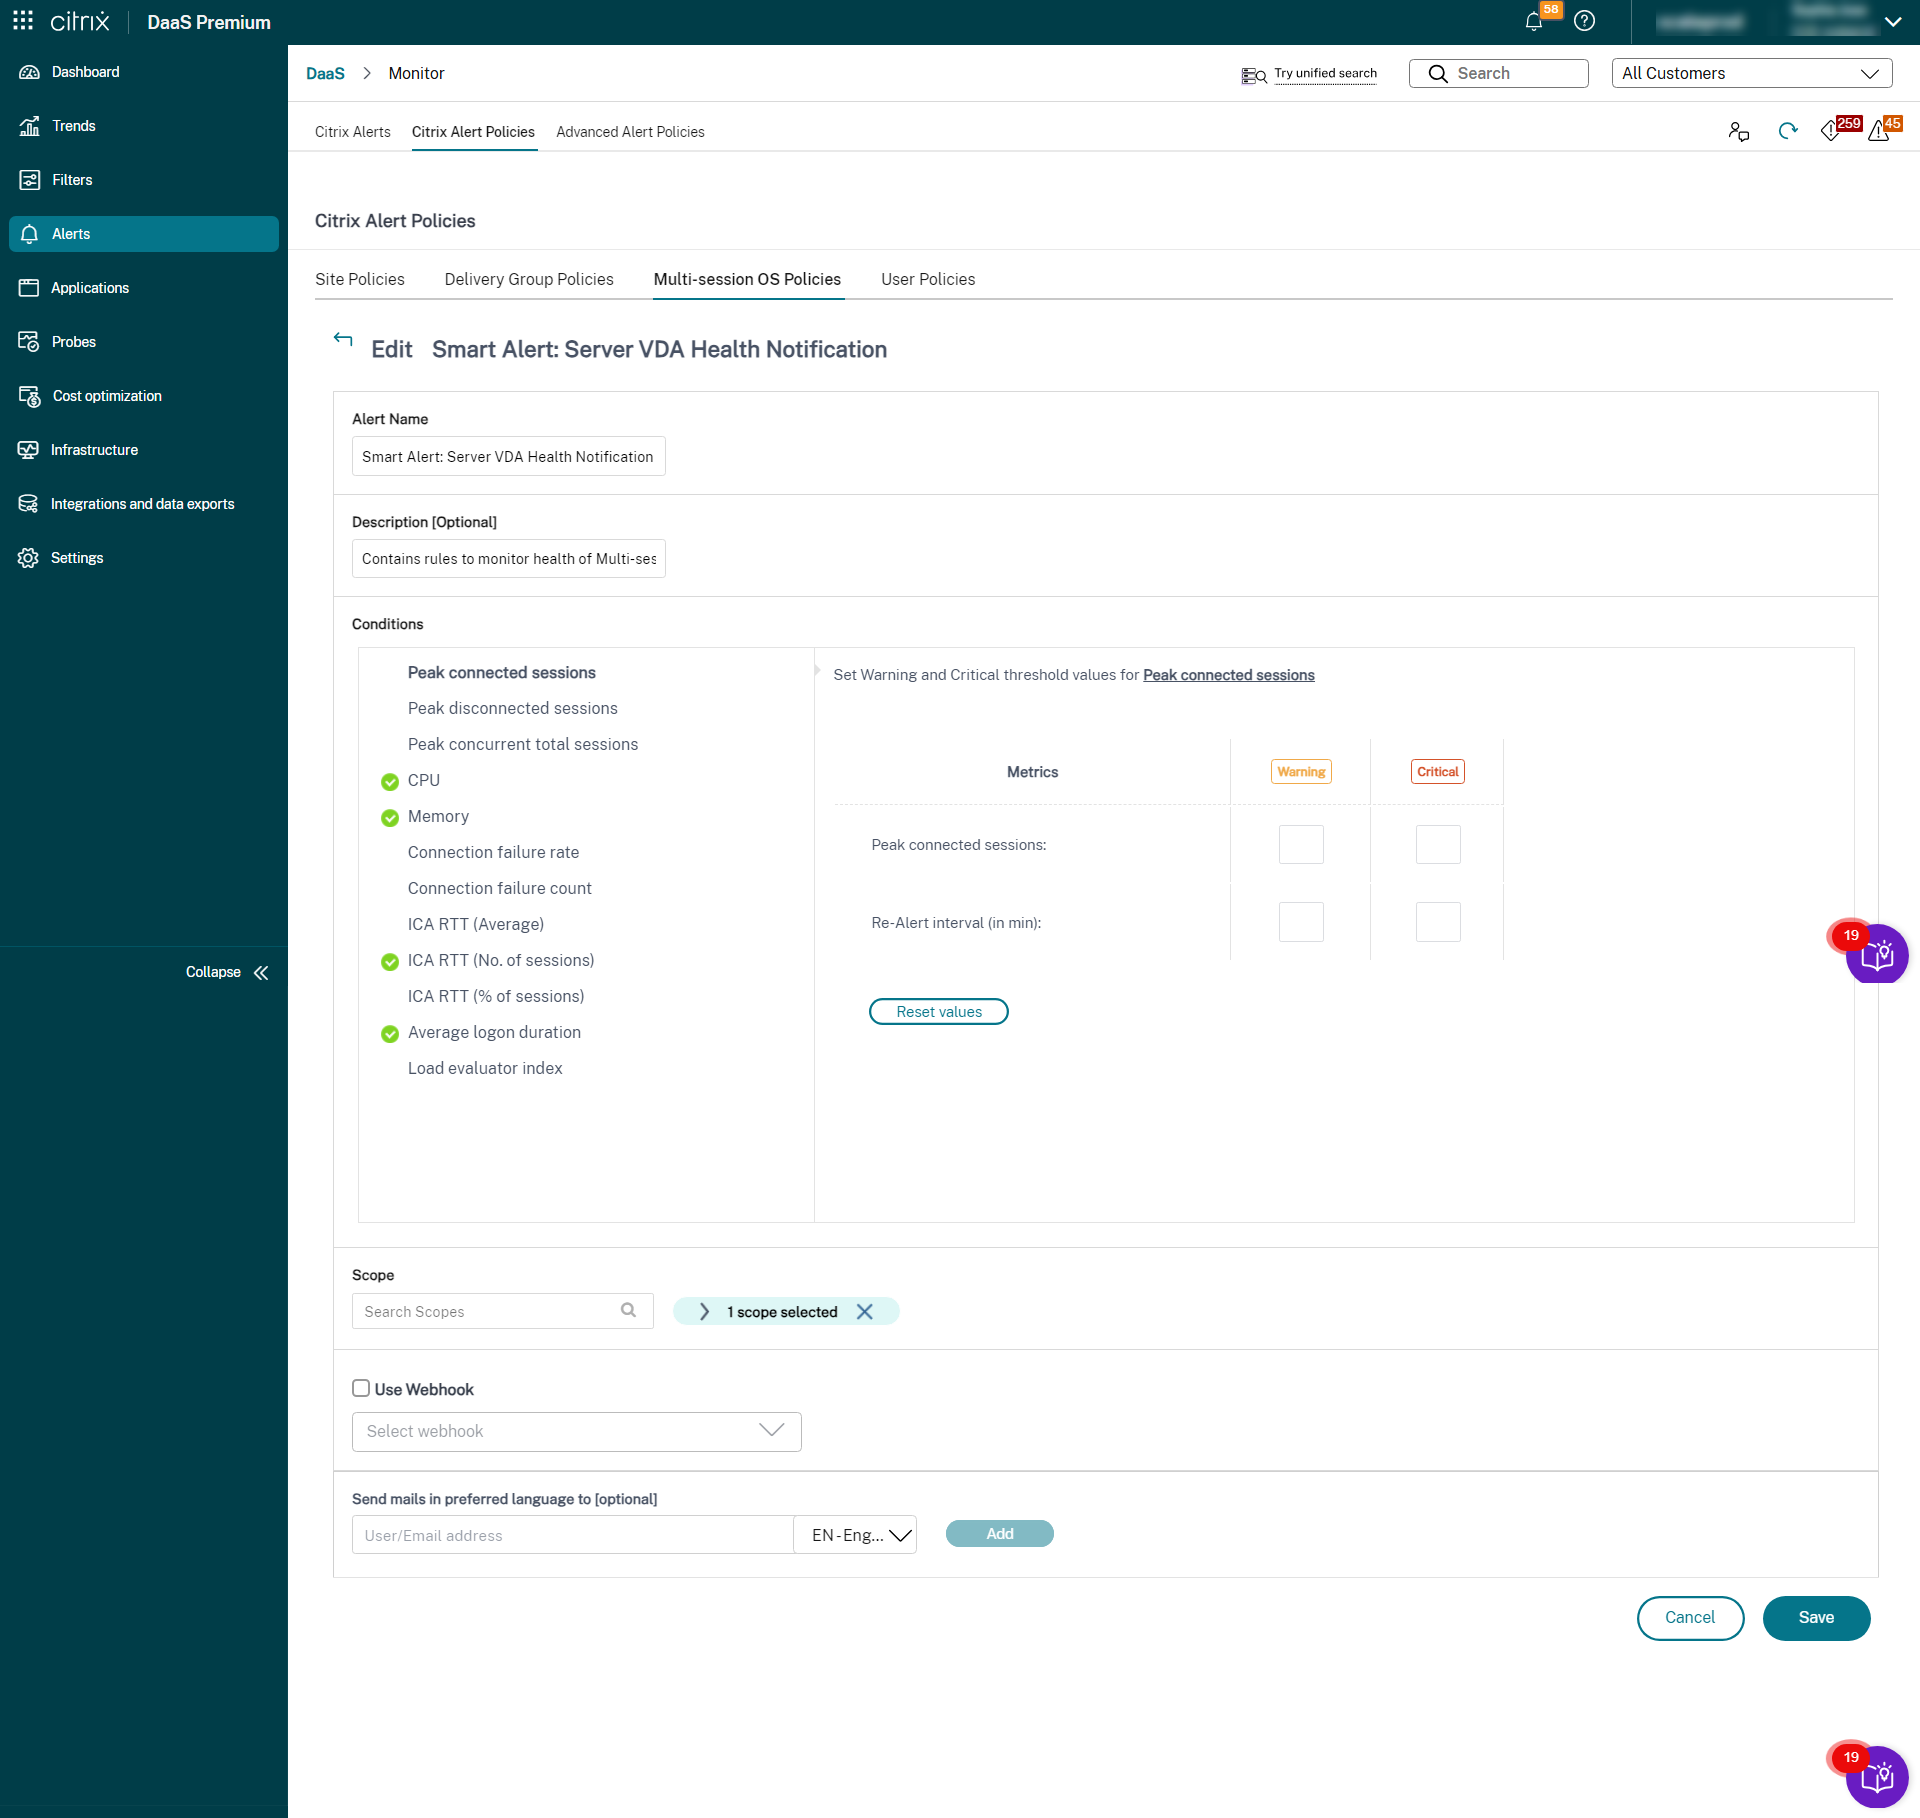
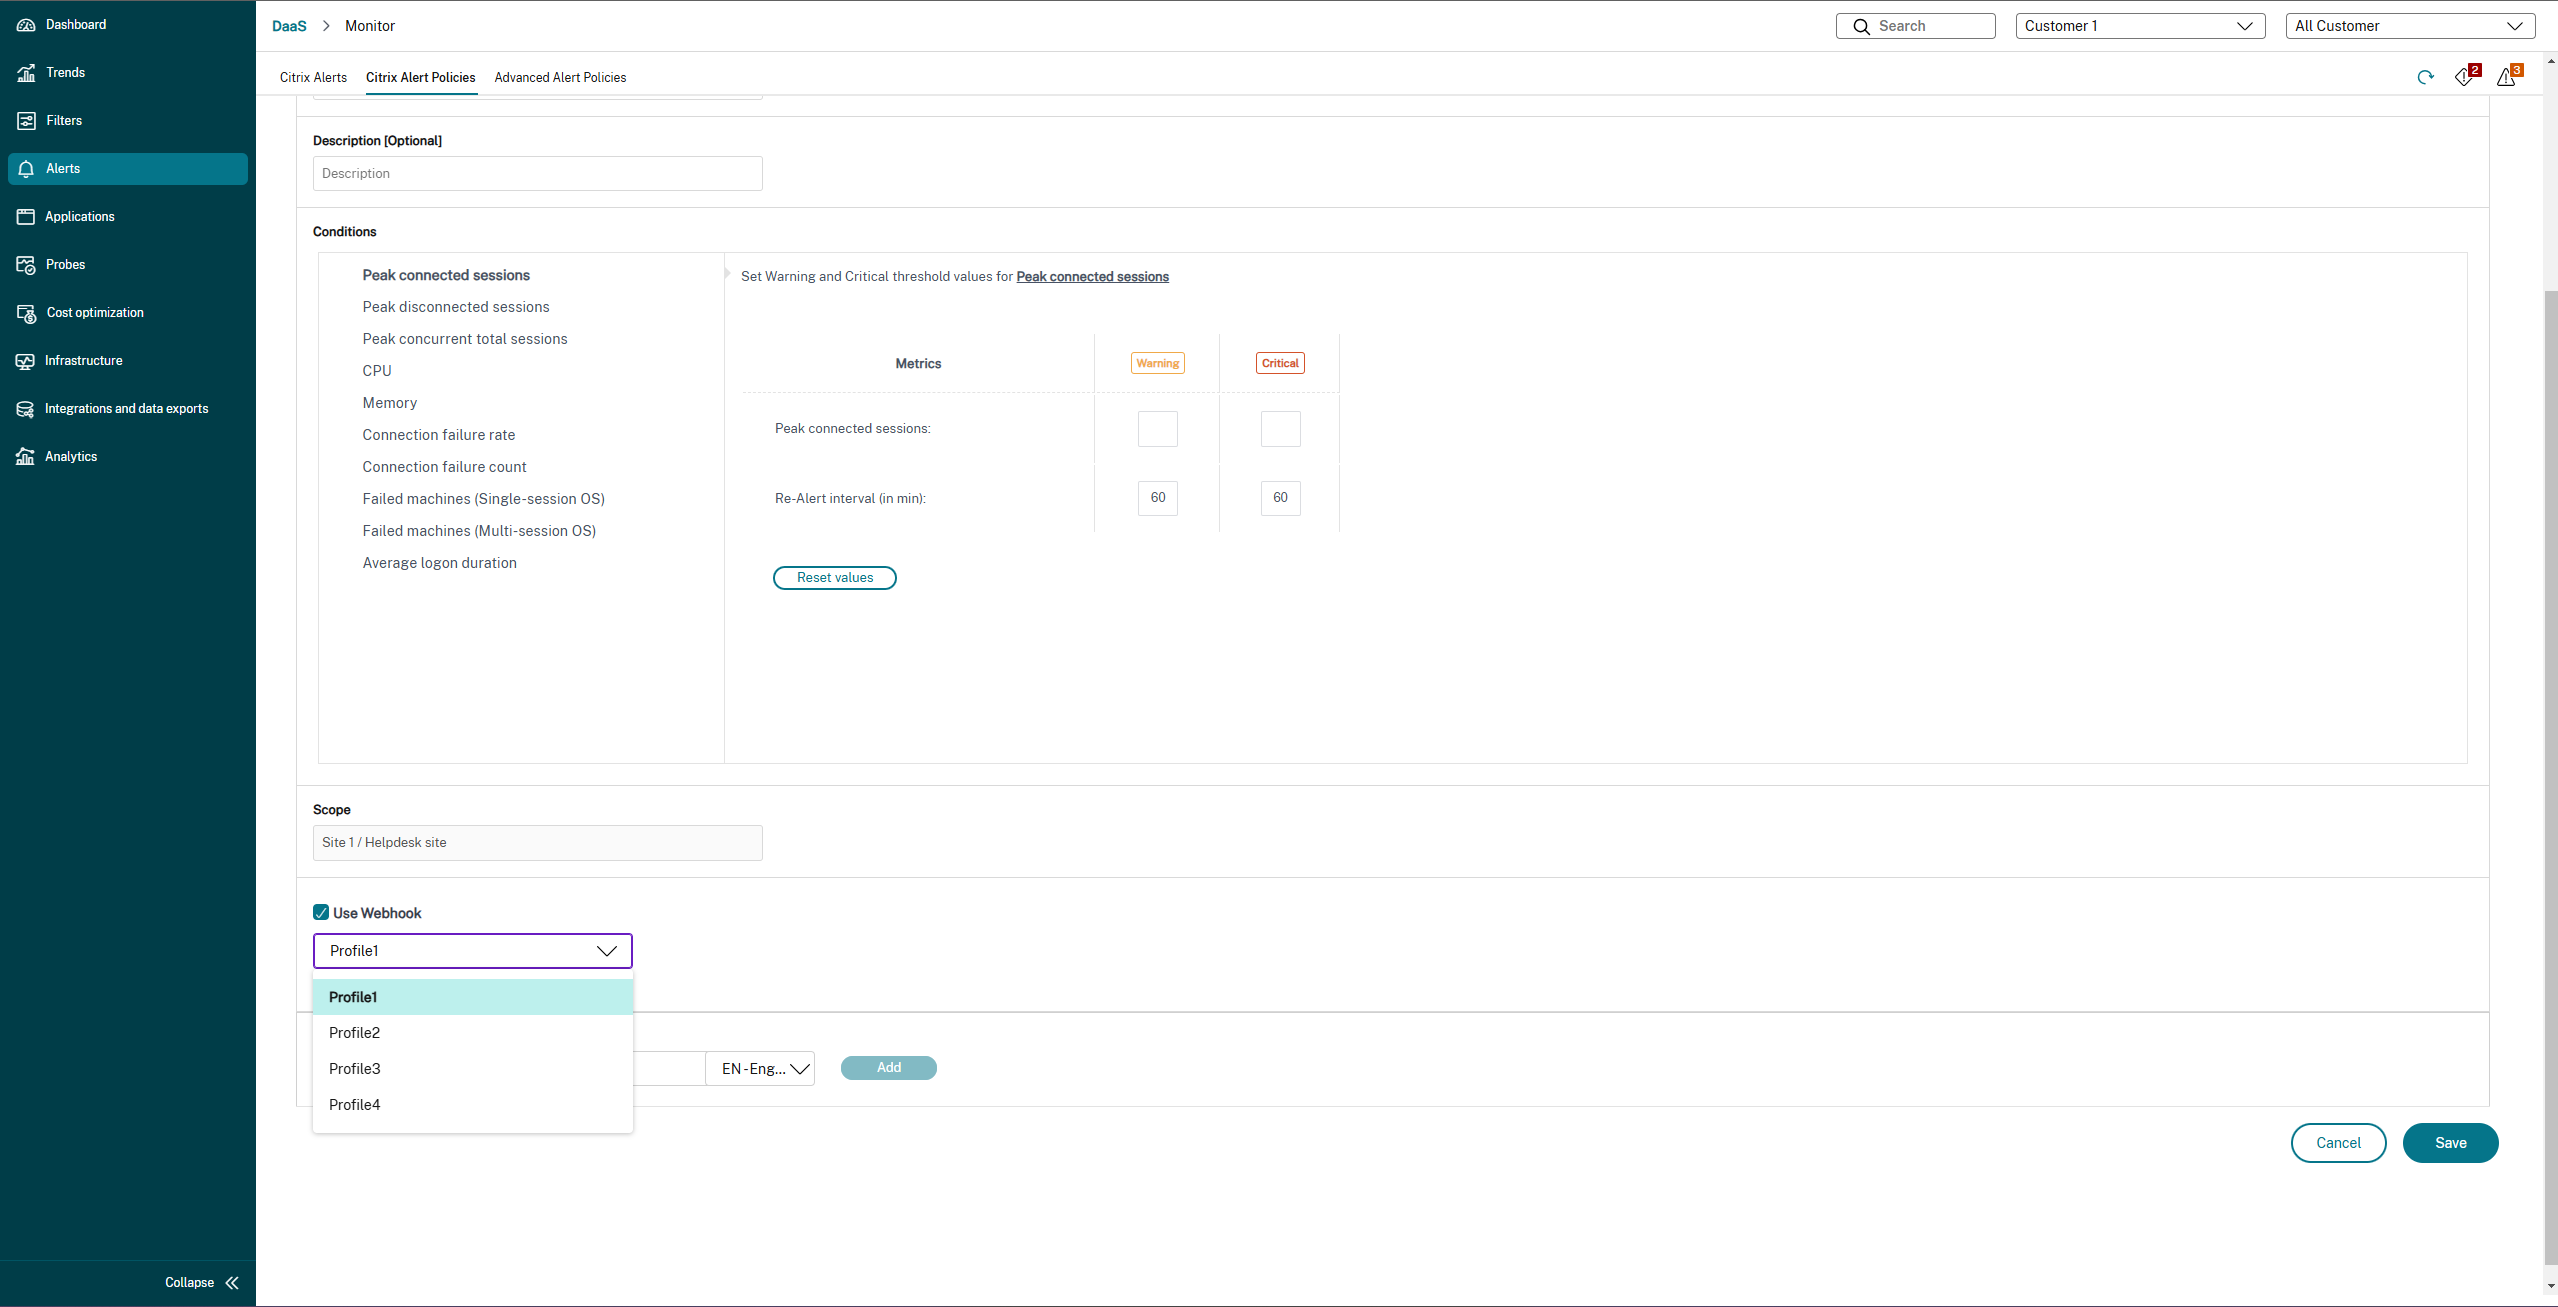
Create alerts policies
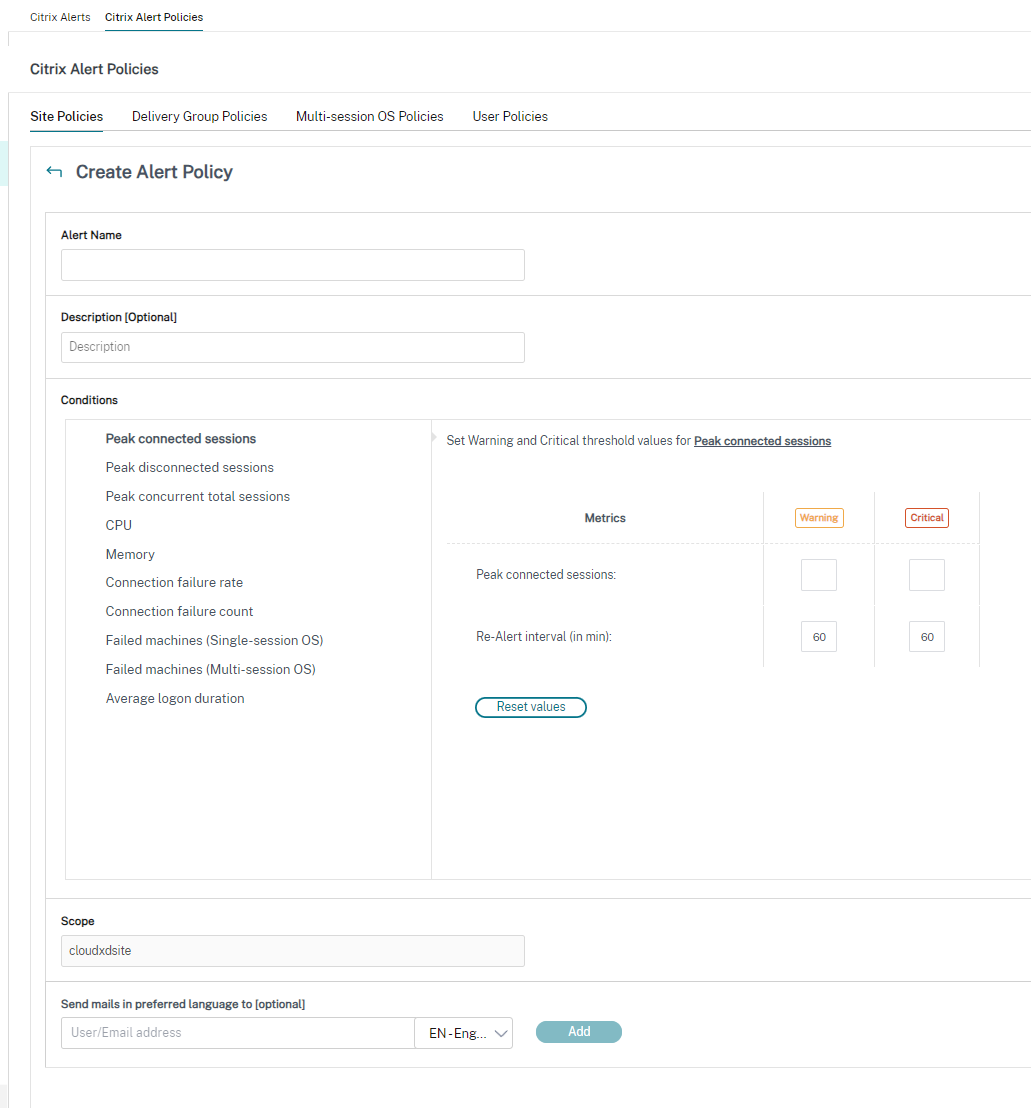
To create alerts policy, for example, to generate an alert when a specific set of session count criteria are met:
- Go to Alerts > Citrix Alerts Policy and select, for example, Multi-session OS Policy.
- Click Create.
- Name and describe the policy, then set the conditions that have to be met for the alert to be triggered. For example, specify Warning and Critical counts for Peak Connected Sessions, Peak Disconnected Sessions, and Peak Concurrent Total Sessions. Warning values must not be greater than Critical values. For more information, see Alerts policies conditions.
- Set the Re-alert interval. If the conditions for the alert are still met, the alert is triggered again at this time interval and, if set up in the alert policy, an email notification is generated. A dismissed alert does not generate an email notification at the re-alert interval.
- Set the Scope. For example, set for a specific delivery group.
- In Notification preferences, specify who should be notified by email when the alert is triggered. Email notifications are sent via SendGrid. Ensure that the email address
donotreplynotifications@citrix.comis white-listed in your email setup. - Click Save.
Creating a policy with 20 or more delivery groups defined in the Scope might take approximately 30 seconds to complete the configuration. A spinner is displayed during this time.
Creating more than 50 policies for up to 20 unique delivery groups (1000 delivery group targets in total) might result in an increase in response time (over 5 seconds).
Moving a machine containing active sessions from one delivery group to another might trigger erroneous delivery group alerts that are defined using machine parameters.
Note:
After you delete an alert policy, it might take up to 30 minutes for the alert notifications generated by the policy to stop.
Enhancements on alert content
The alerting feature of the Monitor is enhanced to include a CSV attachment and a JSON payload. With this enhancement, you can get alert details in a CSV attachment over email or as a JSON payload if there is a webhook. Using this CSV attachment or JSON payload, you can receive enriched content at a detailed level, aiding in the quick identification and resolution of issues.
Currently, this enhancement is available only on the following alerts:
- Machine uptime
- Failed power on actions
- Failed power off actions
- Unregistered machines (%)
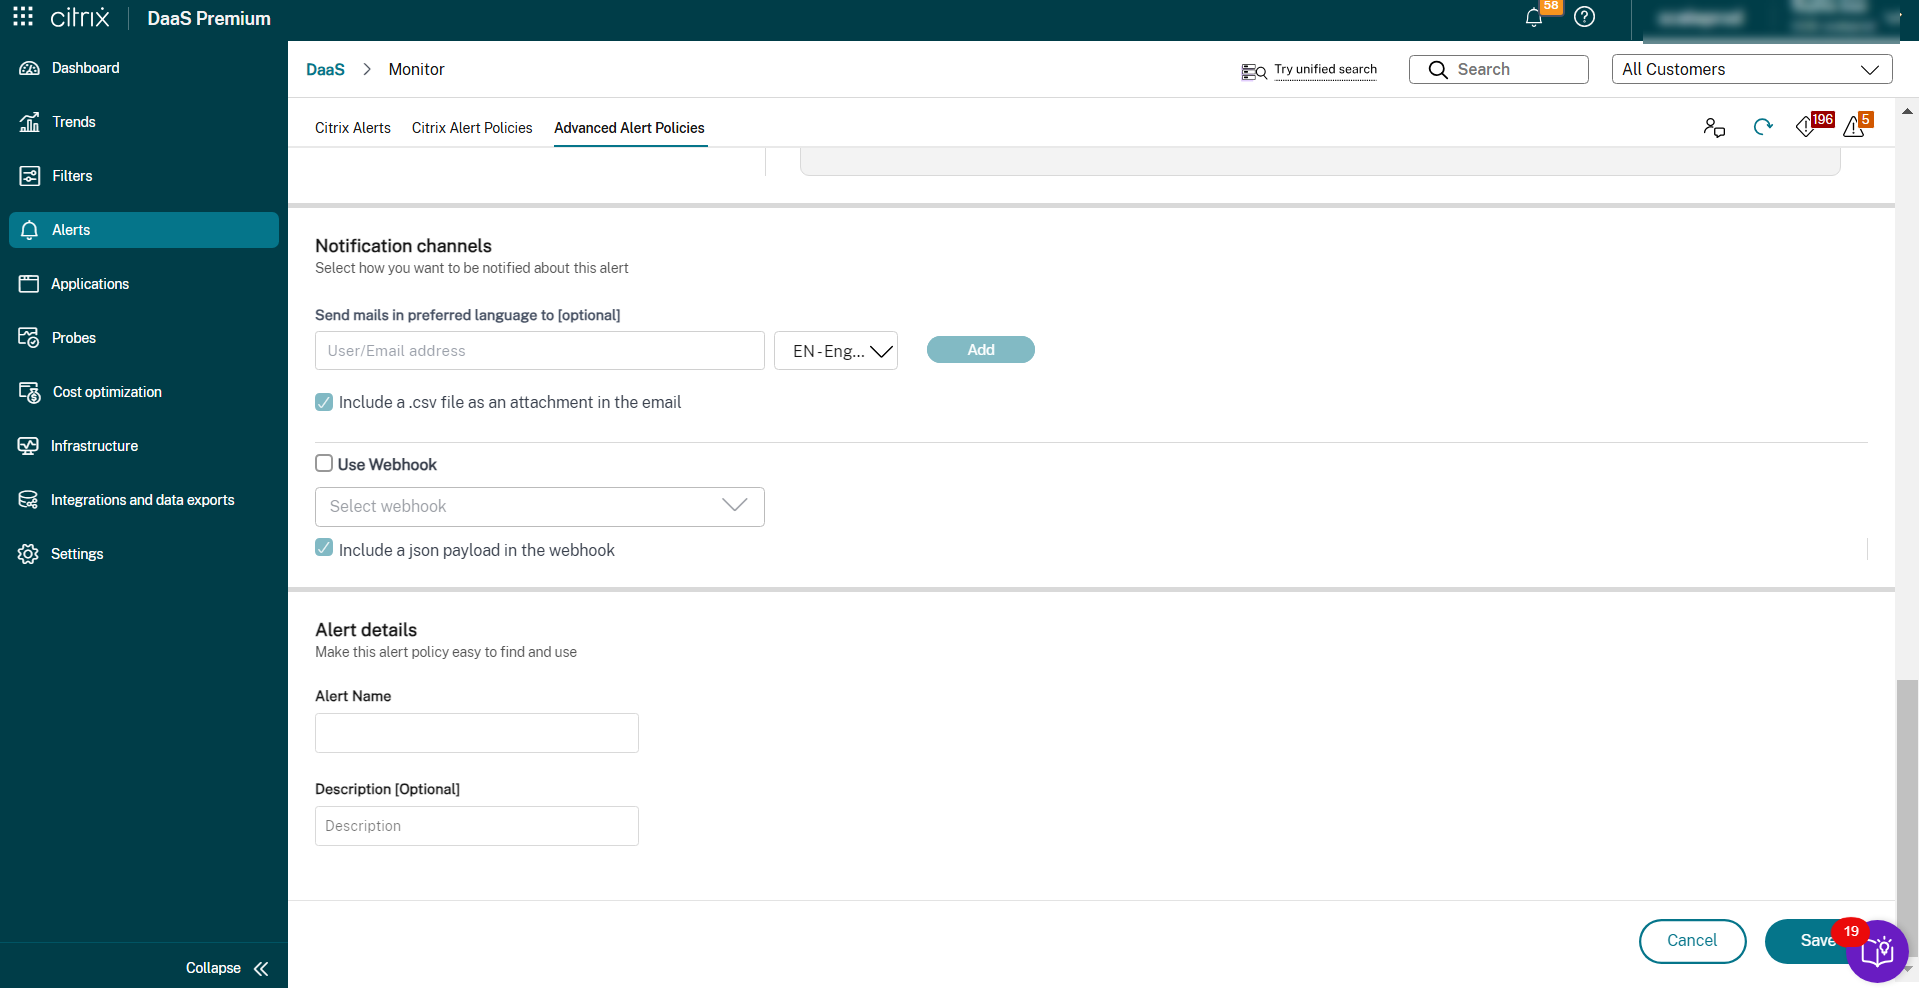
To use this feature, navigate to the alert and select the following checkboxes:
- Include a json payload as an attachment in the webhook
- Include a csv file as an attachment in the email
The following is a screenshot from the Citrix Alert Policies section:
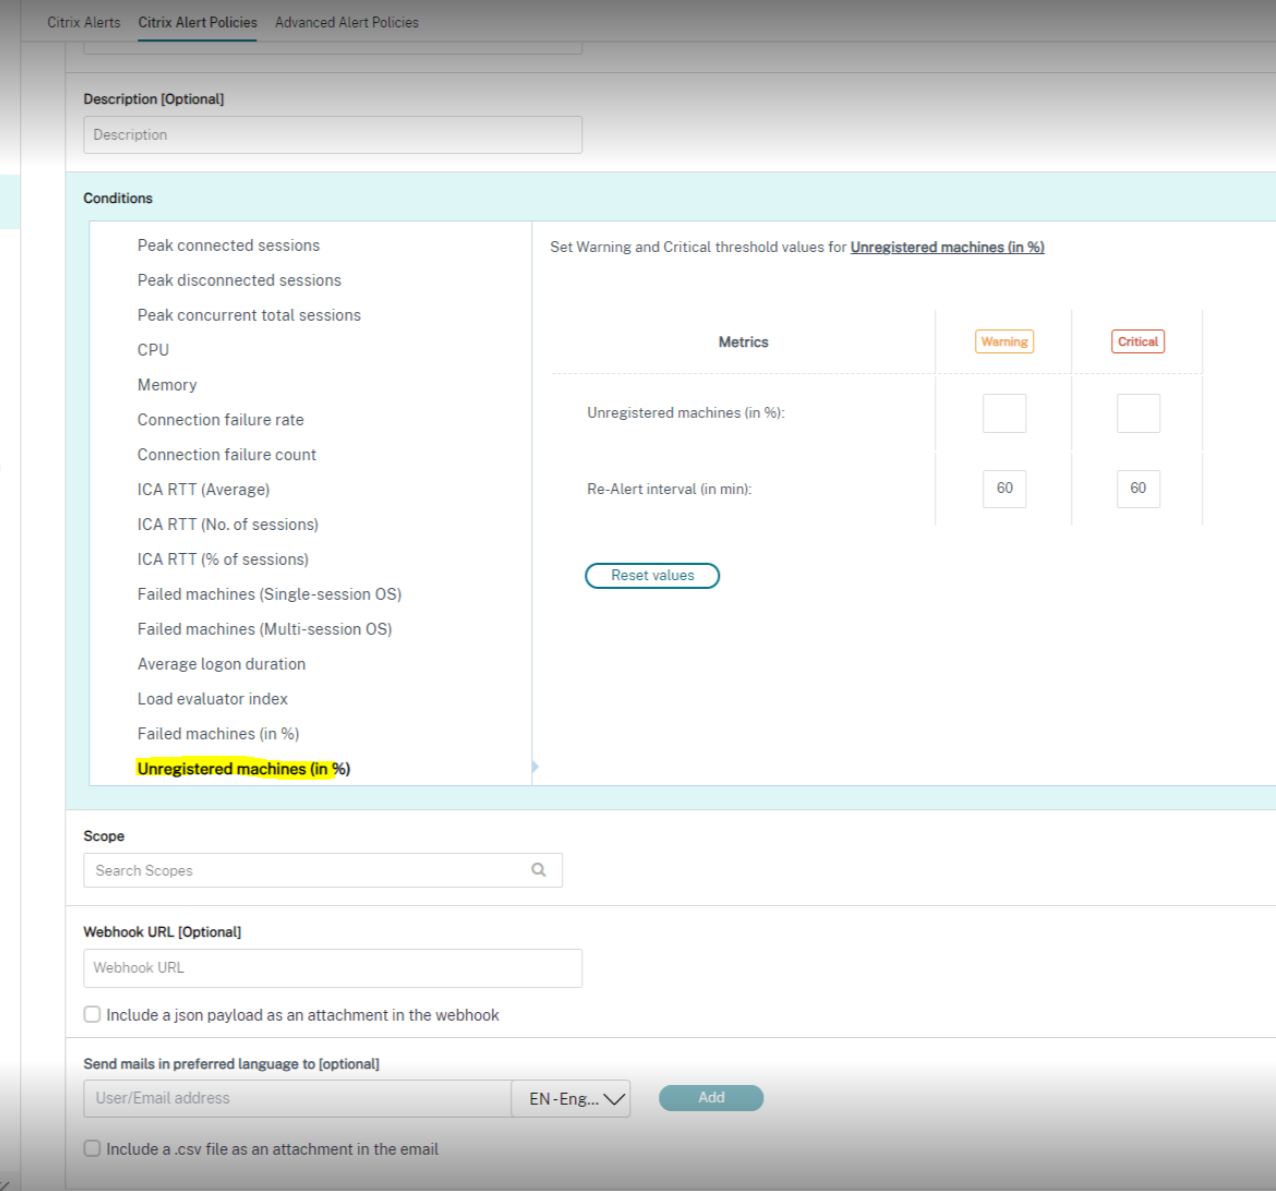
Here is a screenshot from Advanced Alert Policies section:
CSV attachment
The following table provides columns of the .CSV attachment for all supported alerts:
| Column | Applicable alert |
|---|---|
| Machine Name, IP Address, and Delivery Group Name | Machine uptime, Failed power off action and Failed power on action, and Unregistered machines (%) |
| Current Registration State, Failure Date, Fault State, and Lifecycle State | Unregistered machine (%) |
| Last Power Action Failure Reason, Last Power Action Triggered By, Last Power Action Type, and Last Power Action Completed Date | Failed power off action and Failed power on action |
| Power State, Powered On Date, and Total Uptime In Minutes | Machine uptime |
Webhook payload
Unregistered Machine Percentage Alert
{
  "text": "{\"Address\":\"<Webhook URL>\",\"NotificationId\":\"<NotificationGUID>\",\"NotificationState\":\"NotificationActive\",\"Priority\":\"<Critical/Warning>\",\"Target\":\"<DeliveryGroupName>\",\"Condition\":\"Unregistered machines (in %)\",\"Value\":\"<Value Set as Threshold>\",\"Timestamp\":\"<Timestamp string Eg: April 25, 2024 9:33 PM (UTC +5)>\",\"PolicyName\":\"<Alert Policy Name>\",\"Description\":\"<Alert Policy Description>\",\"Scope\":\"DeliveryGroup\",\"Site\":\"<Name of the Site>\",\"AttachmentData\":[{\"MachineName\":\"<Name of the Machine>\",\"IPAddress\":\"<IP Address>\",\"DeliveryGroupName\":\"<Name of the DeliveryGroup>\",\"CurrentRegistrationState\":\"Unregistered\",\"FailureDate\":\"<Date of Failure>\",\"FaultState\":\"<Fault State of the Machine>\",\"LifecycleState\":\"<Lifecycle state of the Machine>\"},{\"MachineName\":\"<Name of the Machine>\",\"IPAddress\":\"<IP Address>\",\"DeliveryGroupName\":\"<Name of the DeliveryGroup>\",\"CurrentRegistrationState\":\"Unregistered\",\"FailureDate\":\"<Date of Failure>\",\"FaultState\":\"<Fault State of the Machine>\",\"LifecycleState\":\"<Lifecycle state of the Machine>\"}]}"
}
<!--NeedCopy-->
Failed power on actions Alert
{
  "text": "{\"Address\":\"<Webhook URL>\",\"NotificationId\":\"<NotificationGUID>\",\"NotificationState\":\"NotificationActive\",\"Priority\":\"<Critical/Warning>\",\"Target\":\"<DeliveryGroupName>\",\"Condition\":\"Failure To PowerOn Action\",\"Value\":\"<Value Set as Threshold>\",\"Timestamp\":\"<Timestamp string Eg: April 25, 2024 9:33 PM (UTC +5)>\",\"PolicyName\":\"<Alert Policy Name>\",\"Description\":\"<Alert Policy Description>\",\"Scope\":\"DeliveryGroup\",\"Site\":\"<Name of the Site>\",\"AttachmentData\":[{\"MachineName\":\"<Name of the Machine>\",\"IPAddress\":\"<IP Address>\",\"DeliveryGroupName\":\"<Name of the DeliveryGroup>\",\"LastPowerActionFailureReason\":\"<HypervisorReportedFailure, HypervisorRateLimitExceeded, UnknownError, Power Action Type>\",\"LastPowerActionTriggeredBy\":\"<End-User, Administrator, Auto-Scale, Schedule>\",\"LastPowerActionType\":\"<PowerOn/PowerOff>\",\"LastPowerActionCompletedDate\":\"<Time string Eg: 2024-05-15T15:04:27.723>\"},{\"MachineName\":\"<Name of the Machine>\",\"IPAddress\":\"<IP Address>\",\"DeliveryGroupName\":\"<Name of the DeliveryGroup>\",\"LastPowerActionFailureReason\":\"<HypervisorReportedFailure, HypervisorRateLimitExceeded, UnknownError, Power Action Type>\",\"LastPowerActionTriggeredBy\":\"<End-User, Administrator, Auto-Scale, Schedule>\",\"LastPowerActionType\":\"<PowerOn/PowerOff>\",\"LastPowerActionCompletedDate\":\"<Time string Eg: 2024-05-15T15:04:27.723>\"}]}"
}
<!--NeedCopy-->
Failed power off actions Alert
{
  "text": "{\"Address\":\"<Webhook URL>\",\"NotificationId\":\"<NotificationGUID>\",\"NotificationState\":\"NotificationActive\",\"Priority\":\"<Critical/Warning>\",\"Target\":\"<DeliveryGroupName>\",\"Condition\":\"Failure To PowerOff Action\",\"Value\":\"<Value Set as Threshold>\",\"Timestamp\":\"<Timestamp string Eg: April 25, 2024 9:33 PM (UTC +5)>\",\"PolicyName\":\"<Alert Policy Name>\",\"Description\":\"<Alert Policy Description>\",\"Scope\":\"DeliveryGroup\",\"Site\":\"<Name of the Site>\",\"AttachmentData\":[{\"MachineName\":\"<Name of the Machine>\",\"IPAddress\":\"<IPV4 Address of the Machine>\",\"DeliveryGroupName\":\"<Name of the DeliveryGroup>\",\"LastPowerActionFailureReason\":\"<HypervisorReportedFailure,HypervisorRateLimitExceeded,UnknownError,Power Action Type>\",\"LastPowerActionTriggeredBy\":\"<End-User,Administrator,Auto-Scale,Schedule>\",\"LastPowerActionType\":\"<PowerOn/PowerOff>\",\"LastPowerActionCompletedDate\":\"<Time string Eg: 2024-05-15T15:04:27.723>\"},{\"MachineName\":\"<Name of the Machine>\",\"IPAddress\":\"<IPV4 Address of the Machine>\",\"DeliveryGroupName\":\"<Name of the DeliveryGroup>\",\"LastPowerActionFailureReason\":\"<HypervisorReportedFailure,HypervisorRateLimitExceeded,UnknownError,Power Action Type>\",\"LastPowerActionTriggeredBy\":\"<End-User,Administrator,Auto-Scale,Schedule>\",\"LastPowerActionType\":\"<PowerOn/PowerOff>\",\"LastPowerActionCompletedDate\":\"<Time string Eg: 2024-05-15T15:04:27.723>\"}]}"
}

<!--NeedCopy-->
Machine Uptime alert
{
  "text": "{\"Address\":\"<Webhook URL>\",\"NotificationId\":\"<NotificationGUID>\",\"NotificationState\":\"NotificationActive\",\"Priority\":\"<Critical/Warning>\",\"Target\":\"<DeliveryGroupName>\",\"Condition\":\"Machine Uptime Alert\",\"Value\":\"<Value Set as Threshold>\",\"Timestamp\":\"<Timestamp string Eg: April 25, 2024 9:33 PM (UTC +5)>\",\"PolicyName\":\"<Alert Policy Name>\",\"Description\":\"<Alert Policy Description>\",\"Scope\":\"DeliveryGroup\",\"Site\":\"<Name of the Site>\",\"AttachmentData\":[{\"MachineName\":\"<Name of the Machine>\",\"IPAddress\":\"<IP Address>\",\"DeliveryGroupName\":\"<Name of the DeliveryGroup>\",\"PowerState\":\"<On/Off>\",\"PoweredOnDate\":\"2024-05-15T15:04:27.723\",\"TotalUptimeInMinutes\":180},{\"MachineName\":\"<Name of the Machine>\",\"IPAddress\":\"<IP Address>\",\"DeliveryGroupName\":\"<Name of the DeliveryGroup>\",\"PowerState\":\"<ON/OFF>\",\"PoweredOnDate\":\"2024-05-15T15:04:27.723\",\"TotalUptimeInMinutes\":\"<Uptime Duration>\"}]}"
}

<!--NeedCopy-->
Alerts policies conditions
Find below the alert categories, recommended actions to mitigate the alert, and built-in policy conditions if defined. The built-in alert policies are defined for alert and realert intervals of 60 minutes.
Peak Connected Sessions
- Check the Monitor Session Trends view for peak connected sessions.
- Check to ensure that there is enough capacity to accommodate the session load.
- Add new machines if needed
Peak Disconnected Sessions
- Check the Monitor Session Trends view for peak disconnected sessions.
- Check to ensure that there is enough capacity to accommodate session load.
- Add new machines if needed.
- Log off disconnected sessions if needed
Peak Concurrent Total Sessions
- Check the Monitor Session Trends view in Monitor for peak concurrent sessions.
- Check to ensure that there is enough capacity to accommodate session load.
- Add new machines if needed.
- Log off disconnected sessions if needed
CPU
Percentage of CPU usage indicates the overall CPU consumption on the VDA, including that of the processes. You can get more insight into the CPU utilization by individual processes from the Machine details page of the corresponding VDA.
- Go to Machine Details > View Historical Utilization > Top 10 Processes, identify the processes consuming the CPU. Ensure that the process monitoring policy is enabled to initiate collection of process level resource usage statistics.
- End the process if necessary.
- Ending the process causes unsaved data to be lost.
-
If all is working as expected, add more CPU resources in the future.
Note:
The policy setting, Enable resource monitoring is allowed by default for the monitoring of CPU and memory performance counters on machines with VDAs. If this policy setting is disabled, alerts with CPU and memory conditions are not triggered. For more information, see Monitoring policy settings.
Smart policy conditions:
- Scope: Delivery group, Multi-session OS scope
- Threshold values: Warning - 80%, Critical - 90%
Memory
Percentage of Memory usage indicates the overall memory consumption on the VDA, including that of the processes. You can get more insight into the memory usage by individual processes from the Machine details page of the corresponding VDA.
- Go to Machine Details > View Historical Utilization > Top 10 Processes, identify the processes consuming memory. Ensure that the process monitoring policy is enabled to initiate collection of process level resource usage statistics.
- End the process if necessary.
- Ending the process causes unsaved data to be lost.
-
If all is working as expected, add more memory in the future.
Note:
The policy setting Enable resource monitoring, is allowed by default for the monitoring of CPU and memory performance counters on machines with VDAs. If this policy setting is disabled, alerts with CPU and memory conditions aren’t triggered. For more information, see Monitoring policy settings.
Smart policy conditions:
- Scope: Delivery group, Multi-session OS scope
- Threshold values: Warning - 80%, Critical - 90%
Connection Failure Rate
Percentage of connection failures over the last hour.
- Calculated based on the total failures to total connections attempted.
- Check the Monitor Connection Failures Trends view for events logged from the Configuration log.
- Determine if applications or desktops are reachable.
Connection Failure Count
Number of connection failures over the last hour.
- Check the Monitor Connection Failures Trends view for events logged from the Configuration log.
- Determine if applications or desktops are reachable.
ICA® RTT (Average)
Average ICA round-trip time.
- Check Citrix ADM for a breakdown of the ICA RTT to determine the root cause. For more information, see the Citrix ADM documentation.
- If Citrix ADM is not available, check the Monitor User Details view for the ICA RTT and Latency, and determine if it is a network problem or an issue with applications or desktops.
ICA RTT (No. of Sessions)
Number of sessions that exceed the threshold ICA round-trip time.
- Check Citrix ADM for the number of sessions with high ICA RTT. For more information, see the Citrix ADM documentation.
-
If Citrix ADM isn’t available, contact the network team to determine the root cause.
Smart policy conditions:
- Scope: Delivery group, Multi-session OS scope
- Threshold values: Warning - 300 ms for 5 or more sessions, Critical - 400 ms for 10 or more sessions
ICA RTT (% of Sessions)
Percentage of sessions that exceed the average ICA round-trip time.
- Check Citrix ADM for the number of sessions with high ICA RTT. For more information, see the Citrix ADM documentation.
- If Citrix ADM is not available, contact the network team to determine the root cause.
ICA RTT (User)
ICA round-trip time that is applied to sessions launched by the specified user. The alert is triggered if ICA RTT is greater than the threshold in at least one session.
Failed Machines (Single session OS)
Number of failed Single session OS machines. Failures can occur for various reasons as shown in the Monitor Dashboard and Filters views.
-
Run Citrix Scout diagnostics to determine the root cause. For more information, see Troubleshoot user issues.
Smart policy conditions:
- Scope: Delivery group scope
- Threshold values: Warning - 1, Critical - 2
Failed Machines (Multi-session OS)
Number of failed Multi-session OS machines. Failures can occur for various reasons as shown in the Monitor Dashboard and Filters views.
-
Run Citrix Scout diagnostics to determine the root cause.
Smart policy conditions:
- Scope: Delivery group, Multi-session OS scope
- Threshold values: Warning - 1, Critical - 2
Failed Machines (in %)
The percentage of failed single-session and multi-session OS machines in a delivery group calculated based on the number of failed machines. This alert condition allows you to configure alert thresholds as a percentage of failed machines in a delivery group and is calculated every 30 seconds. Failures can occur for various reasons as shown in the Monitor Dashboard and Filters views. Run Citrix Scout diagnostics to determine the root cause. For more information, see Troubleshoot user issues.
Failed power on action and Failed Power off action
Number of failed power on actions and number of failed power off actions in a delivery group calculated based on number of Power Managed Machines that failed to power on or off. This alert condition allows you to configure alert thresholds as the number of Power Managed Machines that failed to power on or off in a delivery group and is calculated every 30 minutes.
Admin can configure the following parameters for these alerts in the Advanced alert policy:
- Triggered By: What triggered the power action
- Reason Of failure: Why the action failed
- Threshold: Threshold number of machines that failed power action to trigger the policy
- Sampling interval: The interval In which the failed power action has to be checked
- Re-alert interval: After how much time the alert must be re-sent
Failures can occur for various reasons as shown in the Monitor Dashboard and Filters views. Run Citrix Scout diagnostics to determine the root cause. For more information, see Troubleshoot user issues.
Unregistered machines (in %)
A machine is considered unregistered, when a machine becomes unstable due to a restart or when there is a communication problem between the delivery controller™ and the virtual machines. The Unregistered machines (in %) is the percentage of unregistered single-session and multi-session OS machines in a delivery group calculated based on the number of unregistered machines. This alert condition allows you to configure warning and critical threshold values as a percentage of unregistered machines in a delivery group. You can set an interval for re-alert. You can also add an email to get a notification when the conditions are met for Unregistered Machines (in %). When the critical or warning threshold value is exceeded, alerts and emails are generated. You can view alerts under Citrix Alerts. You can filter it by Unregistered Machines (in %) category and for the required state and time.
Note:
The critical value must be greater than the warning value.
Policy conditions:
- Scope: Single-session OS, and Multi-session OS Delivery group
- Threshold values: Warning and Critical
Machine uptime alert
Machine uptime in a delivery group is calculated based on the number of hours per day, hours per week, or hours per month for a machine that is turned on in a delivery group. This alert condition allows you to configure alert thresholds as the hours a machine is turned on in a delivery group. The machine uptime alerts works as follows in case of:
- Hours per day - You can specify the number of hours a machine is turned on for a day and is calculated every 30 minutes. The maximum number of hours per day that you can set is 24 hours.
- Hours per week - You can specify the number of hours a machine is turned on for a week and is calculated every six hours. The maximum number of hours per week that you can set is 168 hours.
- Hours per month - You can specify the number of hours a machine is turned on for a month and is calculated once every day. The maximum number of hours per month is 720 hours. The minimum re-alert interval value that you can set is 60 minutes. You can enter the number of machines that cross the machine uptime threshold value under the Warning and Critical alerts section. You can also add exceptions for any machines.
For example, if there are five delivery groups added for this alert and if in the first delivery group and fourth delivery group, the number of machines crosses the warning or critical threshold values, the alert is triggered separately for the first delivery group and for the fourth delivery group.
This alert helps the admins to analyze the uptime of the machines and based on this analysis the admins can help in optimizing the cost. You can also receive alert details in a CSV attachment in an email or through a JSON payload in case of a webhook.
Average Logon Duration
Average logon duration for logons that occurred over the last hour.
- Check the Monitor Dashboard to get up-to-date metrics regarding the logon duration. A large number of users logging in during a short timeframe can increase the logon duration.
-
Check the baseline and break down of the logons to narrow down the cause. For more information, see Diagnose user logon issues.
Smart policy conditions:
- Scope: Delivery group, Multi-session OS scope
- Threshold values: Warning - 45 seconds, Critical - 60 seconds
Logon Duration (User)
Logon duration for logons for the specified user that occurred over the last hour.
Load Evaluator Index
Value of the Load Evaluator Index over the last 5 minutes.
-
Check Monitor for Multi-session OS Machines that might have a peak load (Max load). View both Dashboard (failures) and Trends Load Evaluator Index report.
Smart policy conditions:
- Scope: Delivery group, Multi-session OS scope
- Threshold values: Warning - 80%, Critical - 90%
Configure alerts policies with webhooks
Apart from email notifications, you can configure alerts policies with webhooks.
Note: This feature requires Delivery Controller(s) version 7.11 or later.
You can configure an alert policy with an HTTP callback or an HTTP POST using PowerShell cmdlets. They are extended to support webhooks.
For information on the creation of a new Octoblu workflow and obtaining the corresponding webhook URL, see the Octoblu Developer Hub.
To configure a webhook URL for a new alert policy or for an existing policy, use the following PowerShell cmdlets.
Create alerts policy with a webhook URL:
$policy = New-MonitorNotificationPolicy -Name <Policy name> -Description <Policy description> -Enabled $true -Webhook <Webhook URL>
<!--NeedCopy-->
Add a webhook URL to an existing alerts policy:
Set-MonitorNotificationPolicy - Uid <Policy id> -Webhook <Webhook URL>
<!--NeedCopy-->
For help on the PowerShell commands, use the PowerShell help, for example:
Get-Help  <Set-MonitorNotificationPolicy>
<!--NeedCopy-->
Notifications generated from the alert policy trigger the webhook with a POST call to the webhook URL. The POST message contains the notification information in JSON format:
{"NotificationId" : \<Notification Id\>,

"Target" : \<Notification Target Id\>,

"Condition" : \<Condition that was violated\>,

"Value" : \<Threshold value for the Condition\>,

"Timestamp": \<Time in UTC when notification was generated\>,

"PolicyName": \<Name of the Alert policy\>,

"Description": \<Description of the Alert policy\>,

"Scope" : \<Scope of the Alert policy\>,

"NotificationState": \<Notification state critical, warning, healthy or dismissed\>,

"Site" : \<Site name\>}
<!--NeedCopy-->
Configure alerts policies with ServiceNow
You can configure alert policies to send notifications directly to ServiceNow (SNOW), enabling seamless integration with your IT Service Management (ITSM) workflows. This integration allows alerts generated in Citrix Monitor to be automatically forwarded to ServiceNow for centralized tracking, escalation, and incident resolution.
Benefits of ServiceNow integration
- Unified alert management: Create, update, and manage ServiceNow incidents directly within the Citrix Monitor interface without switching between systems.
- Automatic ITSM configuration: Monitor automatically retrieves the required ServiceNow configuration, such as webhook URLs, reducing manual setup complexity.
- Streamlined incident response: Alerts are forwarded to ServiceNow for centralized incident tracking and resolution, improving operational efficiency.
Prerequisites
Before configuring ServiceNow integration, ensure the following:
- A ServiceNow instance is configured in the ITSM Adapter service.
- You have the necessary permissions to manage alert policies in Monitor.
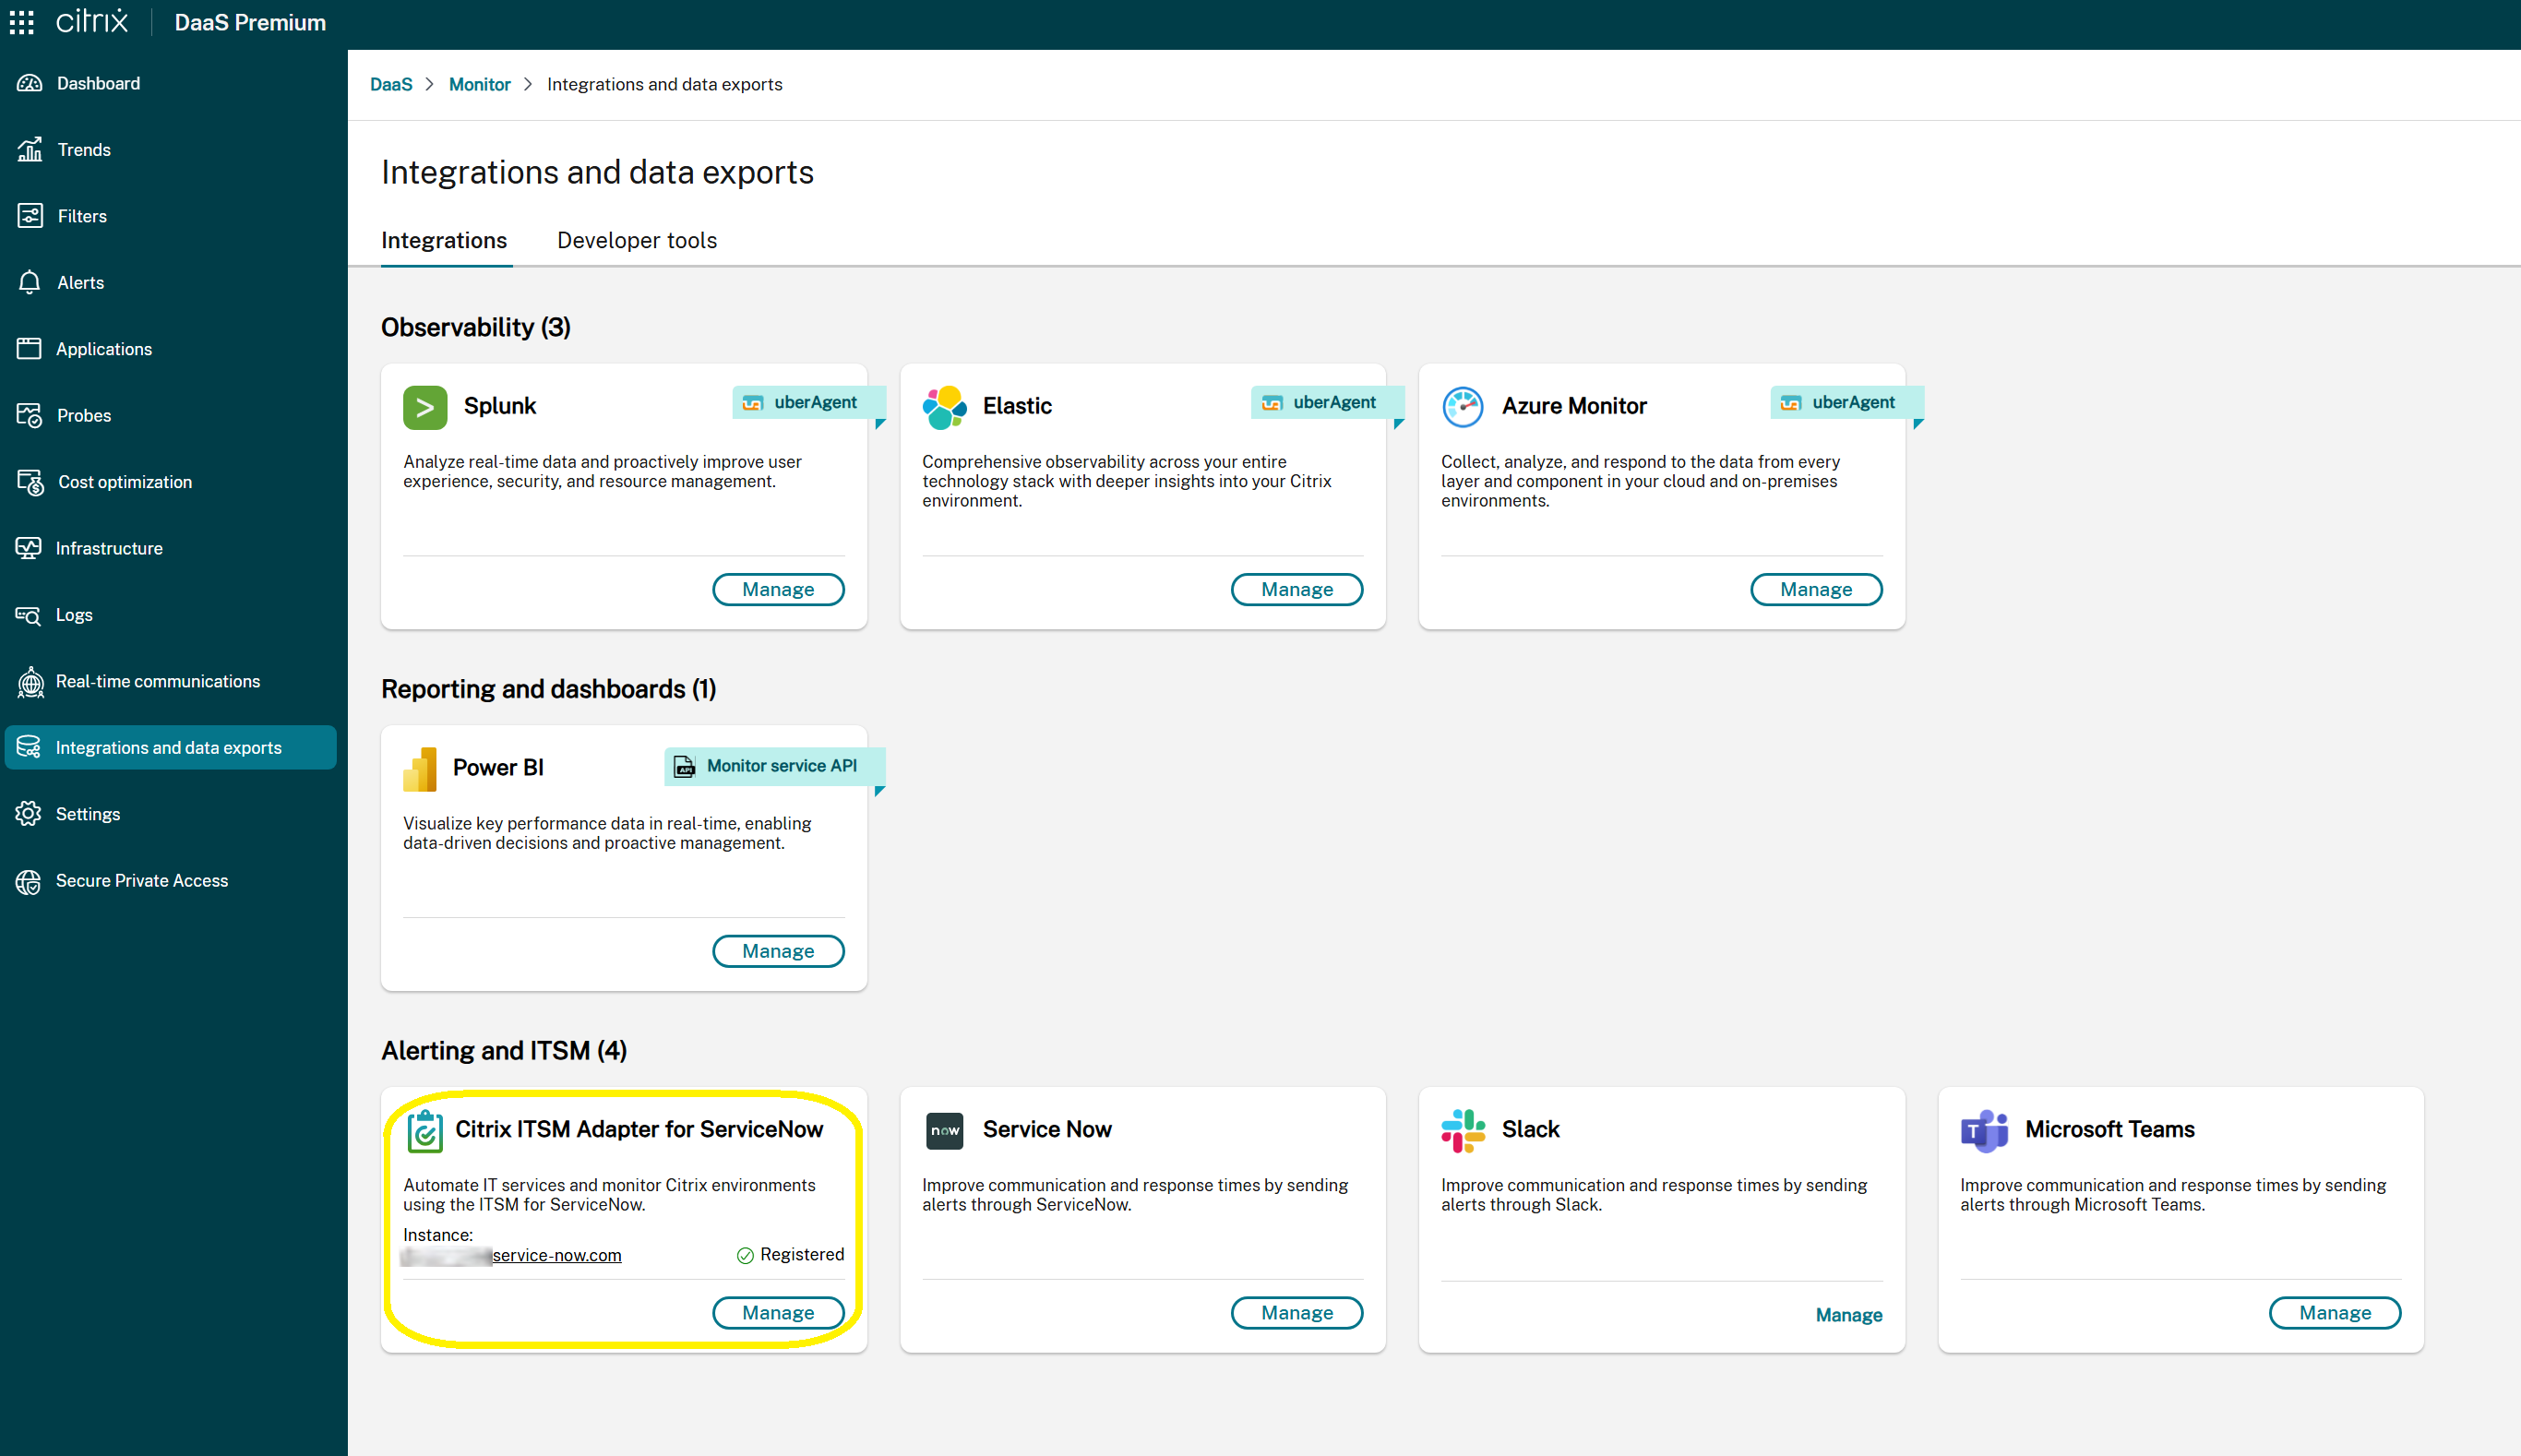
Check ServiceNow integration status
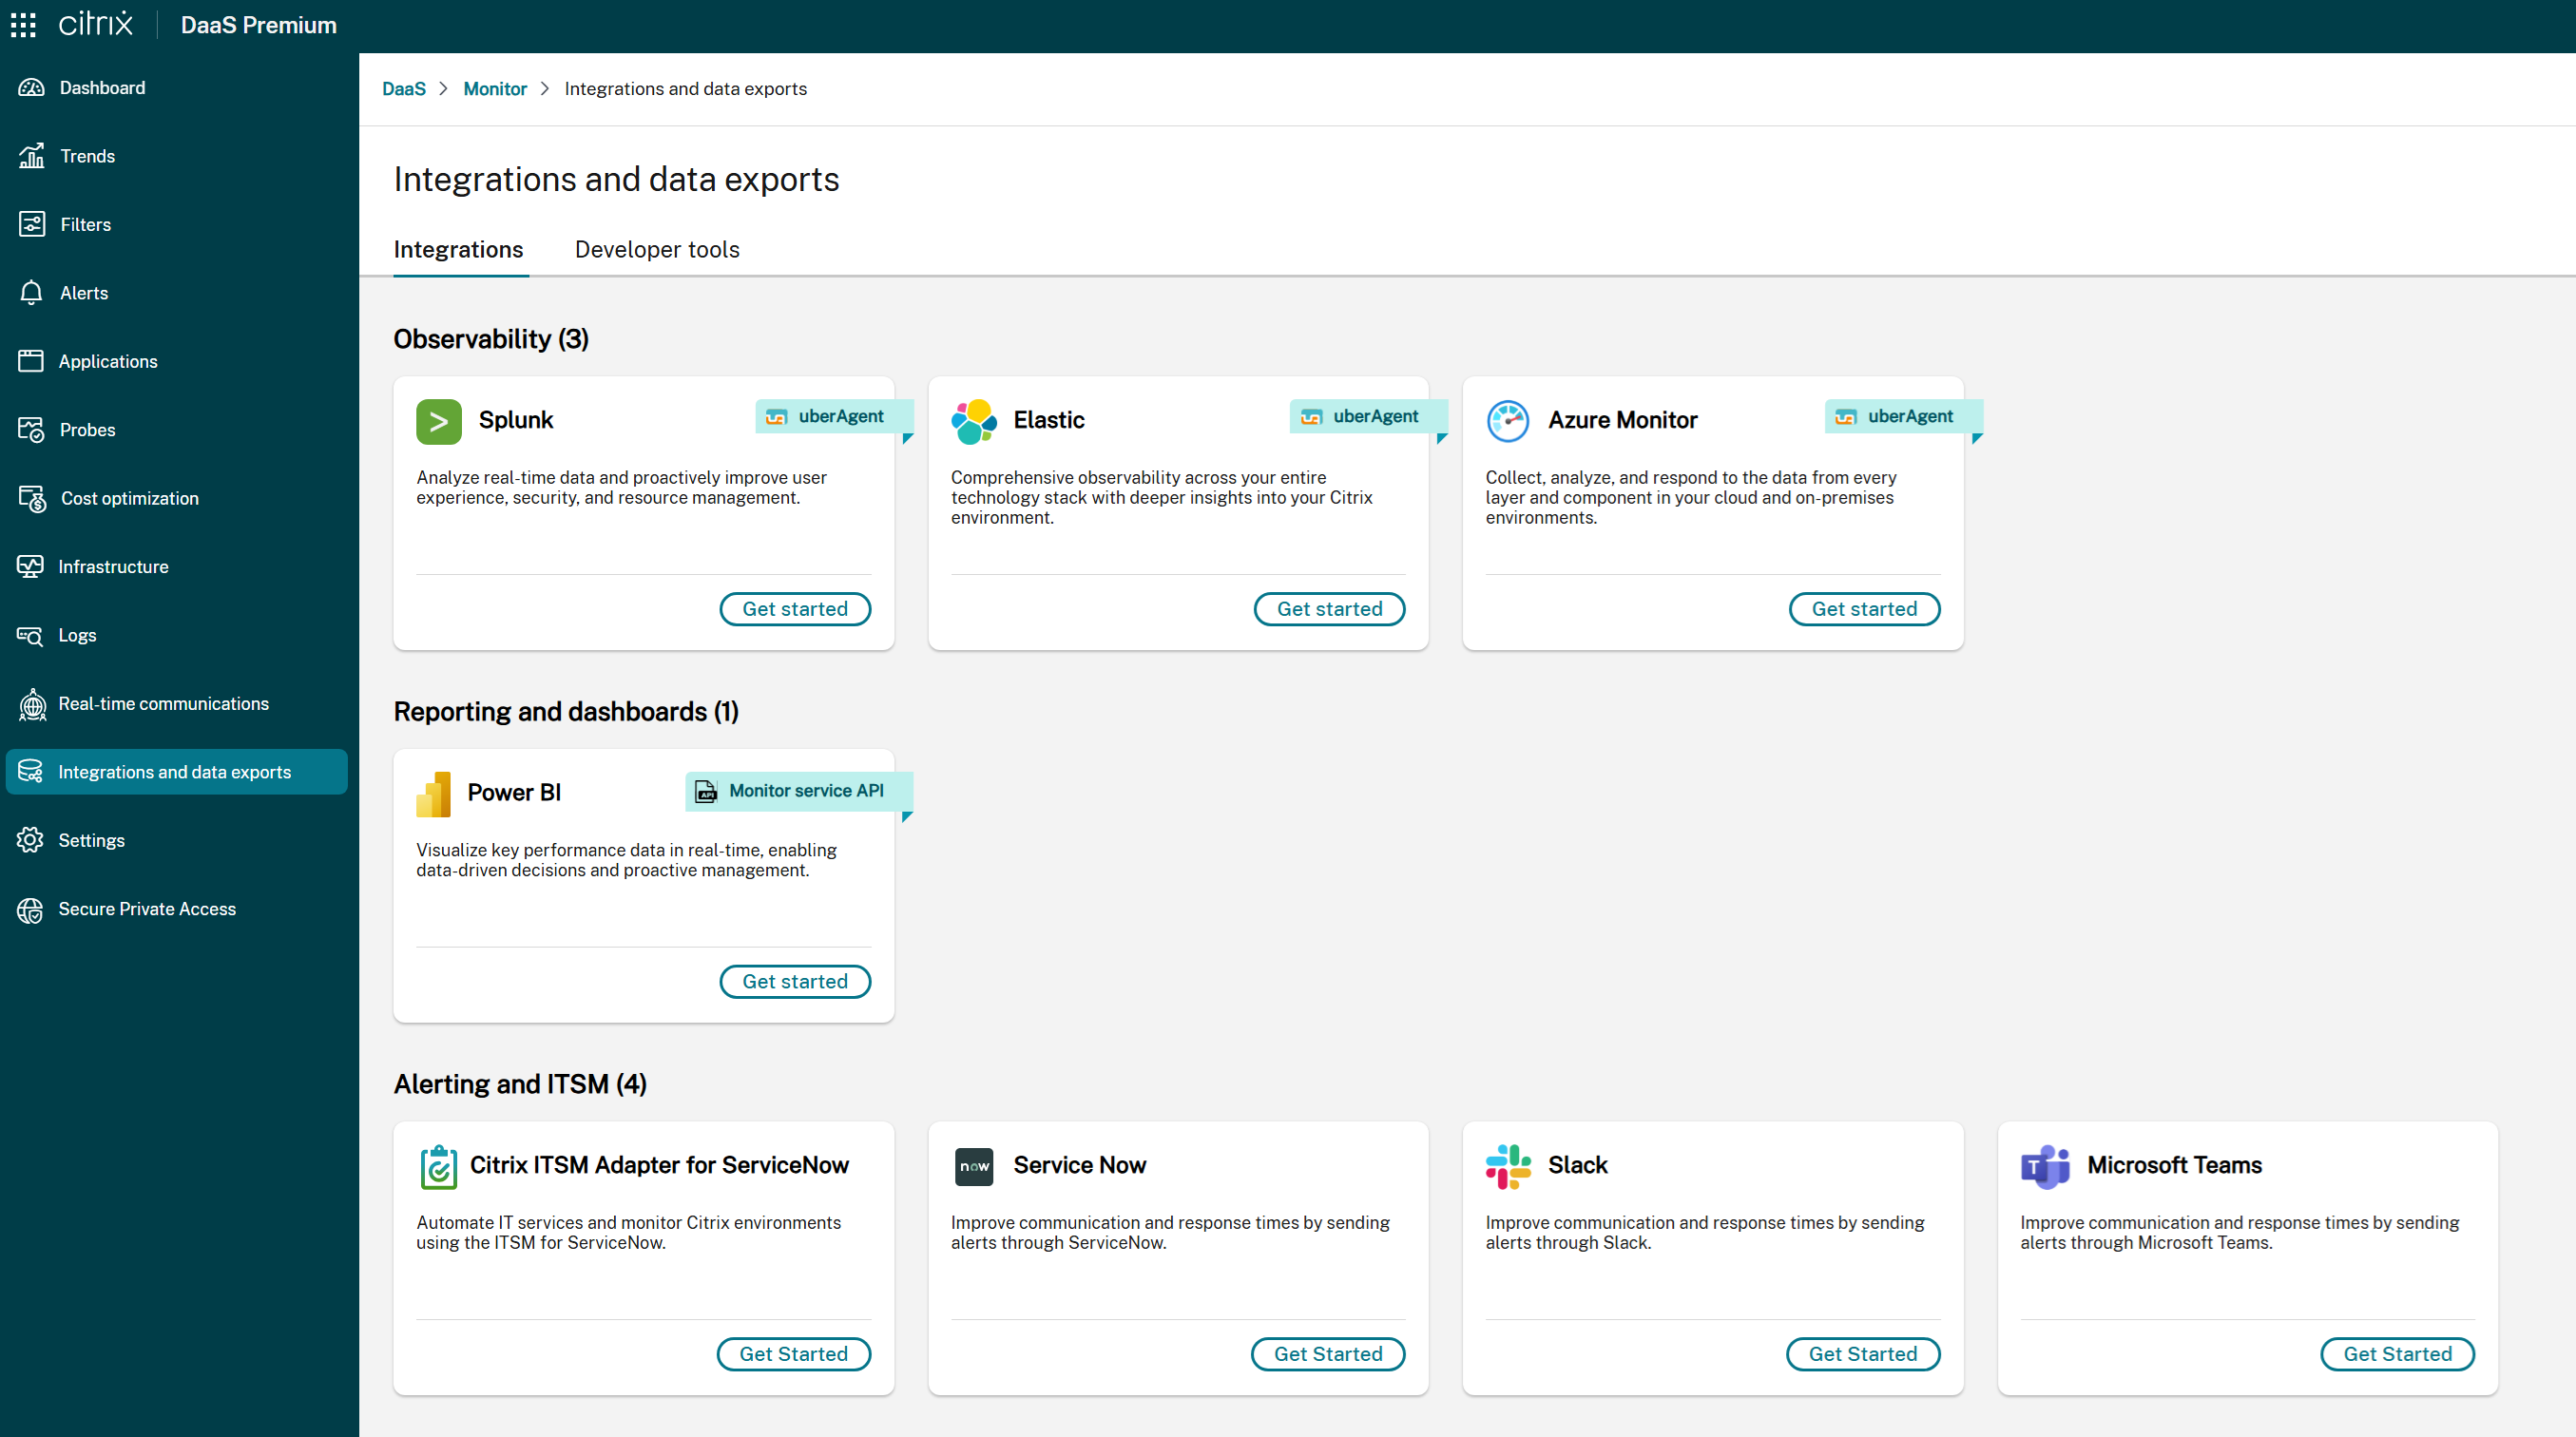
You can view the integration status with the ITSM Adapter service on the Monitor > Integrations and Data Exports page. This page displays:
- The current integration status:
- Get Started: Indicates that the ITSM Adapter integration has not been configured. Select this option to begin the initial setup process.
- Manage: Indicates that the ITSM Adapter integration is active and operational. Select this option to view or modify your ServiceNow integration settings.
- The associated ServiceNow instance URL (visible only when a ServiceNow instance has been configured in the ITSM Adapter).
Configure an alert policy with ServiceNow notifications
To configure an alert policy to send notifications to ServiceNow:
- Go to Alerts > Citrix Alerts Policy and select the policy category (for example, Multi-session OS Policy).
- Click Create to create a new policy or select an existing policy and click Edit.
- Configure the policy conditions as required.
-
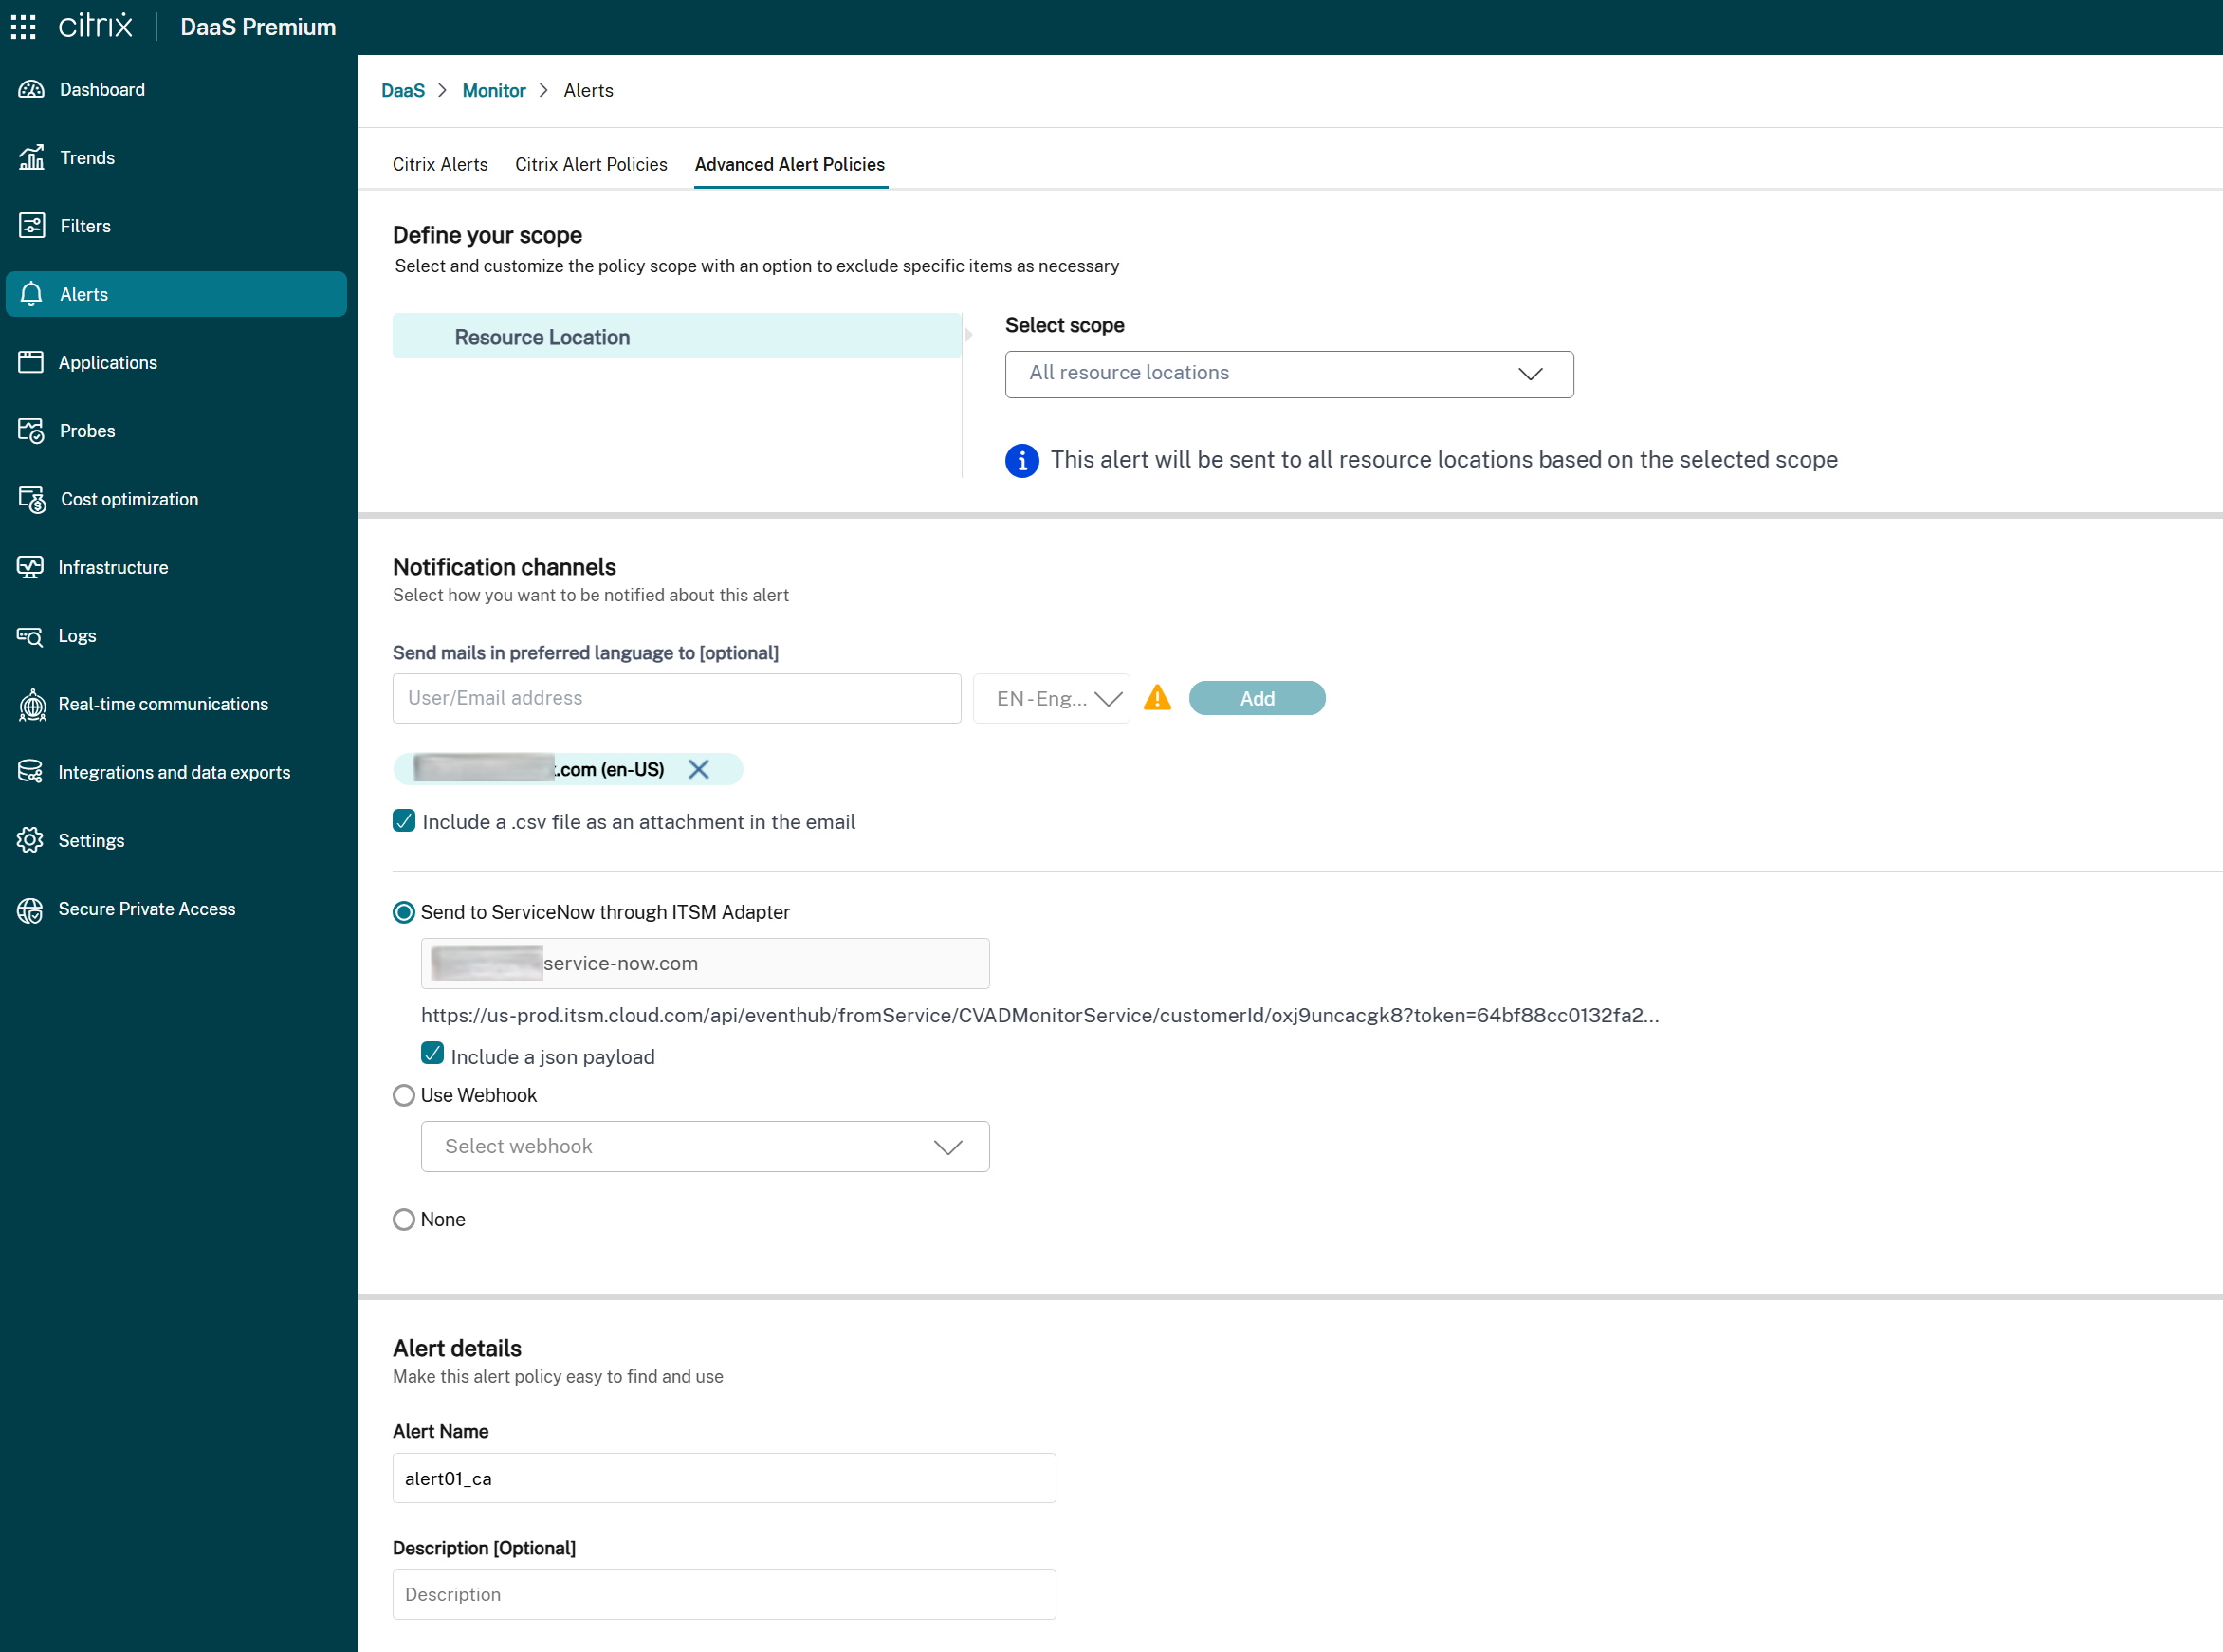
In the Notification preferences section, look for the ServiceNow Integration option:
-
If the ITSM Adapter is available:
- Select the checkbox to enable alert notifications via ServiceNow for this policy.
- The associated ServiceNow instance URL is displayed for reference.
- If the policy already has a webhook configured, a warning message informs you that enabling ServiceNow integration overrides the existing webhook configuration.
-
If the ITSM Adapter is not available:
- A message indicates that ITSM integration is not currently configured.
- Click Get Started to access integration setup. For details, refer to the documentation.
-
If the ITSM Adapter is available:
- Click Save to save the policy.
Once configured, alerts that meet the policy conditions are automatically forwarded to ServiceNow, where they can be managed as incidents or events based on your ITSM configuration.
Bulk alert dismissal
This feature optimizes the alert management process for administrators, providing flexibility and reducing alert fatigue. Administrators can bulk dismiss alerts based on time, type, or category, simplifying alert management during maintenance or when dealing with hypervisors and other environments.
Bulk dismissal of alerts helps administrators manage their workload efficiently and prevents them from being overwhelmed by a high volume of alerts.
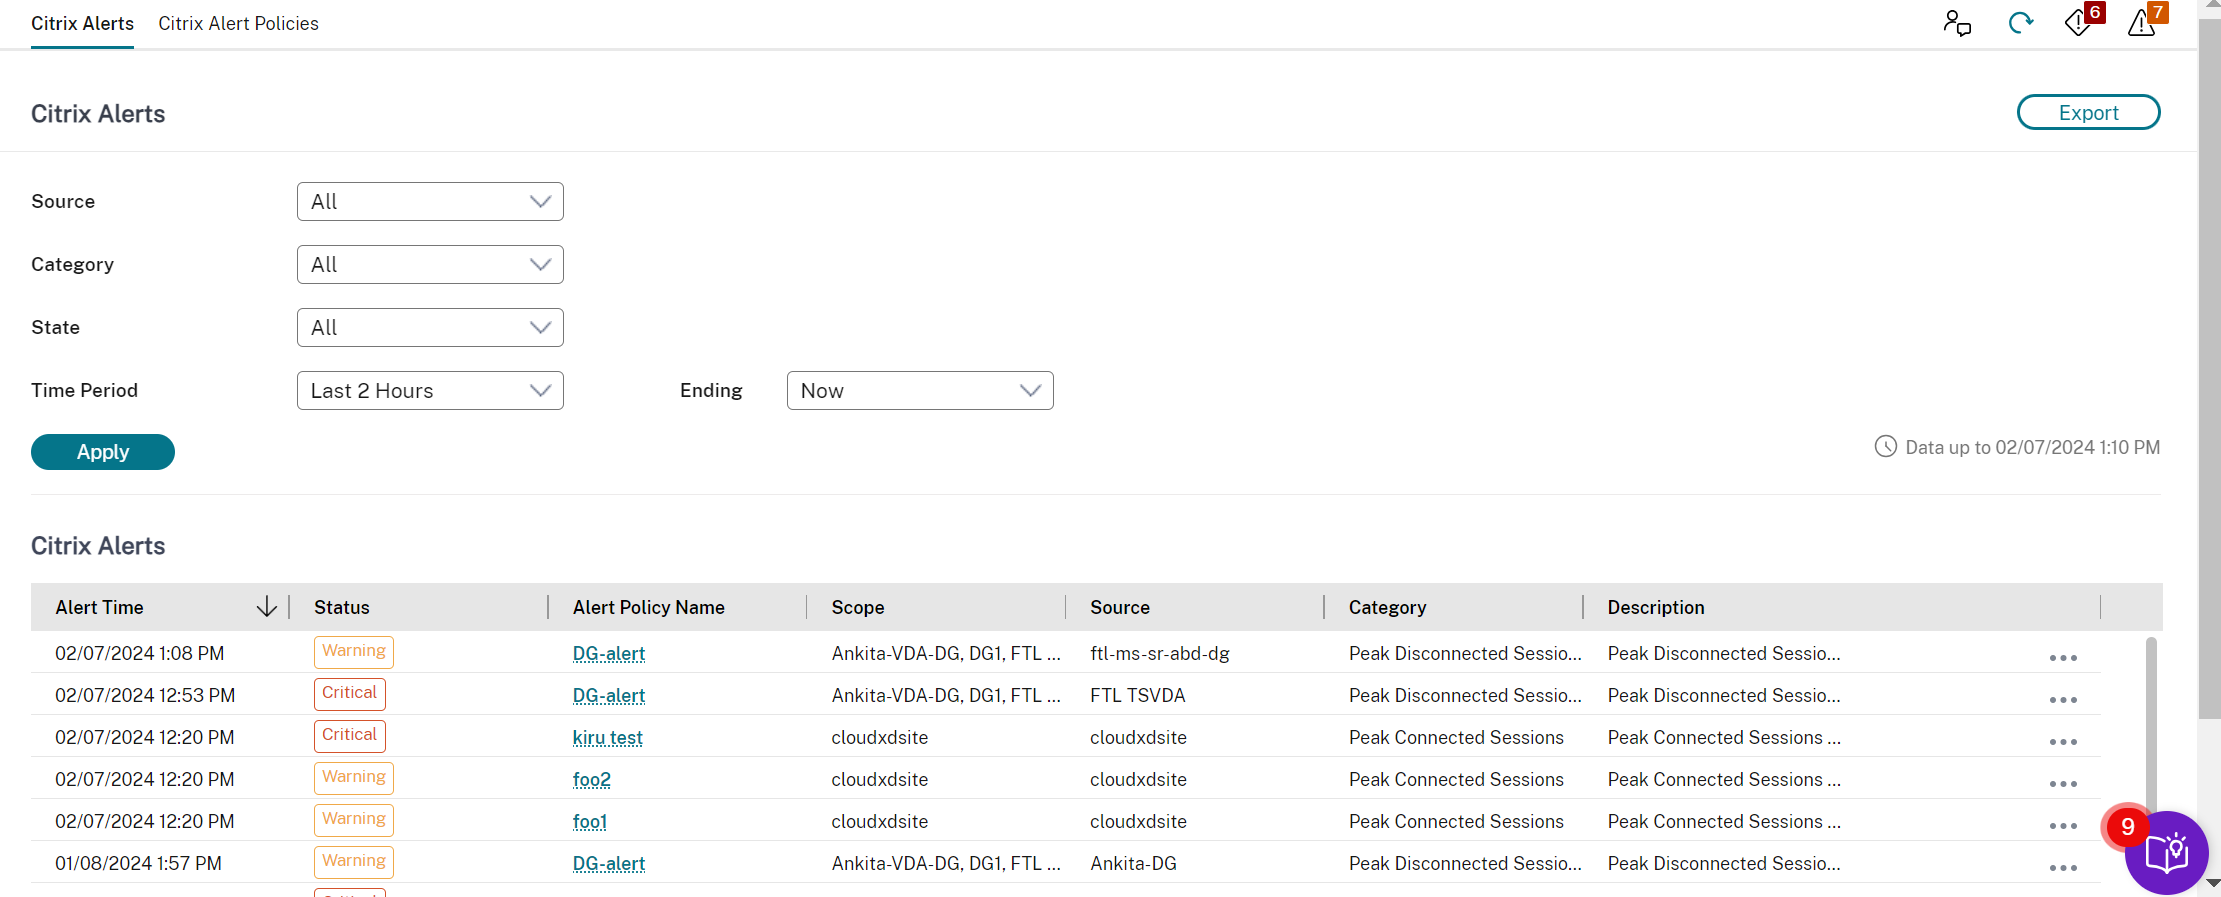
Steps to bulk dismiss alerts
-
Navigate to the Alerts > Citrix Alerts tab. The alerts are displayed.
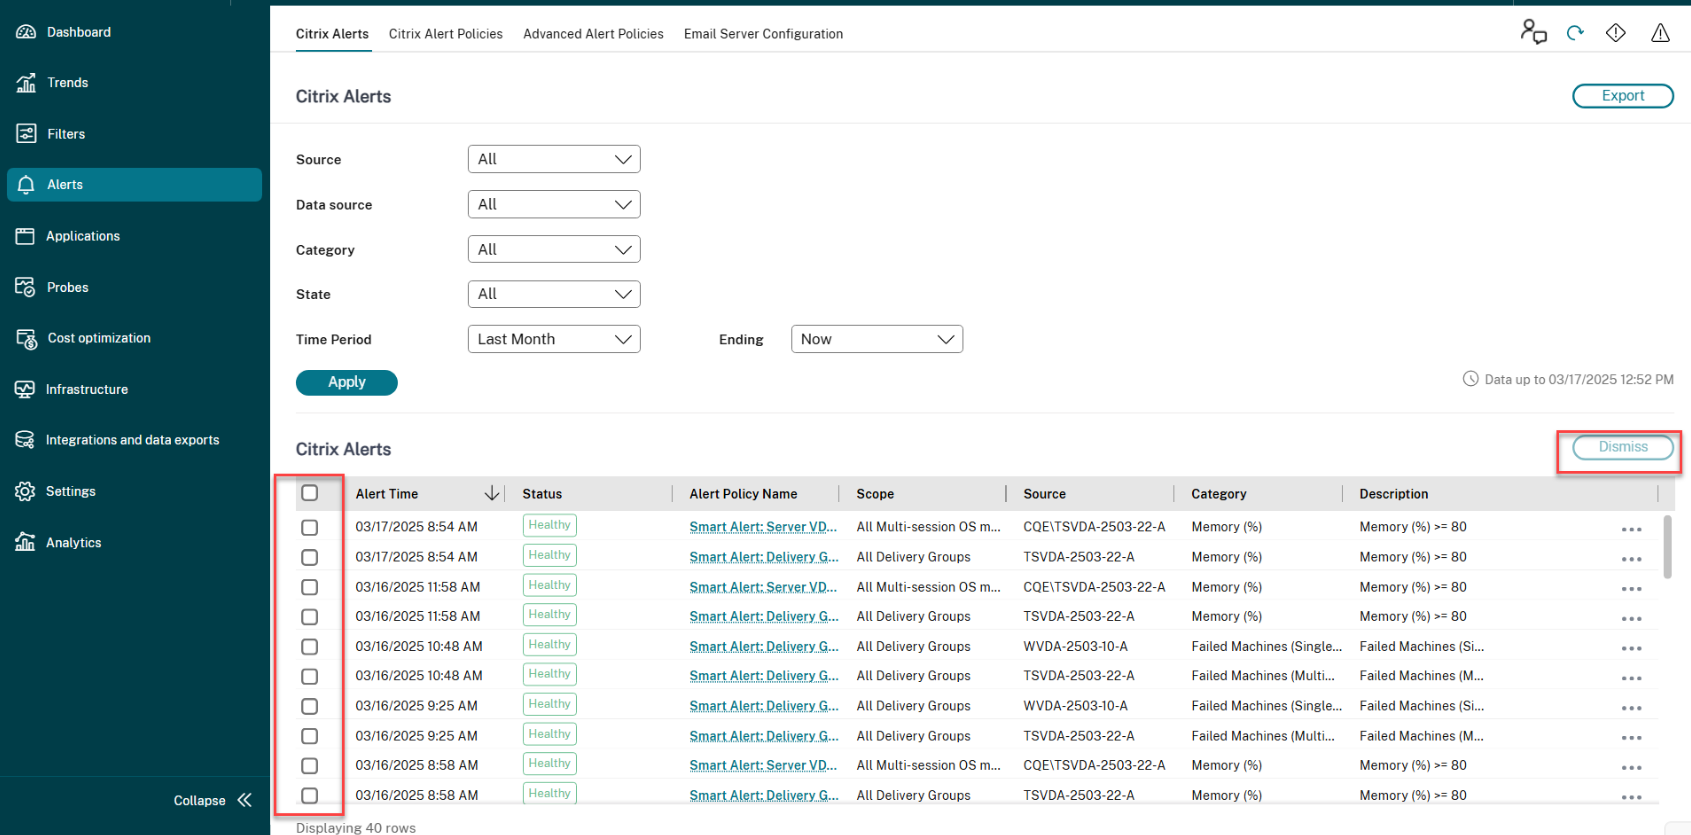
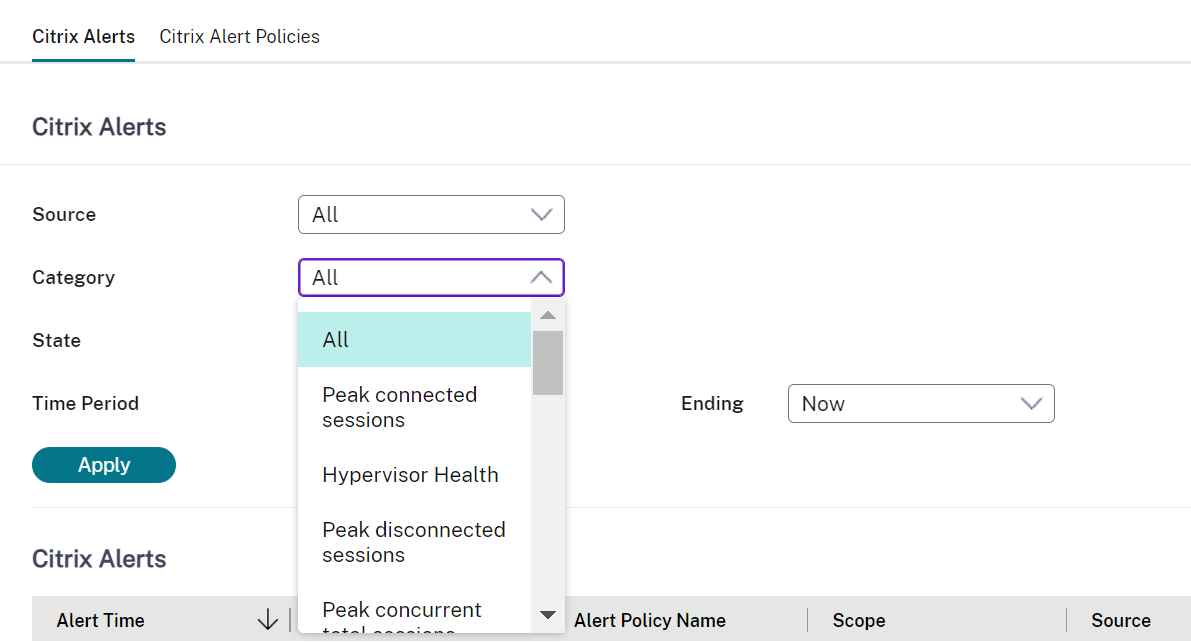
- Select an option from the Source, Category, State, or Time Period to filter the alerts that you want to dismiss. The specific alerts are displayed.
- Select the checkbox next to a specific alert or at the top to select all alerts.
- Click Dismiss. A notification appears to confirm the dismissal of alerts.
- Click Yes. The selected alerts are marked as dismissed, and the status of the alert is updated accordingly.
Webhook configuration using PowerShell SDK
The webhook configuration feature using PowerShell SDK allows administrators to create, modify, delete, and list webhook profiles. This feature provides flexibility in configuring webhooks by allowing the specification of headers, authentication types, content types, payloads, and webhook URLs.
Note:
The supported payload format is text and the end user must enable text in their webhook.
The latest payload format is:
{"text": "This is a message from a Webex incoming webhook."}
<!--NeedCopy-->
Create a webhook
You can use the following sample PowerShell command to create a webhook profile:
Create a webhook without authorization header:
$headers = [System.Collections.Generic.Dictionary[string,string]]::new()

$headers.Add("Content-Type", "application/json")

$payloads = '{ "text": "$PAYLOAD" }'

$url = "<Fill this field with the required URL>"

Add-MonitorWebhookProfile -Name "webhookprofile1" -Description "Description" -Url $url -Headers $headers -PayloadFormat $payloads -Platform Slack -Type Webhook -MethodType POST
<!--NeedCopy-->
Create a webhook with authorization header:
$headers = [System.Collections.Generic.Dictionary[string,string]]::new()

$headers.Add("Content-Type", "application/json")

$headers.Add("Authorization", "Basic <Fill this field with the authorization token>")

$payloads = '{ "text": "$PAYLOAD" }'

$url = "<Fill this field with the required URL>"

Add-MonitorWebhookProfile -Name "webhookprofile1" -Description "Description" -Url $url -Headers $headers -PayloadFormat $payloads -Platform Slack -Type Webhook -MethodType POST
<!--NeedCopy-->
Example:
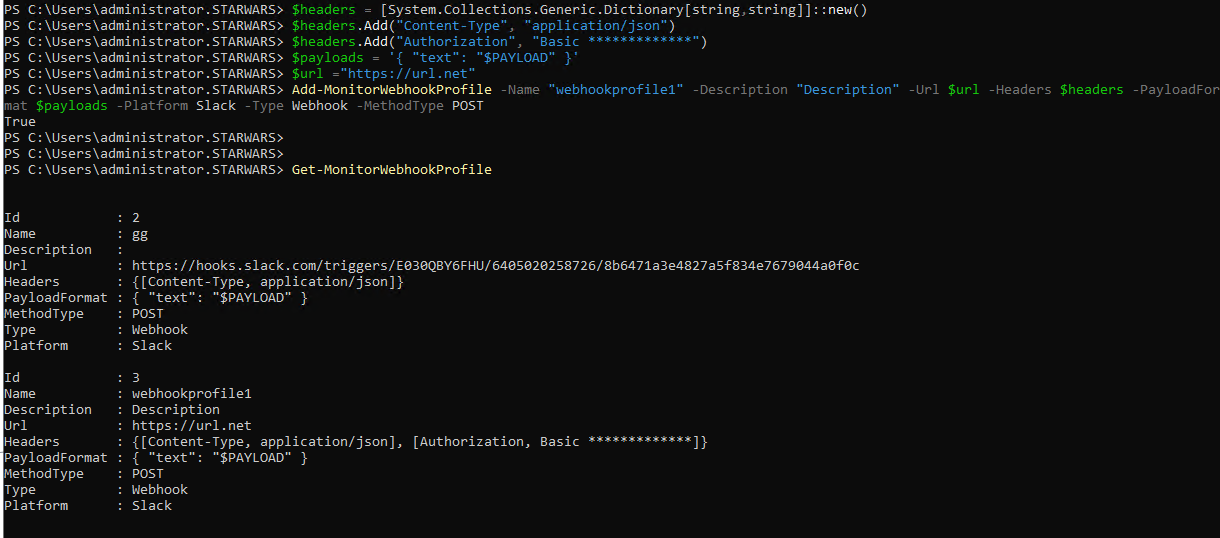
Once the profile is created, you can check it in the database. Also, you can find the newly created webhook profile in the Citrix Alerts page.
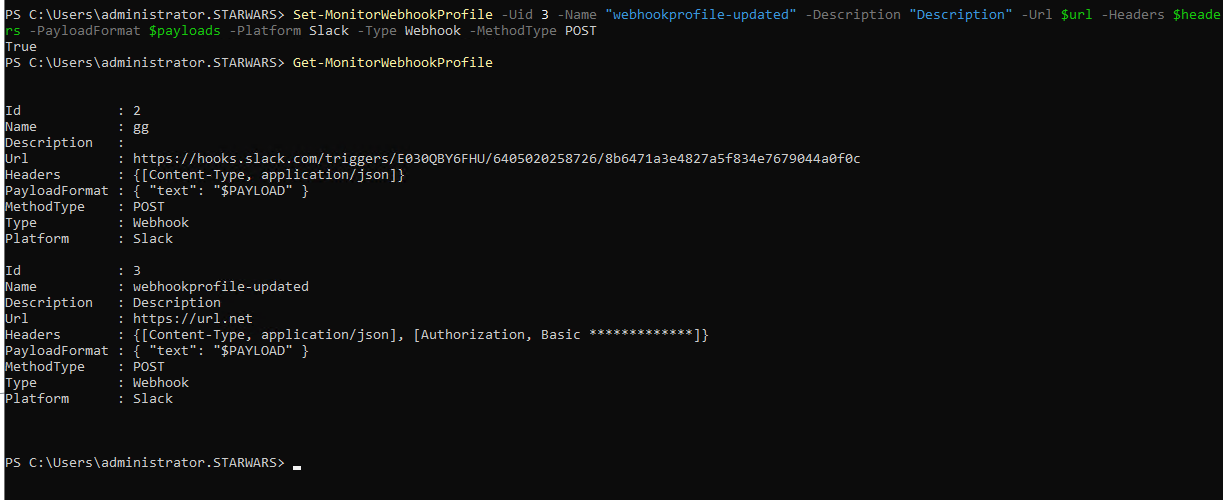
Update a webhook profile
You can use the following sample PowerShell command to update a webhook profile:
$headers = [System.Collections.Generic.Dictionary[string,string]]::new()

$headers.Add("Content-Type", "application/json")

$payloads = '{ "text": "$PAYLOAD" }'

$url =  "<Fill this field with the required URL>"

Set-MonitorWebhookProfile -Uid 1  -Name "profile_slack_citrix" -Description "webhook profile for citrix slack" -Url $url -Headers $headers -PayloadFormat $payloads -Platform Slack -Type Webhook -MethodType POST
<!--NeedCopy-->
Example:
Get a list of all webhook profiles
You can use the following sample PowerShell command to get a list of all available webhook profiles:
Get-MonitorWebhookProfile

Get-MonitorWebhookProfile -Name 'profile_msteams'

Get-MonitorWebhookProfile -Uid 1
<!--NeedCopy-->
Remove a webhook profile
You can use the following sample PowerShell command to remove a webhook profile:
Remove-MonitorWebhookProfile -Uid 1
<!--NeedCopy-->
Note:
If a webhook profile is mapped to any policy, it cannot be removed. As a workaround, you must first remove the webhook mapping from the policy.
Create a policy with webhook profile
You can use the following sample PowerShell command to create a policy with webhook profile:
New-MonitorNotificationPolicy -Name "Policy1" -Description "Policy Description" -Enabled $true -WebhookProfileId 1
<!--NeedCopy-->
Update a policy with webhook profile
You can use the following sample PowerShell command to update a policy with webhook profile:
$Policy = Set-MonitorNotificationPolicy -Uid 1 -WebhookProfileId 1
<!--NeedCopy-->
Remove webhook mapping from a policy
You can use the following sample PowerShell command to remove webhook profile from a policy:
$Policy = Set-MonitorNotificationPolicy -Uid 1 -WebhookProfileId 0
<!--NeedCopy-->
Test webhook profile
You can use the following sample PowerShell command to test the webhook profile:
$headers = [System.Collections.Generic.Dictionary[string,string]]::new()

$headers.Add("Content-Type", "application/json")

$headers.Add("Authorization", "Basic <Fill this with authorization token>")

$payloads = '{ "text": "$PAYLOAD" }'

$url ="<Fill this field with the required URL>"

Test-MonitorWebhookProfile -Url $url -Headers $headers -PayloadFormat $payloads
<!--NeedCopy-->
Local Host Cache config sync failure alert monitoring
Local Host Cache allows user sessions to continue even if Cloud Connectors lose connectivity with Citrix Cloud. The cache used by Local Host Cache is regularly synchronized with the primary database to ensure up-to-date configurations when Local Host Cache mode is activated. You can learn more information about Local Host Cache and the config sync process at Local Host Cache. If the configuration sync fails more than three times consecutively, Citrix Monitor sends a warning alert to the administrator.
A predefined alert policy named Local Host Cache - Config Sync Failure has been introduced in Citrix Monitor to notify administrators about configuration sync failures. You can find the newly introduced policy on Monitor > Citrix Alerts. You can modify the predefined policy to add or edit email recipients or webhooks to receive proactive notifications in your alert management or ITSM tools.
The scope of the Local Host Cache - Config Sync Failure alert policy is limited to the Site only.
Hypervisor Alerts Monitoring
Monitor displays alerts to monitor hypervisor health. Alerts from Citrix Hypervisor™ and VMware vSphere help monitor hypervisor parameters and states. The connection status to the hypervisor is also monitored to provide an alert if the cluster or pool of hosts is rebooted or unavailable.
To receive hypervisor alerts, ensure that a hosting connection is created in the Manage tab. For more information, see Connections and resources. Only these connections are monitored for hypervisor alerts. The following table describes the various parameters and states of Hypervisor alerts.
| Alert | Supported Hypervisors | Triggered by | Condition | Configuration |
|---|---|---|---|---|
| CPU usage | Citrix Hypervisor, VMware vSphere | Hypervisor | CPU usage alert threshold is reached or exceeded | Alert thresholds must be configured in the Hypervisor. |
| Memory usage | Citrix Hypervisor, VMware vSphere | Hypervisor | Memory usage alert threshold is reached or exceeded | Alert thresholds must be configured in the Hypervisor. |
| Network usage | Citrix Hypervisor, VMware vSphere | Hypervisor | Network usage alert threshold is reached or exceeded | Alert thresholds must be configured in the Hypervisor. |
| Disk usage | VMware vSphere | Hypervisor | Disk usage alert threshold is reached or exceeded | Alert thresholds must be configured in the Hypervisor. |
| Host connection or power state | VMware vSphere | Hypervisor | Hypervisor Host has been rebooted or is unavailable | Alerts are prebuilt in VMware vSphere. No additional configurations are needed. |
| Hypervisor connection unavailable | Citrix Hypervisor, VMware vSphere | Delivery Controller | Connection to the hypervisor (pool or cluster) is lost or powered down or rebooted. This alert is generated every hour as long as the connection is unavailable. | Alerts are prebuilt with the Delivery Controller. No additional configurations are needed. |
Note:
For more information about configuring alerts, see Citrix XenCenter Alerts or check the VMware vCenter Alerts documentation.
Email notification preference can be configured under Citrix Alerts Policy > Site Policy > Hypervisor Health. The threshold conditions for Hypervisor alert policies can be configured, edited, disabled, or deleted from the hypervisor only and not from Monitor. However, modifying email preferences and dismissing an alert can be done in Monitor.
Important:
- All hypervisor alerts older than a day are automatically dismissed.
- Alerts triggered by the Hypervisor are fetched and displayed in Monitor. However, changes in the life cycle/state of the Hypervisor alerts are not reflected in Monitor.
- Alerts that are healthy or dismissed or disabled in the Hypervisor console will continue to appear in Monitor and have to be dismissed explicitly.
- Alerts that are dismissed in Monitor are not dismissed automatically in the Hypervisor console.
A new Alert category called Hypervisor Health has been added to enable filtering only the hypervisor alerts. These alerts are displayed once the thresholds are reached or exceeded. Hypervisor alerts can be:
- Critical—critical threshold of the hypervisor alarm policy reached or exceeded
- Warning—warning threshold of the hypervisor alarm policy reached or exceeded
- Dismissed—alert no longer displayed as an active alert