Troubleshoot machines
Note:
Citrix Health Assistant is a tool to troubleshoot configuration issues in unregistered VDAs. The tool automates several health checks to identify possible root causes for VDA registration failures and issues in session launch and time zone redirection configuration. The Knowledge Center article, Citrix Health Assistant - Troubleshoot VDA Registration and Session Launch contains the Citrix Health Assistant tool download and usage instructions.
The Filters > Machines view in the Director console displays the machines configured in the site. The Multi-session OS Machines tab includes the load evaluator index, which indicates the distribution of performance counters and tooltips of the session count if you hover over the link.
Click the Failure Reason column of a failed machine to get a detailed description of the failure and actions recommended to troubleshoot the failure. The failure reasons and the recommended actions for machine and connection failures are available in Citrix Director failure reasons and troubleshooting.
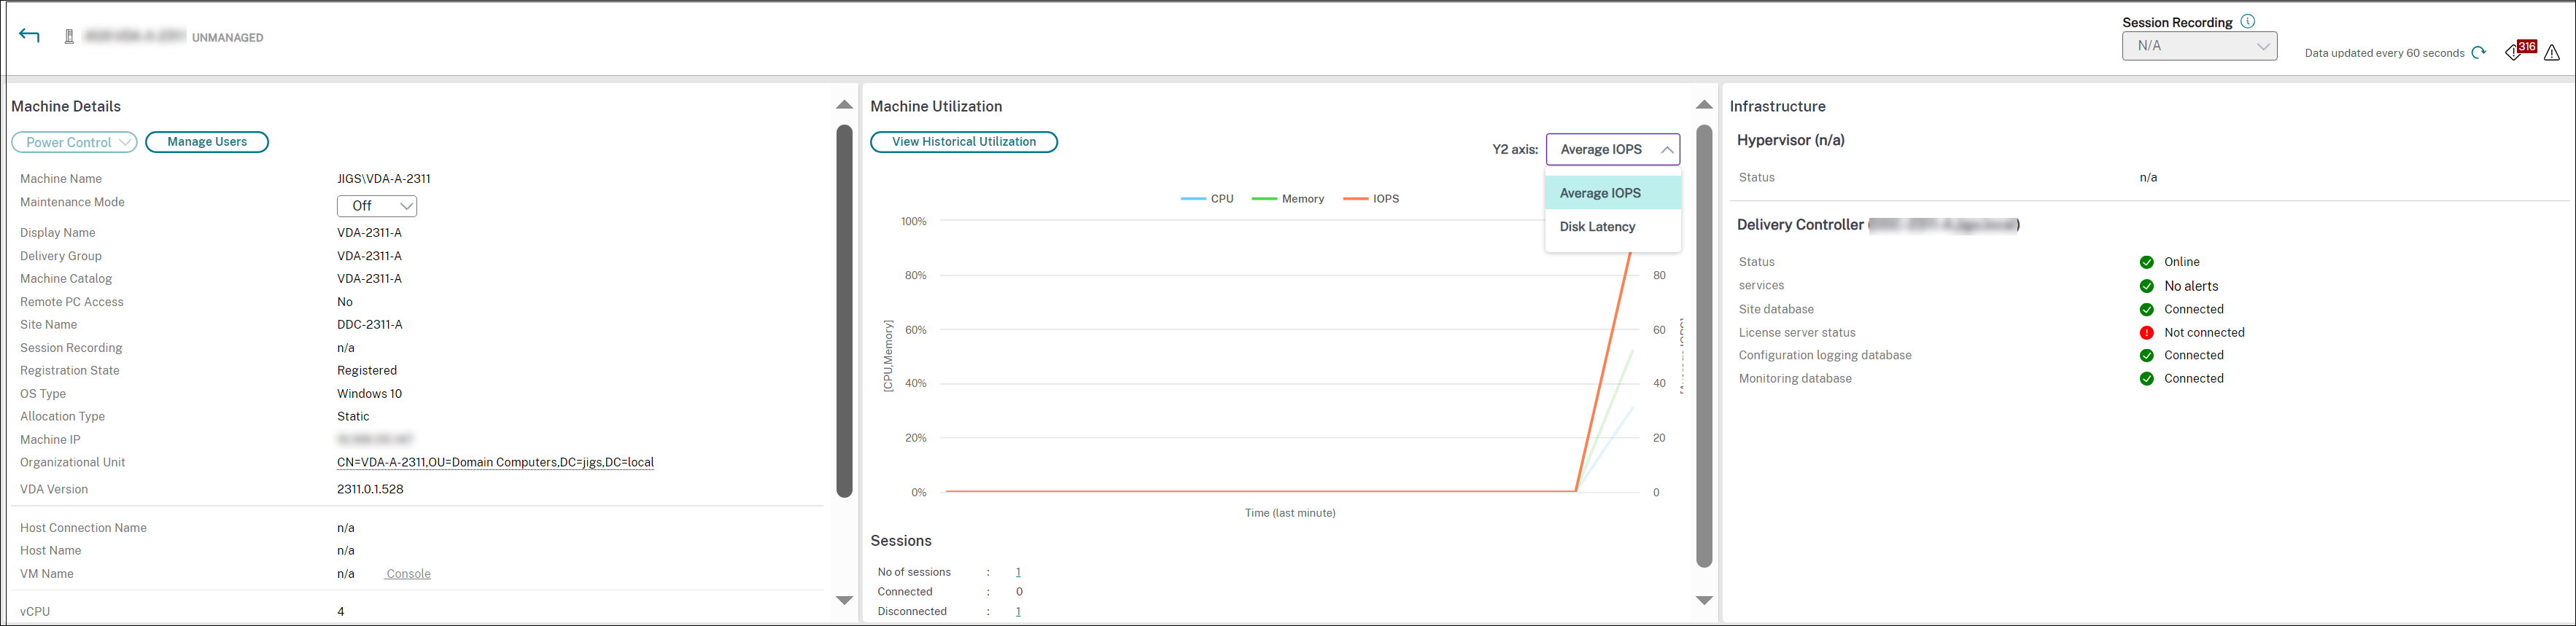
Click the machine name link to go to the Machine Details page.
The Machine Details page lists the machine details, infrastructure details, and details of the hotfixes applied on the machine.
Prerequisite
- uberAgent must be installed on the VDAs
- Windows VDA version: 2511 or later
Metrics
| Metrics | Description |
|---|---|
| Average CPU Usage (%) | |
| Average RAM Usage (%) | |
| Average Disk IOPS | |
| Average Disk Latency (ms) | |
| Average GPU Usage (%) | |
| Average Network Utilization (%) | |
| Average Load Index | |
| Average Disk Usage (%) | |
| Average Profile Disk Usage (%) | |
| Average CPU Idleness (%) | |
| Average Pagefile Usage (%) | |
| Average CPU Relative Frequency (%) |
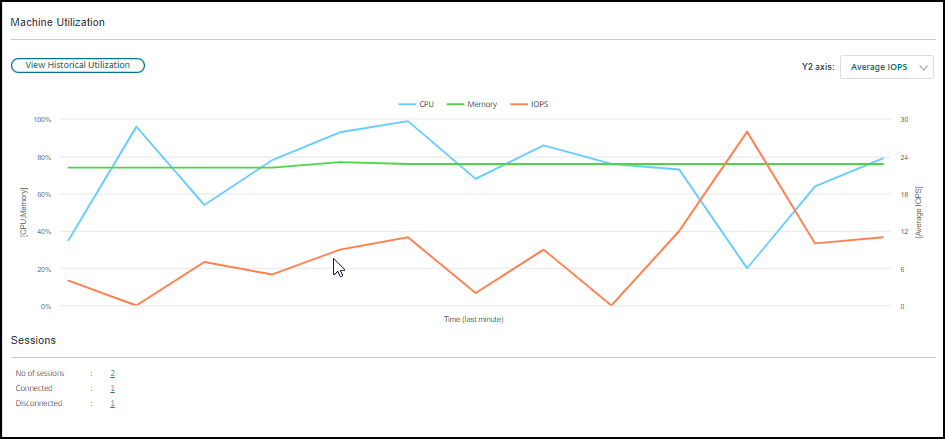
Machine-based real-time resource utilization
The Machine Utilization panel displays graphs showing real-time utilization of CPU and memory. In addition, disk and GPU monitoring graphs are available for sites with Delivery Controllers and VDA versions 7.14 or later.
Disk monitoring graphs, average IOPS, and disk latency are important performance measurements that help you monitor and troubleshoot issues related to VDA disks. The Average IOPS graph displays the average number of reads and writes to a disk. Select Disk Latency to see a graph of the delay between a request for data and its return from the disk, measured in milliseconds.
GPU Utilization
Select GPU Utilization to see the percentage utilization of the GPU, the GPU memory, and of the Encoder and the Decoder to troubleshoot GPU-related issues on multi-session and single-session OS VDAs.
Supported GPU versions:
- NVIDIA Tesla M60 GPUs running Display Driver version 369.17 or later. For more information, see NVIDIA vGPU Software.
- AMD Radeon Instinct MI25 GPUs and AMD EPYC 7V12(Rome) CPUs. For more information, see AMD Drivers and Support.
Drivers:
The appropriate drivers or extensions must be installed on the VDAs.
-
For NVIDIA GPUs, install GRID drivers manually or via extensions. For more information, see NVIDIA vGPU Software.
- For NVIDIA, only GRID drivers are supported. CUDA drivers do not work with the NVadsA10 v5-series and aren’t supported.
- For a sample process to install NVIDIA Grid GPU drivers via extensions on Azure based machines, see NVIDIA GRID drivers. NVIDIA GPU Driver Extension - Azure Windows VMs - Azure Virtual Machines.
- For a sample process to install NVIDIA Grid GPU drivers manually, see Azure N-series NVIDIA GPU driver setup for Windows - Azure Virtual Machines.
-
For AMD GPUs, install AMD graphics drivers manually or via extensions. For more information, see AMD Drivers and Support.
- For a sample process to install AMD GPU drivers via extensions on Azure based machines, see AMD GPU Driver Extension - Azure Windows VMs - Azure Virtual Machines.
- For a sample process to install AMD GPU drivers manually on Azure machines, see Install AMD GPU drivers on N-series VMs running Windows.
Usage Notes:
- The GPU Utilization graphs are available only for VDAs running 64-bit Windows.
- The VDAs must have HDX 3D Pro enabled to provide GPU acceleration. For more information, see GPU acceleration for Windows Single-session OS and GPU acceleration for Windows Multi-session OS.
- When a VDA accesses more than one GPU, the utilization graph displays the average of the GPU metrics collected from the individual GPUs. The GPU metrics are collected for the entire VDA and not for individual processes.
- For AMD, encoder and decoder usage are not supported separately. Any encoding/ decoding workload using the GPU will be reported as the general 3D load on GPU usage.
- Ensure that you install the NVIDIA WMI during installation. This window is available only during manual installation.
- If drivers are installed but Director does not detect the GPU
- Check Task Manager. If drivers are installed properly, the GPU must show up in Task Manager.
- Check if the machine is registered. Sometimes machines might take some time to be detected as online.
- If the GPU usage shows no activity in Director, make sure that the workload you are running is using the GPU. For graphics workloads, this can be enabled from Settings > System > Display > Graphics Settings > Choose the app to set preference. Make sure to turn on High Performance. Sometimes, Windows defaults to using the CPU for graphics workloads when this is set to system default or power saving, based on other settings.
- The data is updated every minute and the data visualization starts within a minute of selecting GPU Utilization.
Machine-based historical resource utilization
In the Machine Utilization panel, click View Historical Utilization to view the historical usage of resources on the selected machine. The utilization graphs include critical performance counters of CPU, memory, peak concurrent sessions, average IOPS, and disk latency.
Note:
The Monitoring policy setting, Enable Process Monitoring, must be set to Allowed to collect, and display data in the Top 10 Processes table on the Historic Machine Utilization page. The collection is prohibited by default.
The CPU and memory utilization, average IOPS, and disk latency data are collected by default. You can disable the collection by using the Enable Resource Monitoring policy setting.
- From the Machine Utilization panel in the Machine Details view, select View Historical Utilization.
-
In the Historical Machine Utilization page, set Time Period to view usage for the last 2 hours, 24 hours, 7 days, month, or year.
Note:
Average IOPS and disk latency usage data are available only for the last 24 hours, month, and year ending now. Custom end time is not supported.
- Click Apply and select the required graphs.
- Hover over different sections of the graph to view more information for the selected time period.
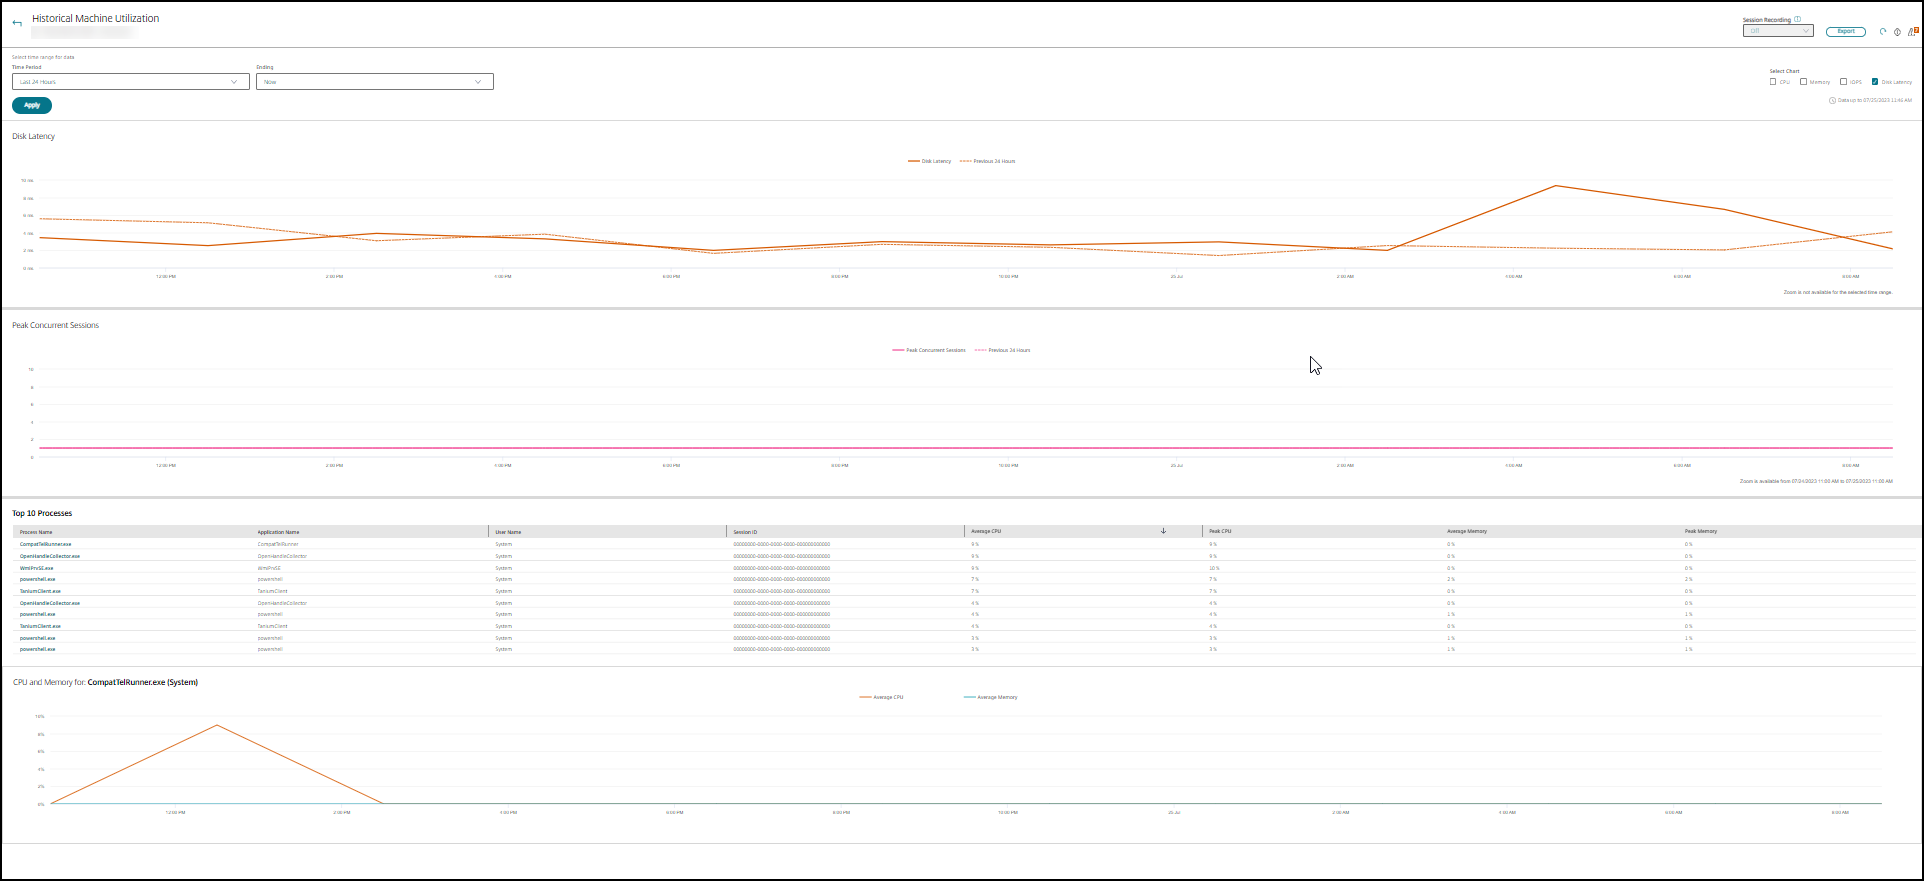
For example, if you select Last 2 hours, the baseline period is the 2 hours before the selected time range. View the CPU, memory, and session trend over the last 2 hours and the baseline time. If you select Last month, the baseline period is the previous month. Select to view the Average IOPS and disk latency over the last month and the baseline time.
- Click Export to export the resource utilization data for the selected period. For more information, see the Export reports section in Monitor Deployments.
-
Below the graphs, the table lists the top 10 processes based on CPU or memory utilization. You can sort by any of the columns, which show Application Name, User Name, Session ID, Average CPU, Peak CPU, Average Memory, and Peak Memory over the selected time range. The IOPS and Disk Latency columns cannot be sorted.
Note:
The session ID for system processes is displayed as “0000”.
- To view the historical trend on the resource consumption of a particular process, drill into any of the Top 10 processes.
Machine Console access
You can access the consoles of Single-session and Multi-session OS machines hosted on XenServer Version 7.3 and later directly from Director. This way, you don’t require XenCenter to troubleshoot issues on XenServer hosted VDAs. For this feature to be available:
- Delivery Controller of Version 7.16 or later is required.
- The XenServer hosting the machine must be of Version 7.3 or later and must be accessible from the Director UI.
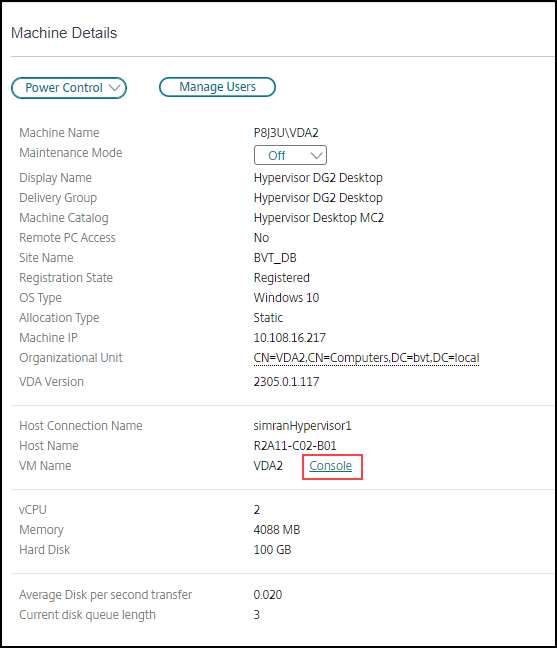
To troubleshoot a machine, click the Console link in the corresponding Machine Details panel. After authentication of the host credentials you provide, the machine console opens in a separate tab using noVNC, a web-based VNC client. You now have keyboard and mouse access the console.
Note:
- This feature is not supported on Internet Explorer 11.
- If the mouse pointer on the machine console is misaligned, see CTX230727 for steps to fix the issue.
- Director launches console access in a new tab, ensure that your browser settings allow pop-ups.
- For security reasons, Citrix® recommends that you install SSL certificates on your browser.
Inspect machines with recent power actions
You can now inspect machines with the status of the success and failed power actions. This feature helps you to analyze the following:
- Power on failure which causes user issues
- Power off failure which increases cost
Note:
Data is available only for the power-managed machine. Data isn’t available for the power actions taken before the feature was supported.
You can view the power action status of the machines using the following ways:
From Filters -> Machines tab. In this case, by default the Power Action Time and the Power Action Result columns are visible. You can also select the columns that you want to visible.
From Cost Optimization tab. In this case, the default filter is Power Action Triggered By is set to Autoscale™ and the Power Action Result is set to Failed.
With this feature, you can view the details of the power action controls. For example, you can view who triggered the action, which action changed the power state, the reason for failure, and the time when the action is completed. You can also export these details.
The following filters are added to view the power action status:
| Filter | Description |
|---|---|
| Power Action Result | Displays the result of the power action. The possible filter values are success and failed. |
| Power Action Triggered By
|
Displays who or what triggered the power action. The possible filter values are the following |
|
|
|
|
|
|
|
|
|
|
|
|
|
|
| Last Power Action | Displays the exact power action happened on the machine such as power-on, power off, shut down, restart, reset, resume |
| Power Action Time | The time when the power action is completed. The possible filter values are last minute, last 5 minutes, last 30 minutes, last hour, today, last 24 hours, and yesterday. |
| Power Action Failure Reason | Displays the reason for failure. The possible filter values are hypervisor reported failure, hypervisor rate limit exceeded, unknown error, and none. If there is a successful action, it shows “None”. |
Microsoft RDS license health
You can view the status of the Microsoft RDS license in the Machine Details panel in the Machine Details and the User Details page for Multi-session OS machines.
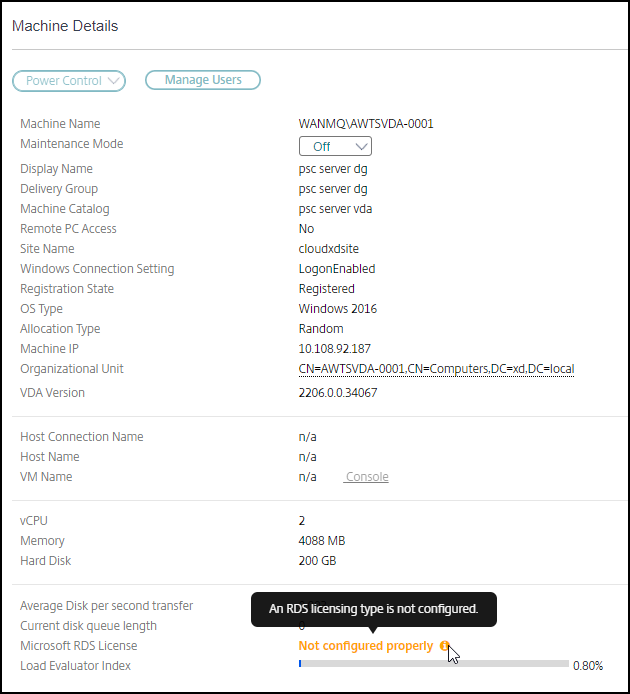
One of the following messages is displayed:
- License available
- Not configured properly (warning)
- License error (error)
- Incompatible VDA version (error)
Note:
The Microsoft RDS license health status for machines under grace period with valid license displays a License available message in green. Renew your licenses before they expire.
For warning and error messages, hover over the info icon to view additional information as given in the following table.
| Message Type | Messages in Director |
|---|---|
| Error | Available for VDAs version 7.16 and later. |
| Error | New RDS connections aren’t allowed. |
| Error | Microsoft RDS license has exceeded its grace period. |
| Error | A License Server is not configured for the required OS level with the Per Device Client Access licensing type. |
| Error | The configured License Server is incompatible with the RDS Host OS level with the Per Device Client Access licensing type. |
| Warning | Personal Terminal Server is not a valid RDS licensing type in a Citrix Virtual Apps and Desktops™ deployment. |
| Warning | Remote Desktop for Administration is not a valid licensing type in a Citrix Virtual Apps™ and Desktops deployment. |
| Warning | An RDS licensing type is not configured. |
| Warning | The Domain Controller or License Server is unreachable with the Per User Client Access RDS licensing type. |
| Warning | With the Per Device Client Access licensing type, the Client Device license cannot be determined since the license server for the required OS level is unreachable. |
Note:
This feature is applicable only for Microsoft RDS CAL (Client Access License).