Cost savings
The Cost savings page provides a visual representation of infrastructure savings accrued over a selected period and forecasts expected savings for the remaining days. By analyzing machine usage and sessions, this page helps you to identify achieved savings and opportunities for cost reduction. This page offers:
- Insight into the optimization of infrastructure costs
- The amount saved
- Information on a range of scenarios that might result in exceeding projected costs
- Potential opportunities for identification and strategic planning to realize infrastructure cost savings
The machine usage typically increases during peak hours, demanding increased resources. The Autoscale™ feature helps you to reduce cost by automatically powering off unused machines during the low demand period. The projected savings depend on this usage pattern. However, costs might exceed expectations under specific circumstances, such as when unused machines are present or when there are failures in Autoscale power actions. Identifying the reasons behind these occurrences was previously challenging.
The Cost optimization page provides you detailed information on different scenarios that might cause you to exceed the expected cost. Similarly, for example, if there are machines with no sessions, it shows you further opportunities for cost savings.
Click the Cost optimization tab from the left menu on the Home page to access the Cost optimization page.
From the drop-down list on the top, if a site has both cloud and on-premises providers, you can now filter by all cloud providers, all on-premises providers, or individual providers.
Note:
The filter is applied immediately upon selection without an apply button.
The Cost optimization page includes Estimated savings and Autoscale savings report. You can view cost savings in the currency of the hypervisor or as a percentage of the incurred cost.
Estimated savings: This graphical representation helps to evaluate the efficient utilization of infrastructure resources. The cost savings are displayed in the currency of the hypervisor or as a percentage of the cost incurred. This graph shows the savings achieved from the compute-related savings and storage savings.
Note:
To view the savings from storage:
- Autoscale must be enabled to optimize compute costs. For more information, see Get started with Autoscale.
- Change the storage type to a lower tier when a VM is shut down to optimize storage costs. For more information, see Change the storage type to a lower tier when a VM is shut down documentation.
- This feature is currently applicable only to Azure machines.
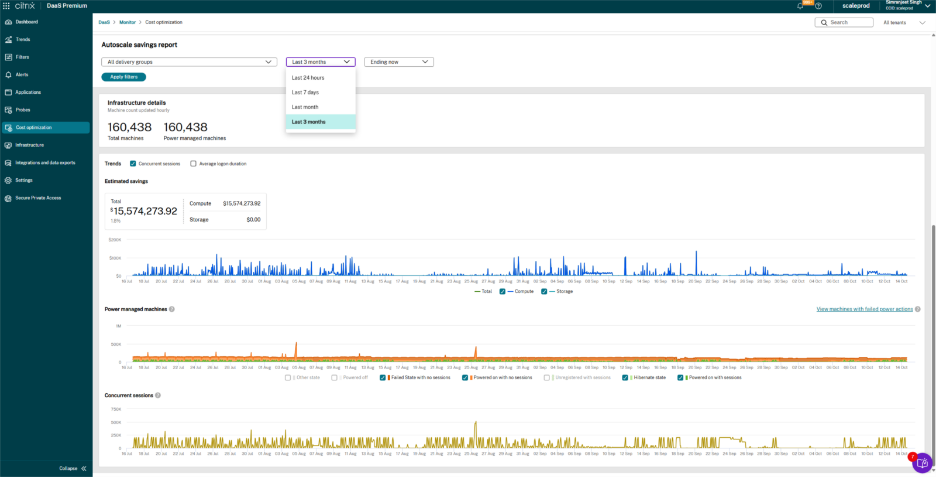
You can view the results for last:
- Seven days
- Thirty days
- Three months
- Six months
- Twelve months
The following picture shows the Estimated infrastructure savings section:
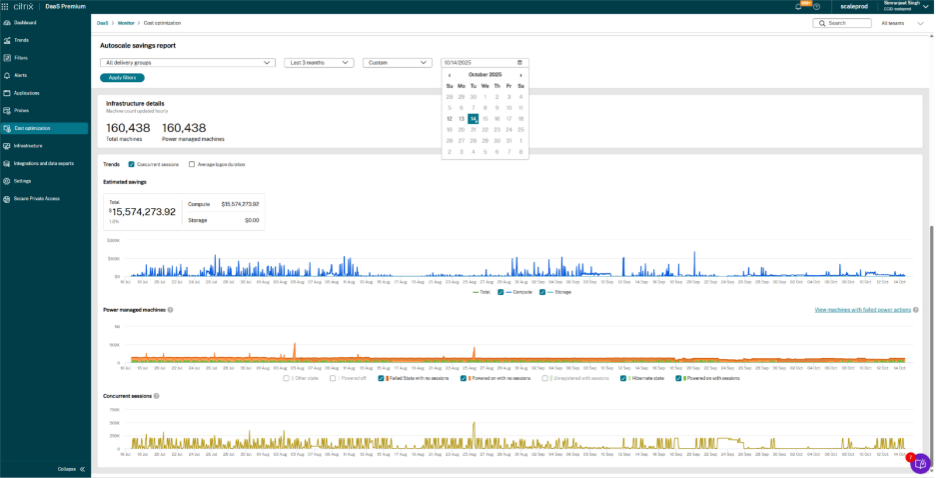
The following table lists the elements of the Estimated infrastructure savings graph:
| Element | Description |
|---|---|
| Total savings | Displays the total savings achieved in infrastructure for the selected duration. The savings are further categorized into storage and compute costs and are available in a tabular format. |
| Estimated savings | Displays the amount of savings achieved in infrastructure for the selected duration. |
| Power-managed machines | Displays the total number of power-managed machines. |
| Projected savings | Displays how much infrastructure savings can be done for the remaining duration. |
| Compute - Total | Displays total savings achieved from the compute-related savings. |
| Compute - Autoscale | Displays total savings achieved from the compute-related savings that are using the Autoscale feature. |
| Compute - User actions | Displays total savings achieved from the compute-related savings that are from user actions. |
| Storage - Total | Displays the total savings achieved from the storage savings. |
| Storage - Autoscale | Displays total savings achieved from the storage savings that are using the Autoscale feature. |
| Storage - User action | Displays total savings achieved from the storage savings that are from user actions. |
Autoscale Savings report: This graphical representation provides the savings report for the delivery groups for which the Autoscale feature is configured and enabled. This report is applicable only for the power-managed machines. You can select a delivery group and then select data for today, last day, last week, next week, this month, or next month. You can hover over any graphs to retrieve specific chart values.
Note:
If the delivery group is deleted, you can’t get any data in the Autoscale savings report.
You can drill down to the following options from the delivery groups drop-down list :
- All delivery groups: Infrastructure details display all the delivery group information.
- All single-session: Infrastructure details for all delivery groups which are single-session machines along with the graphical representation of the machine power state, successful Autoscale power actions, and sessions when you hover over the chart.
- All multi-session: Infrastructure details for all delivery groups which are multi-session machines along with the graphical representation.
- Select up to 15 - Infrastructure details display all the selected delivery groups, up to 15, along with a graphical representation.
- Exclude up to 15 - Infrastructure details display all delivery groups, excluding the selected delivery groups, up to 15, with a graphical representation.
The data displays for the selected duration. The graphical representation of the Estimated savings is the actual savings of the selection made from the drop-down menu. When you hover over the peak points, the information about machine power state, successful Autoscale power actions, and sessions are shown.
Based on the delivery group selected, you can view the following details:
-
Infrastructure details
- Total machines and Power managed machines - Displays the total number of machines and out of that how many machines are power-managed. This data provides you a further opportunity to consider converting the remaining non-power managed machines to power-managed machines, thereby enabling the Autoscale feature for a more comprehensive coverage. The data in the Infrastructure details section shows the last known information updated every hour.
-
Catalog details
Displays the name of the hypervisors (service providers). For more information, see Supported VDA hosting platforms. The data in the Catalog details shows the most recent data (live data) available at the current time.
You can get the following details:
-
Hypervisor name - Displays the name of the hypervisor to which the site is connected. Displays all available hypervisors when multiple hypervisors are present.
-
Instance - Displays the name of the instance.
-
Total Cost per hour - Displays the cost per machine per hour in the currency that the hypervisor supports. For Azure machines, when the Microsoft.Consumption/pricesheets/read permission is available, the effective price is displayed in the currency that is configured in the Azure subscription. If permissions aren’t available, the Azure retail price is displayed. For more information, see Azure Retail Prices overview. For other machines, cost is displayed based on the cost entered by admins in the Web Studio. The default cost is $1 if the cost is not mentioned in Web Studio. For more information, see [How is the cost calculated for optimizing the cost?
- Compute Cost Per Hour - Displays the cost savings from the compute-related savings.
- Storage Cost Per Hour - Displays the cost savings from the storage savings.
- Machines - Displays the count of the machines for the selected instance.
-
-
Autoscale configuration (last known)
Tag in use - Displays the tag of the machines that is configured in the Autoscale settings in a WebStudio. You can also filter the data based on the tagged machines. In this case, you get only the tagged machines summary.
Capacity buffer (peak) and Capacity buffer (off peak)
Displays the percentage of buffer for machines that are powered on based on the maximum requirement of the delivery group during peak and off-peak times.
-
Estimated savings
Displays the amount of savings achieved in infrastructure for the selected duration. You can view the savings from compute-related savings and storage-related savings for the Azure machines with Autoscale feature enabled.
-
Power managed machines
With Autoscale enabled, the power-managed machines are turned off when not in use to optimize costs. You can get the following details:
- Number of machines powered off - This data helps you to analyze the number of machines that were powered off and thus helped to reduce cost.
- Hibernate state - This data helps you to analyze how many machines are in the hibernated state.
- Machines on with no sessions - This data provides you the opportunity to analyze why machines were active without any sessions. This data provides you the opportunity to plan for a more effective infrastructure savings strategy.
- Machines on with sessions - This data helps you to analyze the number of machines that were powered on and with active sessions.
- Power off - This data helps you to analyze the number of machines that were powered off or suspended and when this action was done. You can verify this data and make further modifications, contributing cost reduction.
- Power on - This data helps you to analyze how many machines were powered on and when this action was done. You can verify this data and make further modifications and thus help to reduce cost.
- Failed state with no sessions: This field displays the count of machines that are in a failed state and have no active sessions.
- Unregistered with sessions: This field displays the count of machines that are in an unregistered state but are still serving sessions.
Note:
You can see the count of machines in the Failed state with no sessions and Machines with failed power actions states and take actions based on the failure reason, time, and delivery group. The counts are clickable links that navigate to the Filters page for further actions. The count includes both single session and multi-session machines.
-
Concurrent sessions
Displays the total number of sessions at the selected time. This data helps you to determine when to power off machines for cost optimization.
-
Average logon duration
Displays the average time for a user to log on over the selected time duration.