Cost summary
The Cost summary page provides a comprehensive summary of the expenses associated with running the Citrix® environment. With this enhancement, you gain visibility into:
- The overall cost per user
- Cost of delivering virtualization by the chosen Workload providers, desktop types, and VM series sets
This page offers:
- Insight into the cost of delivering a virtualized app or desktop to a user
- The amount saved
-
Information on costs and savings categorized by:
- Platform provider
- OS type
- Desktop type
- VM series
Note:
The Cost summary page is available only if the site has been running for at least 15 days in a month.
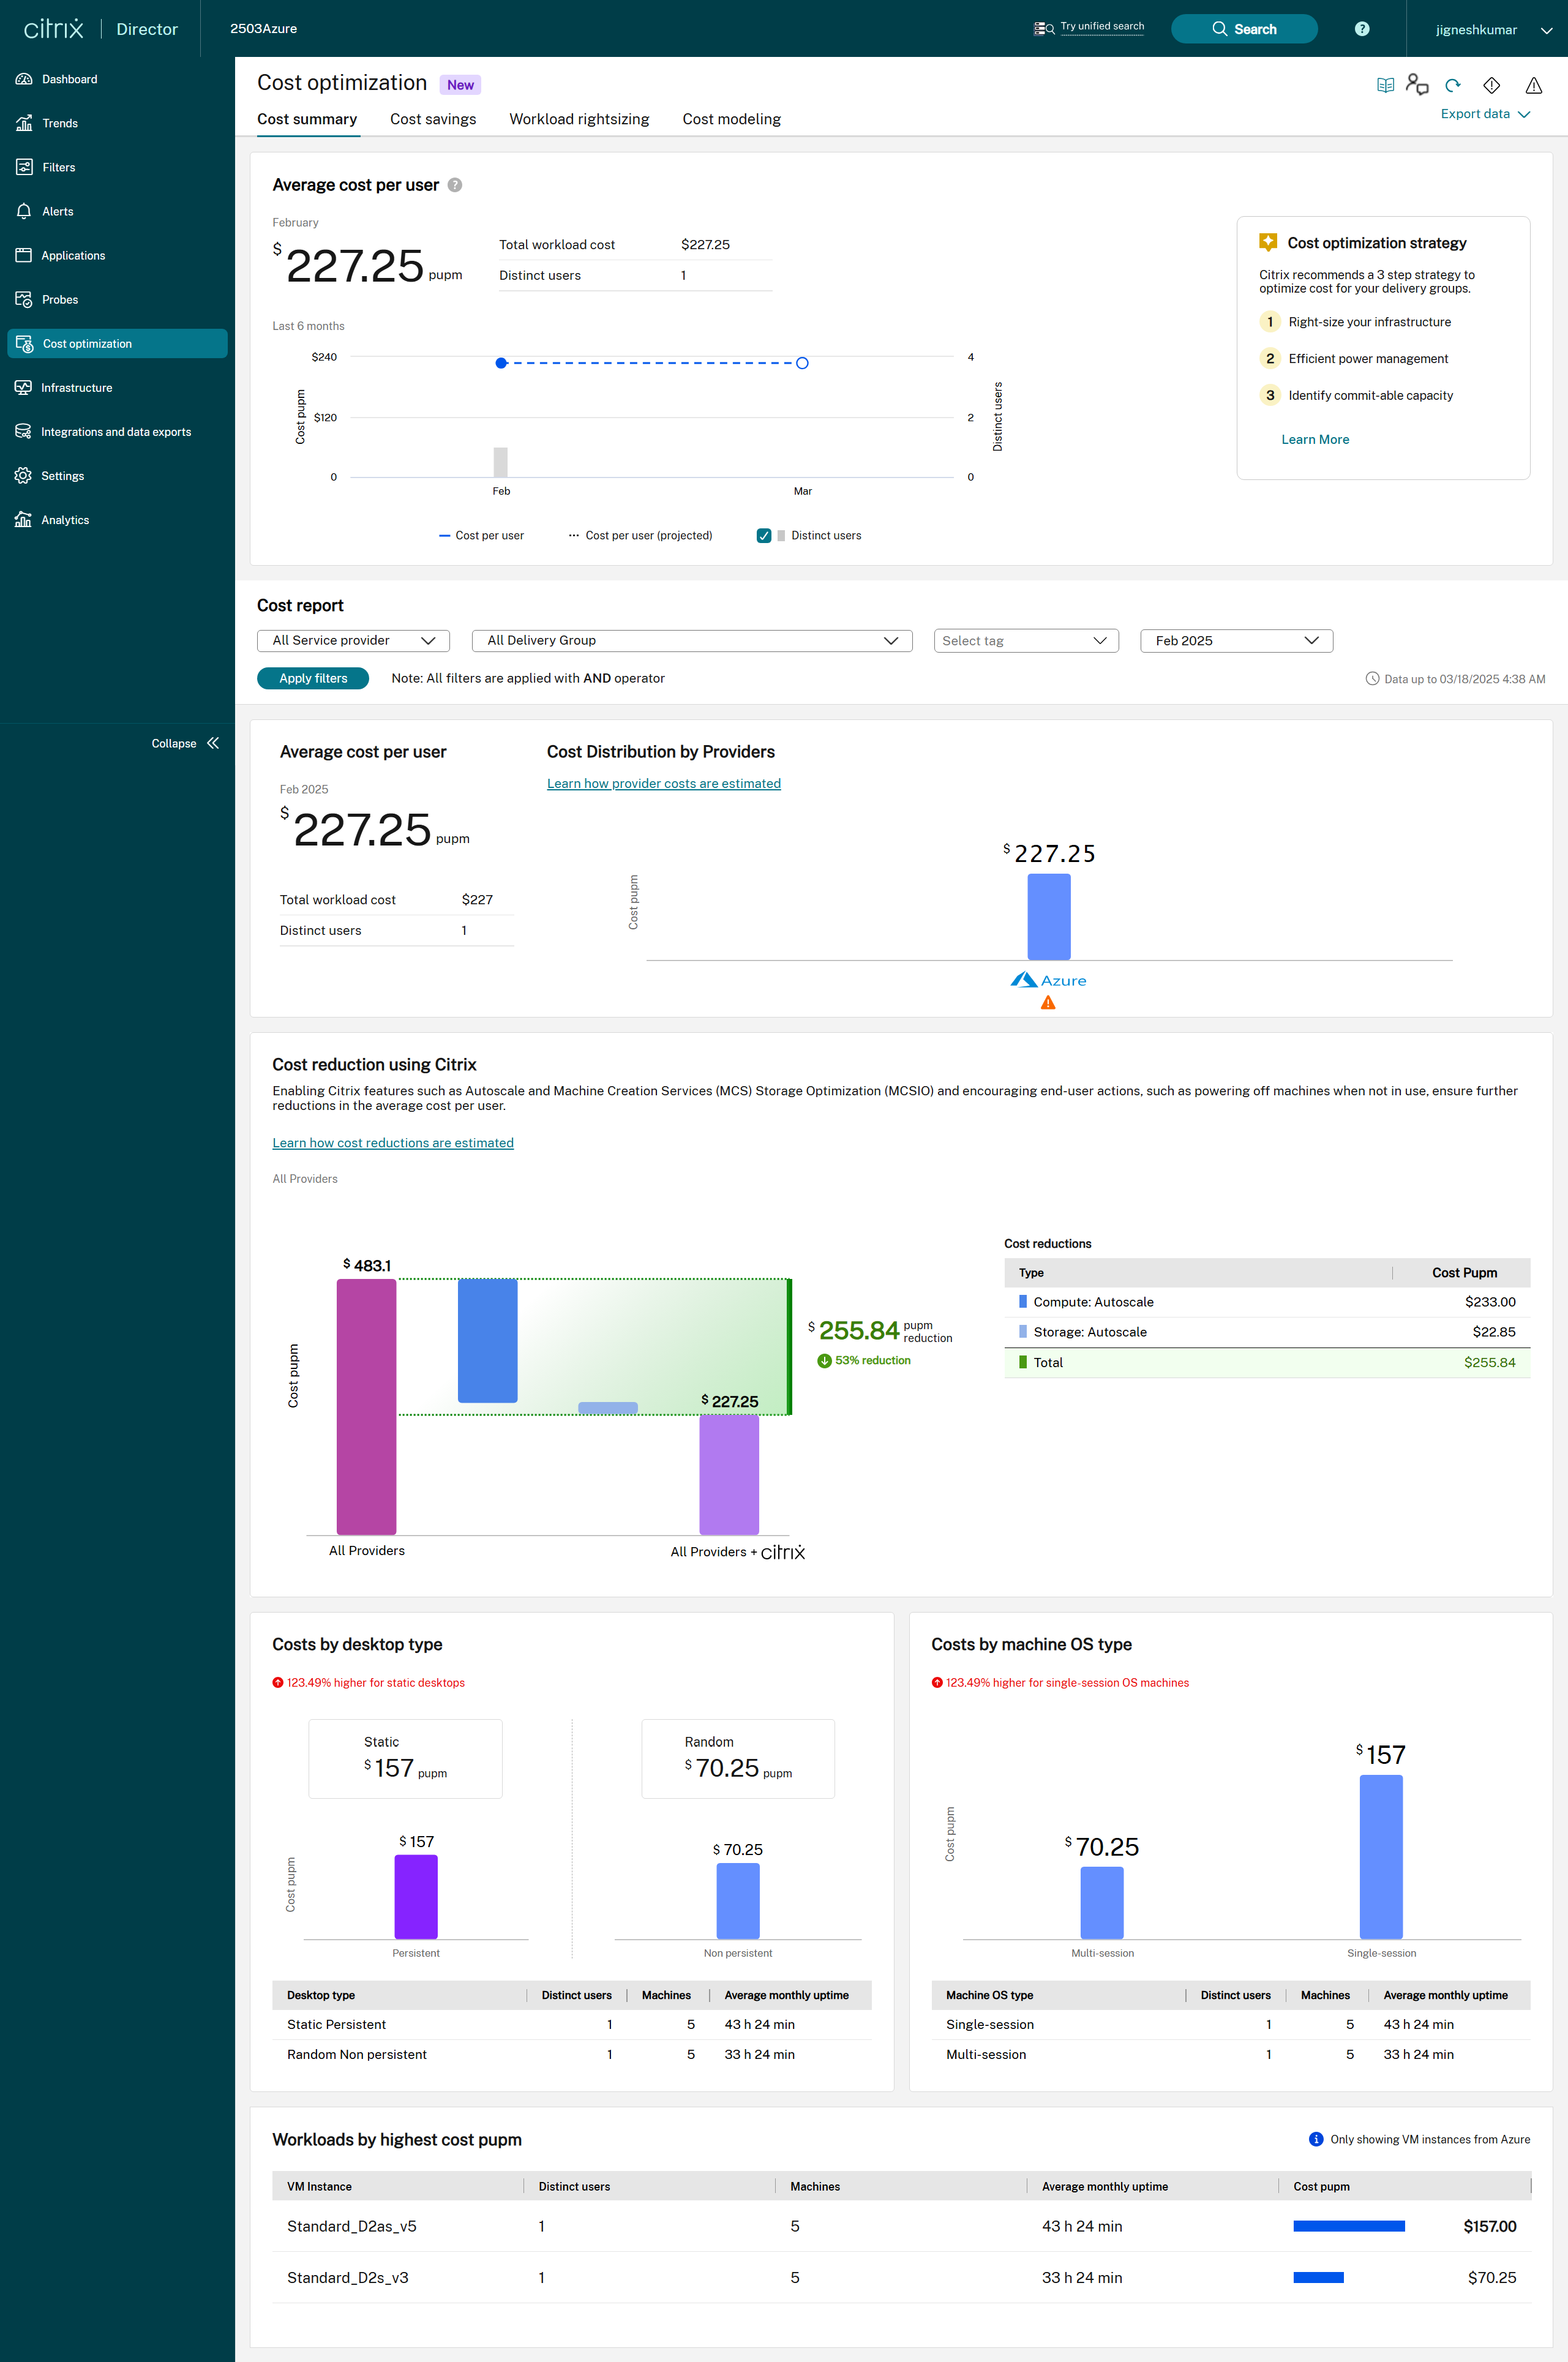
To access the Cost summary page, click Director > Cost optimization > Cost summary. The Cost summary page appears:

The Cost summary page includes:
-
Average cost per user
You can view the actual cost per user per month for the last six months and also the projected cost for the current month. In addition, you can see the total cost of workloads and the number of distinct users on the site. When multiple currencies are involved, costs are displayed in USD if USD is one of them. Otherwise, the cost is shown in a randomly selected currency from the list. The cost savings compared to the last and last to the last months are provided in percentage. Also, the changes in the number of distinct users are also presented. The graphical representation shows the trend for every month.
You can use the average cost per user and optimize the usage.
-
Cost report
You can view the cost report of the selected service providers, for the selected delivery group, and for the selected tag. You can view the report for the last three months separately or a consolidated view of the last three months’ data.
-
Cost reduction using Citrix
You can further reduce the average cost per user by enabling Citrix features such as Autoscale and Machine Creation Services™ (MCS), Storage Optimization (MCSIO). Also, encourage end-user actions, such as powering off machines when not in use.
This data displays the total savings when Citrix features are applied. It also displays the savings from the end-user actions.
-
Cost by desktop type
You can view the costs of the following types of desktops:
- Static persistent: The user signs on to the same virtual desktop each time and the changes made to the desktop are saved.
- Static non-persistent: The user signs on to the same virtual desktop each time and the changes made to the desktop are not saved.
- Random persistent: The user is assigned a virtual desktop from the pool of desktops and the changes made to the desktop are saved.
- Random non-persistent: The user is assigned a virtual desktop from the pool of desktops and the changes made to the desktop are not saved.
You can view the number of distinct users, machines, and average monthly uptime for each type of machine.
You can use this data and plan for saving costs by moving users to different types of desktops. For example, static persistent desktop types require more resource usage compared to random non-persistent desktops. So, you can plan to move some users from static persistent desktop types to random non-persistent desktop types.
-
Cost by OS type
You can view the costs of single-session and multi-session OS types. You can view the machine OS type, distinct users, machines, and average monthly uptime. You can use this data and plan for saving costs by moving users to different types of OS.
-
Workloads by highest cost per user per month
You can view the details of the highest cost per user per month, including the virtual machine instance, number of distinct users, and average uptime of the machine. Also, you can see the number of machines and the cost per user.
Use this data to view the cost for each VM configuration type and decide which configurations to assign to users.