Diagnose user logon issues
The User Details view > Session Logon tab displays a comprehensive view of the session logon process. This tab shows the total logon duration, client and controller duration, and VDA duration. Use this data to troubleshoot user logon issues.
Logon duration is measured only for initial connections to a desktop or app using HDX. This data does not include users trying to connect with Remote Desktop Protocol or reconnect from disconnected sessions. Specifically, logon duration is not measured when a user initially connects using a non-HDX protocol and reconnects using HDX.
As users log on to Citrix Virtual Apps and Desktops™, the Monitor Service tracks the phases of the logon process. The phases begin from the time the user connects from Citrix Workspace™ app to the time when the app or desktop is ready to use.
The Session Logon tab contains the Logon Duration phases chart with the various logon phases plotted. The Logon Duration represents the time spent establishing the connection and obtaining an app or a desktop from Delivery Controller™ and the time spent to authenticate and log on to a virtual app or desktop. The duration information is presented in seconds (or fractions of seconds).
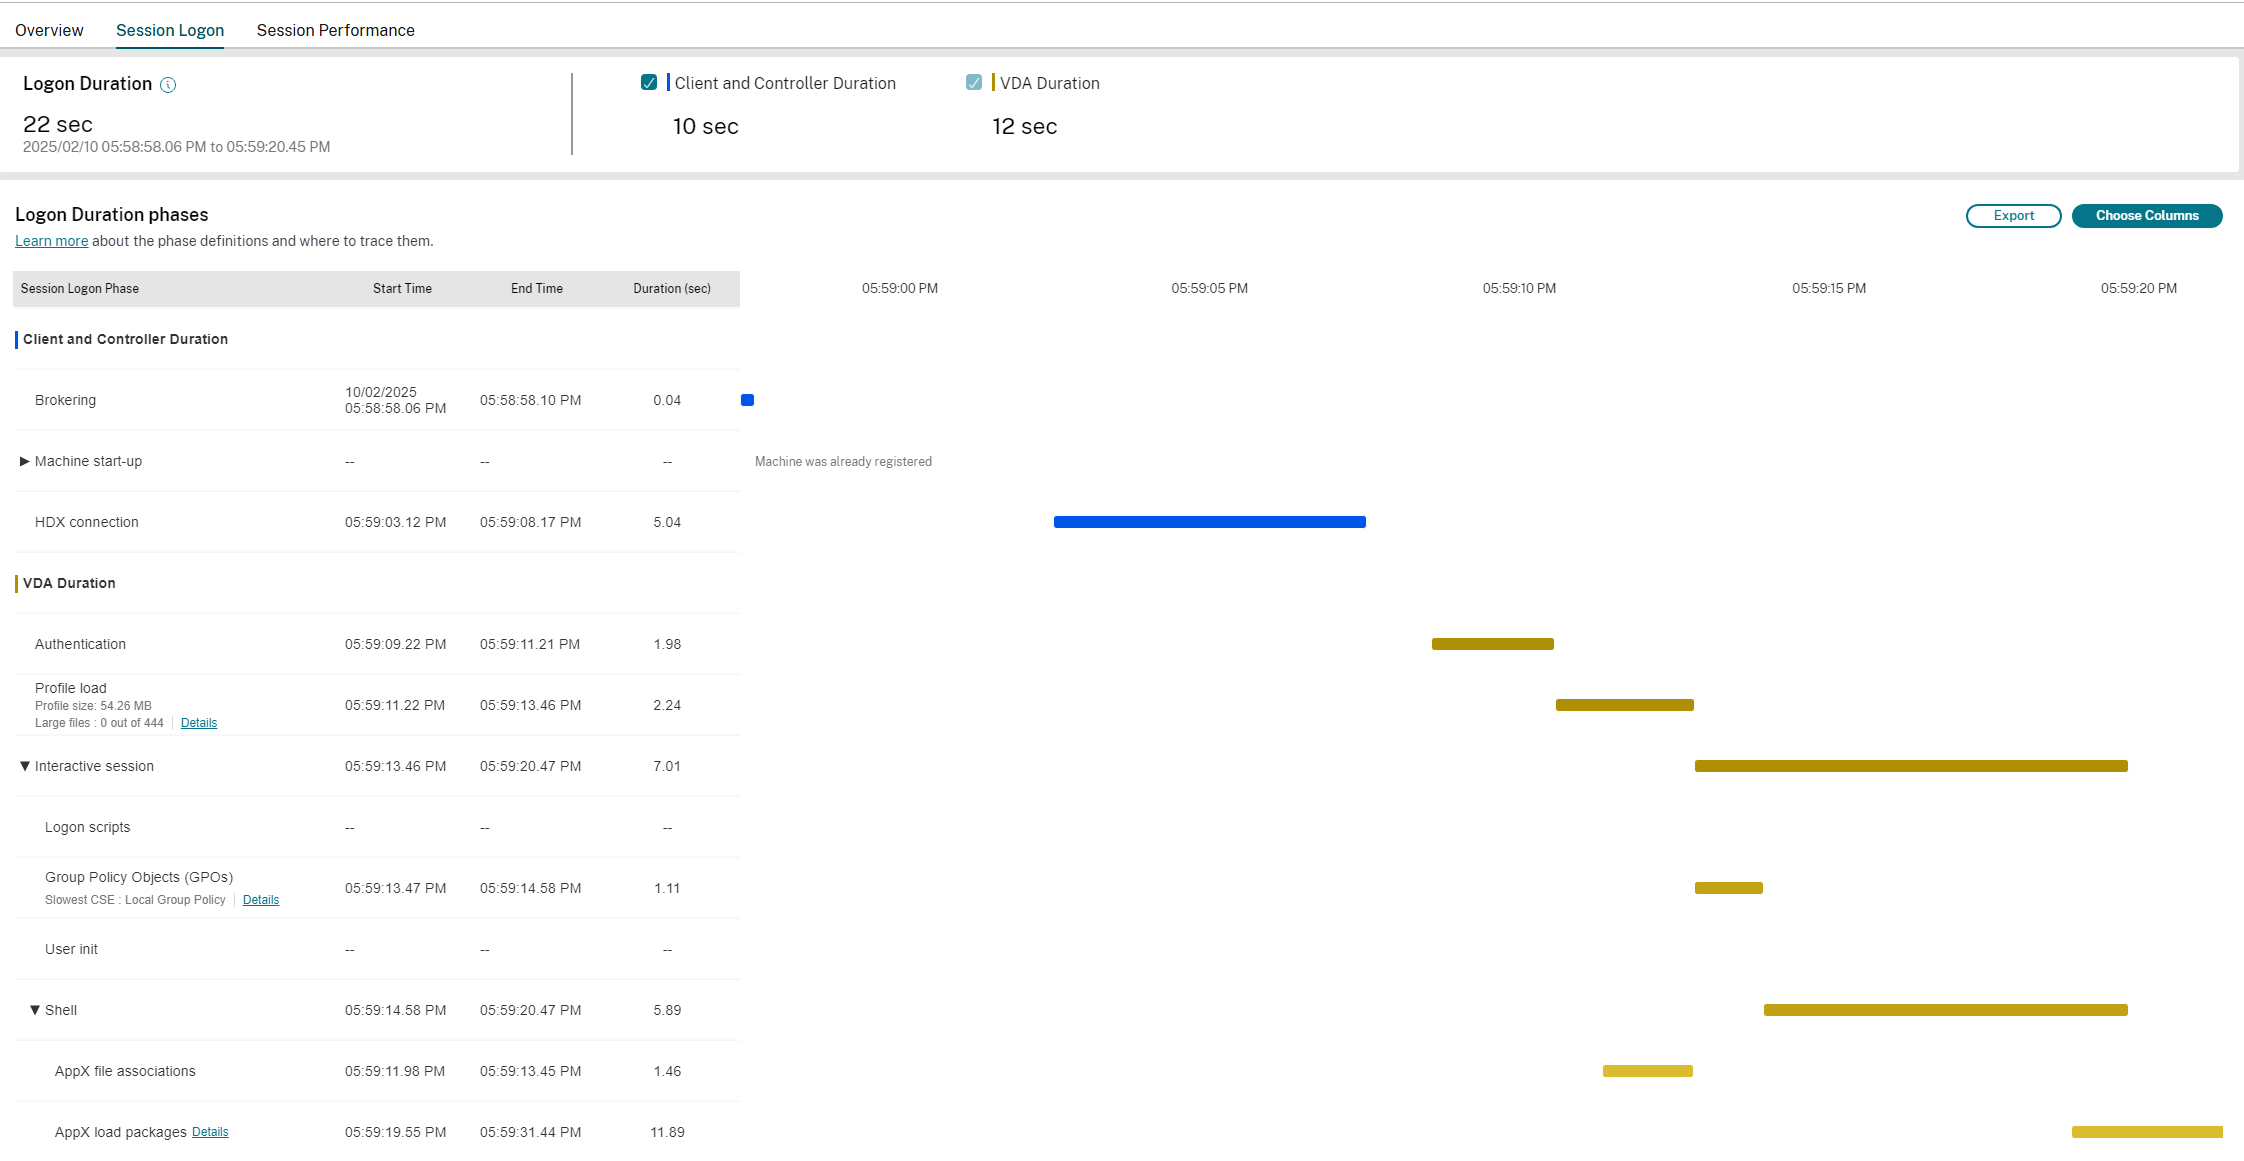
The Logon Duration phases chart provides a clear view of different logon phases and their start and end times. The chart shows the overlapping of the individual logon phases. The total logon time might not be the sum of the individual logon phase durations. This is because the individual phases might overlap and not all logon phases are a part of this representation. Also, certain phases might extend even after the user starts interacting with the virtual app or desktop, and this duration is not measured as part of the overall logon duration.
Use this view to identify specific logon phases causing a delayed session launch. The definition for each logon phase and the event source from where you can trace information helps further troubleshooting. Hovering on the chart gives a tooltip containing the phase duration for the current session as well as the user’s 7-day average and the delivery group’s 7-day average. This information helps compare the current session logon duration with the 7-day average values. You can further drilldown into subphase measurements in the case of GPO and Profile Details. This visualization helps understand and troubleshoot logon duration-related issues easily.
Prerequisites
Ensure that the following prerequisites are met for logon duration data and drilldowns to appear:
- Install Citrix User Profile Manager and Citrix User Profile Manager WMI Plugin on the VDA.
- Ensure that the Citrix Profile Management Service is running.
- For XenApp and XenDesktop sites 7.15 and earlier, disable the GPO setting, Do not process the legacy run list.
- Audit process tracking must be enabled for Interactive Session drilldown.
- For GPO drilldown, increase the size of Group Policy operational logs.
Notes:
Logon duration is supported only on the default Windows shell (explorer.exe) and not on custom shells.
Logon duration for Remote PC Access is available only when Citrix User Profile Manager and the Citrix User Profile Manager WMI Plugin are installed as extra components during Remote PC Access installation. For more information, see Step 4 in Remote PC Access configuration and sequence considerations.
Steps to troubleshoot user logon issues
- From the User Details view > Session Logon tab, troubleshoot the logon state using the Logon Duration chart.
- If the user is logging on, the view reflects the process of logging on.
- If the user is logged on, the Logon Duration panel displays the time it took for the user to log on to the current session.
- Examine the phases of the logon process.
Logon process phases
Client and Controller duration
Time taken since the user clicked on the app or desktop icon until the keyboard and mouse controls are handed over to the end user to interact with the session.
Brokering
Time taken to decide which desktop to assign to the user.
Machine Start-up
If the session required a machine start, this is the time taken to start the virtual machine. The following sub-section provides breakdown of the time taken to start a virtual machine during different phases:
- Power On - Displays the time taken to power on a virtual machine
- Boot-up and registration - Displays the time taken to boot up and register a virtual machine
You can use the collapsible button to collapse or expand the options under the Machine Start-up.
HDX connection
Time taken to complete the steps required in setting up the HDX connection from the client to the virtual machine.
VDA duration
Time taken on the VDA to create a session.
Authentication
Time taken to complete authentication to the remote session.
Profile load
If profile settings are configured for the user or the virtual machine, this is the time taken for the profile to load.
If Citrix Profile Management and FSLogix are configured, the Profile Load bar includes the time taken by Citrix Profile Management and FSLogix to process user profiles. This information helps administrators to troubleshoot high profile processing duration issues. When Profile Management and FSLogix are configured, the Profile Load bar displays an increased duration. This increase is caused by this enhancement and does not reflect a performance degradation. This enhancement is available on VDA versions 2407 or later.
Hovering over the Profile Load bar displays a tooltip showing the user profile details for the current session.
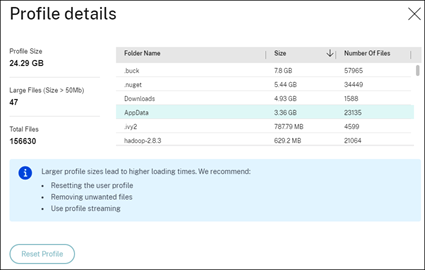
Click Details to drilldown further into each individual folder in the profile root folder (for instance, C:/Users/username), its size, and the number of files (including files inside nested folders).
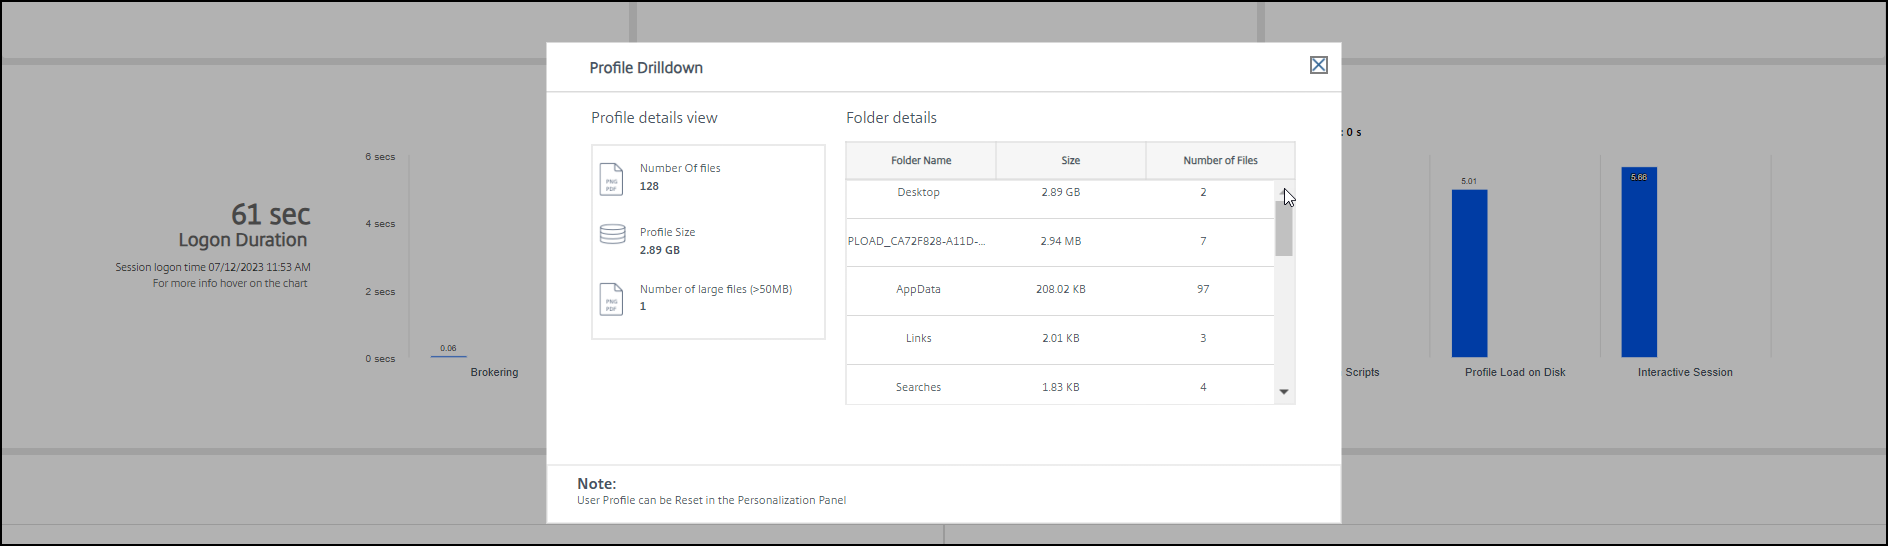
Profile drilldown is available on Delivery Controller version 7 1811 or later and VDAs 1811 or later. Using the profile drilldown information, you can resolve issues involving a high profile load time. You can:
- Reset the user profile
- Optimize the profile by removing unwanted large files
- Reduce the number of files to reduce the network load
- Use profile streaming
By default, all folders in the profile root are displayed in the drilldown. To hide folder visibility, edit the following registry value on the VDA machine:
Warning:
Adding and editing the registry incorrectly can cause serious problems that might require you to reinstall your operating system. Citrix does not guarantee that problems resulting from the incorrect use of Registry Editor can be solved. Use Registry Editor at your own risk. Be sure to back up the registry before you edit it.
- On the VDA, add a new registry value ProfileFoldersNameHidden at HKEY_LOCAL_MACHINE\Software\Citrix\Director\
- Set the value to 1. This value must be a DWORD (32-bit) value. Folder names visibility is now disabled.
- To make the folder names visible again, set the value to 0.
Note:
You can use GPO or PowerShell commands to apply the registry value change on multiple machines. For more information about using GPO to deploy registry changes, see the blog.
Additional information
- Profile drilldown does not consider redirected folders.
- The NTUser.dat files in the root folder might not be visible to end users. However, they are included in the profile drilldown and displayed in the list of files in Root Folder.
- Certain hidden files in the AppData folder are not included in the Profile drilldown.
- The number of files and profile size data might not match with the data in the Personalization panel due to certain Windows limitations.
Interactive Session
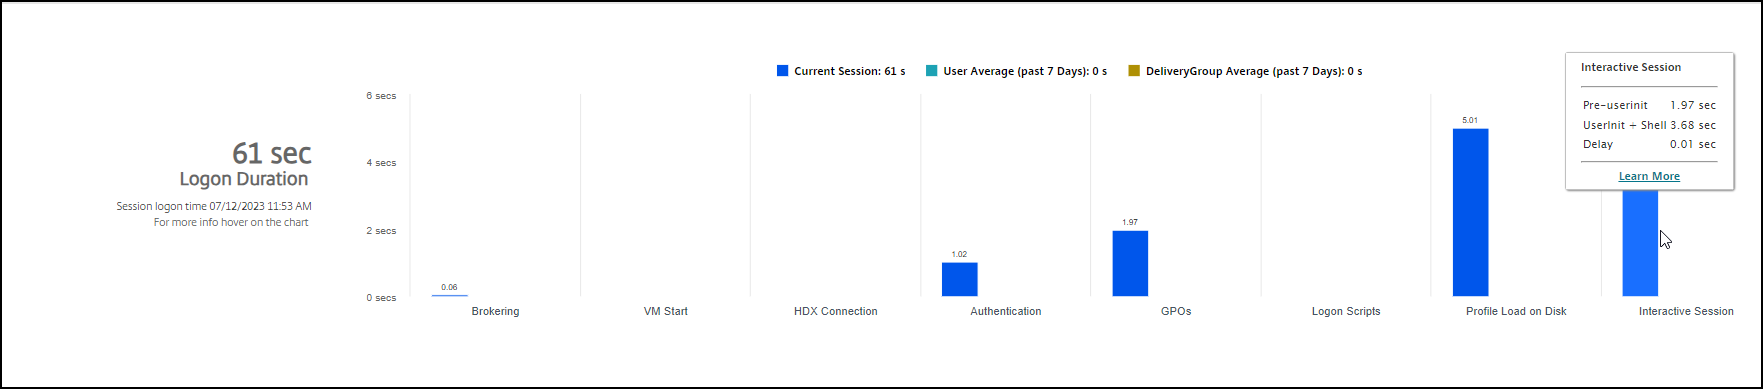
Interactive Session is the time taken to “hand off” keyboard and mouse control to the user after the user profile has been loaded. It is normally the longest duration out of all the phases of the logon process and is calculated as Interactive Session duration = Desktop Ready Event Timestamp (EventId 1000 on VDA) - User Profile Loaded Event Timestamp (EventId 2 on VDA). Interactive Session has three subphases: Pre-userinit, Userinit, and Shell. Hover over Interactive Session to see a tooltip showing the following:
- subphases
- time taken for each subphase
- total cumulative time delay between these subphases
You can use the collapsible button to collapse or expand the options under the Interactive Session.
Note:
This feature is available on VDAs 1811 and later. If you have launched sessions on sites earlier than 7.18 and then upgraded to 7.18 or later, a ‘Drilldown unavailable due to server error’ message is displayed. However, if you have launched sessions after upgrading, no error message is displayed.
To view the time duration of each subphase, enable Audit process tracking on the VM (VDA). When the Audit process tracking is disabled (default), the time duration of Pre-userinit and the combined time duration of Userinit and Shell are displayed. You can enable Audit process tracking through a Group Policy Object (GPO) as follows:
- Create a GPO and edit it using the GPO editor.
- Go to Computer Configuration > Windows Settings > Security Settings > Local Policies > Audit Policy.
- On the right pane, double-click Audit process tracking.
- Select Success and click OK.
- Apply this GPO to the required VDAs or Group.
For more information about Audit process tracking and enabling or disabling it, see Audit process tracking in the Microsoft documentation.
 Logon Duration panel in the User Details view.
- Interactive Session – Pre-userinit: The segment of Interactive Session which overlaps with Group Policy Objects and scripts. This subphase can be reduced by optimizing the GPOs and scripts.
- Interactive Session – Userinit: When a user logs on to a Windows machine, Winlogon runs userinit.exe. Userinit.exe runs logon scripts, re-establishes network connections, and then starts Explorer.exe, the Windows user interface. This subphase of Interactive Session represents the duration between the start of Userinit.exe to the start of the user interface for the virtual desktop or application.
- Interactive Session – Shell: In the previous phase, Userinit starts the initialization of Windows user interface. The Shell subphase captures the duration between the initialization of the user interface to the time the user receives keyboard and mouse control.
- Delay: This is the cumulative time delay between the Pre-userinit and Userinit subphases and the Userinit and Shell subphases.
The total logon time is not an exact sum of these phases. For example, some phases occur in parallel, and in some phases, more processing occurs that can result in a longer logon duration than the sum. The total logon time does not include the ICA® idle time that is the time between the ICA file download and the ICA file launch for an application. To enable the automatic opening of the ICA file upon application launch, configure your browser for automatic ICA file launch upon download of an ICA file. For more information, see CTX804493.
Note:
The Logon Duration graph shows the logon phases in seconds. Any duration values below one second are displayed as subsecond values. The values above one second are rounded to the nearest 0.5 second. The graph has been designed to show the highest y-axis value as 200 seconds. Any value greater than 200 seconds is shown with the actual value displayed above the bar.
Logon scripts
If logon scripts are configured for the session, this is the time taken for the logon scripts to be run.
GPOs
If Group Policy settings are enabled on the virtual machines, this is the time taken to apply group policy objects during logon. The drill-down of the time taken to apply each policy as per the CSEs (Clients-Side Extension) is available as a tooltip when you hover on the GPO bar.
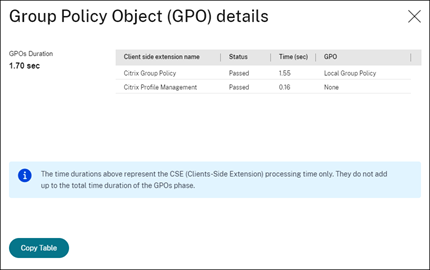
Click Details to see a table with the policy status, and the corresponding GPO name. The time durations in the drilldown represent the CSE processing time only and do not add up to the total GPO time. You can copy the drill-down table for further troubleshooting or use in reports. The GPO time for the policies is retrieved from Event Viewer logs. The logs can get overwritten depending on the memory allocated for the operational logs (default size is 4 MB). For more information about increasing the log size for the operational logs, see the Microsoft TechNet article Configuring the Event Logs.
User init
When a user logs on to a Windows machine, Winlogon runs userinit.exe. Userinit.exe runs logon scripts, re-establishes network connections, and then starts Explorer.exe, the Windows user interface. This subphase of Interactive Session represents the duration between the start of Userinit.exe to the start of the user interface for the virtual desktop or application
Shell
The Shell subphase captures the duration between the initialization of the user interface to the time the user receives keyboard and mouse control.
AppX file associations
The time taken to associate AppX files during the new VDA session.
AppX load packages
The time taken to load the AppX packages during the new VDA session.
Note:
uberAgent must be integrated with Director for collecting AppX packages loading duration during the new VDA session. For more information, see Citrix uberAgent integration with Director.
Export data
Along with the default Logon Duration Phases table options, which is Session Logon Phase and Duration, you can also choose the following columns on the Session Logon page:
- Start time
- End time
- Delivery Group - 7d Avg (sec)
- User - 7d Avg (sec)
You can also export the preceding data to a .CSV file.
Troubleshooting tips
To identify unusual or unexpected values in the graph, compare the amount of time taken in each phase of the current session with the average duration for this user for the last seven days, and the average duration for all users in this delivery group for the last seven days.
Escalate as needed. For example, if the Machine Start-up is slow, the issue might be in the hypervisor, so you can escalate it to the hypervisor administrator.
Examine unusual differences, including:
- Missing (current) logon bars
- Major discrepancy between the current duration and this user’s average duration. Causes include:
- A new application was installed.
- An operating system update occurred.
- Configuration changes were made.
- Profile size of the user is high. In this case, the Profile Load is high.
- Major discrepancy between the user’s logon numbers (current and average duration) and the delivery group average duration.
If needed, click Restart to observe the user’s logon process to troubleshoot issues, such as Machine Start-up or Brokering.