Alerts
Performance Analytics generates alerts to help administrators to monitor the environment proactively. The alerts are generated when factors affecting the user experience get deteriorated.
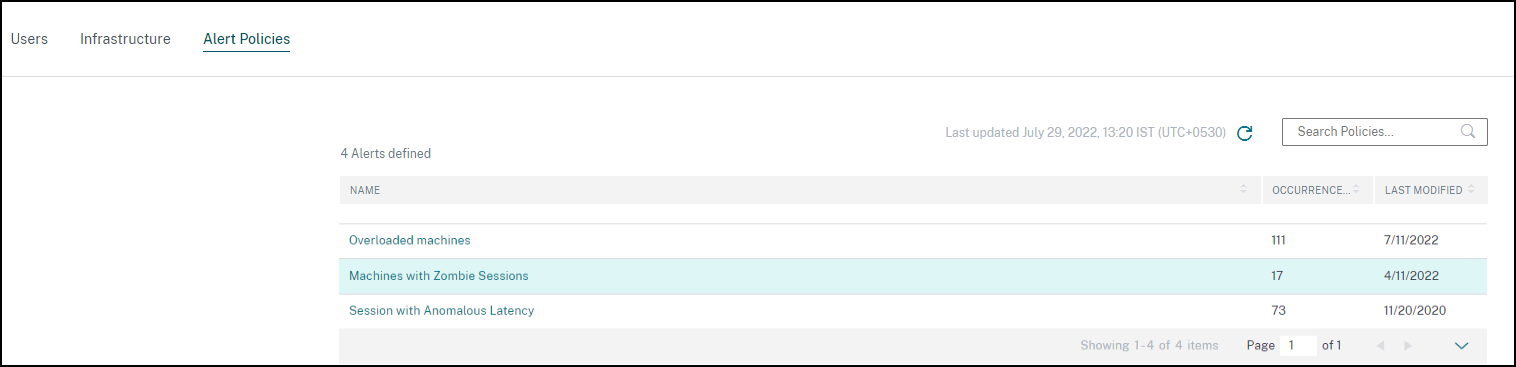
The available policies are listed in the Alert Policies tab. The alerts are enabled by default, and can be disabled using the Status toggle. Alert email notifications for stakeholders can be enabled for recipients who don’t have administrator access to your Citrix Cloud account. Click the alert name to edit the mail recipients list. For more information, see the Email distribution list article.
You must enable receiving email notifications for all recipients from the Account Settings menu in Citrix Cloud to receive the alert mails. For more information, see the Notifications article.
Webhook Support for Alert Notifications
You can publish alert notifications from Performance Analytics to a preferred Webhook listener such as Slack, JIRA. This helps enterprise customers automate the flow from incident detection to closure, and hence easily drive workflows in response to Performance Analytics Alert notifications.
For information about creating a webhook profile, see Create a Webhook Profile.
To configure a webhook-based alert notification:
-
Go to the Alert Policies tab.
- Click the policy that you want to configure with a webhook.
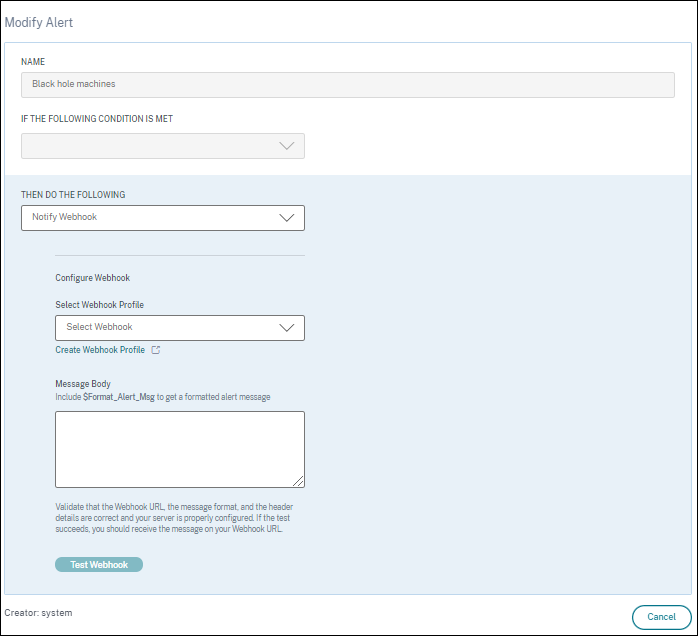
- Modify Alert page opens. In the Then do the following drop-down list, select Notify webhook or Email or Notify webhook as required.
- If you have the webhook profile already created, choose the correct webhook from the Select Webhook Profile drop-down list.
-
In the Message Body text box, include the
$Format_Alert_Msgstring to get a regular alert message with a templated string stored in the back-end. For example to send alert message to Slack, you can use this format:{"text":"$Format_Alert_Msg" }.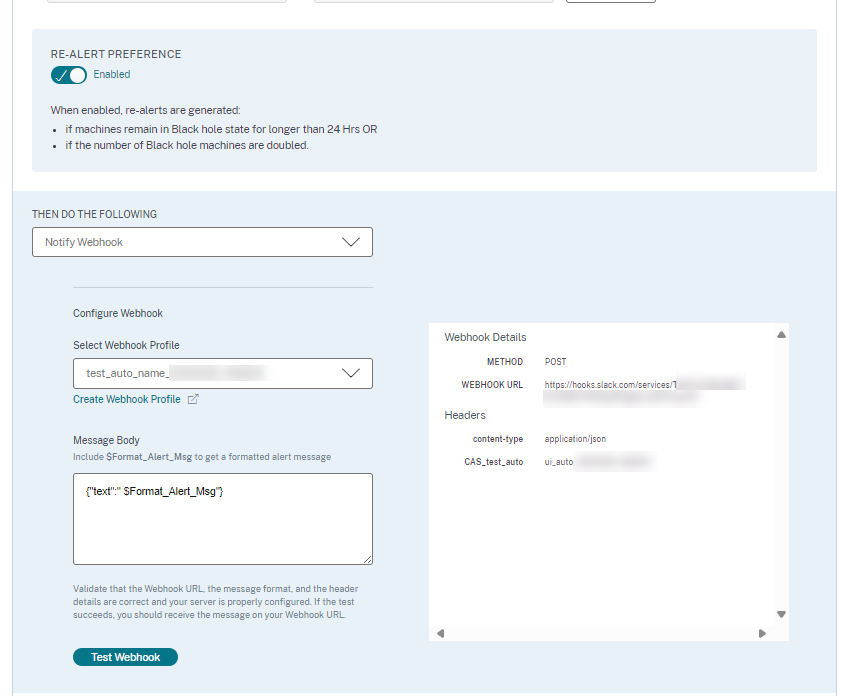
CSV attachments in alert mailers
Black hole Machines, Overloaded Machine and Zombie Session alerts emails have CSV attachments containing information about the affected machines and sessions. The attachment has the following data:
- Machine Name
- Site ID
- Catalog Name
- Delivery Group Name
- Failure count (Number of failed machines or sessions as applicable).
The CSV attachments in alert mailers help identify faulting machines and sessions without having to log on to Citrix Analytics for Performance. This helps establish automation pipelines to create and forward tickets to stakeholders responsible for speedy resolution of issues.
Exclude delivery groups from receiving alerts
You can now specify delivery groups to be excluded from receiving alert notifications. You can remove unused delivery groups or those created for testing purposes from the alerting process. Excluding delivery groups helps reduce alert fatigue and improve the relevance of alerts.
Customize Alert Parameters
Alert policies are pre-built with default parameter values. You can modify the alert parameters to make them more relevant to your environment.
Click the alert policy name to open the Modify Alert window. Modify the values of the listed parameters to suit your environment. Subsequent alert notifications are generated based on the custom conditions.
Note: Updating the alert parameters also alters the calculation of the corresponding insight on the UX dashboard.
In alerts where re-alerting is supported, you can also control the re-alerting preference. Alert notifications are resent if the re-alert preference is set to Enabled and the conditions as specified in the re-alert preference persist.
Customized alerts are more relevant to your environment, they help identify anomalies easily, and are more dependable for proactive monitoring.
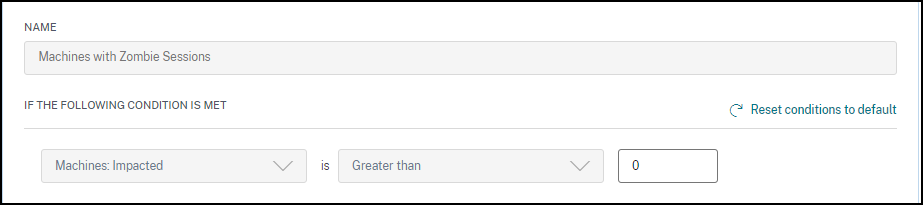
Alert for Machines with Zombie Sessions
The Machines with Zombie Sessions alert mail is generated when a new machine with a zombie session is detected in the environment in a 15 mins interval.
You can customize the alert conditions for the Machines with Zombie Sessions alert.
An email alert containing details of the number of machines with zombie sessions and session failures that have resulted due to zombie sessions is sent to the administrators. The numbers in the mailer are for the last 15 min interval.
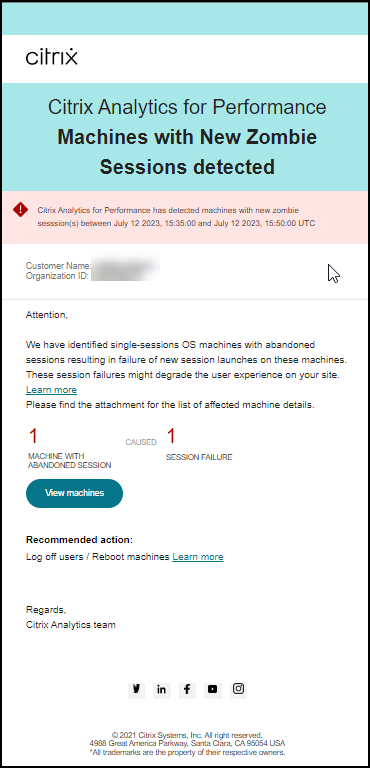
Click View machines in the mailer to see single-session machines with abandoned sessions on the Self-service view for Machines with Zombie Sessions. The view reflects the 15 min interval as per the mailer, use the time navigator to choose a larger time window.
Re-alerting on the same machine is done only if the same-abandoned session persists on the same machine for over 24 hours from the initial detection. The re-alerting preference for this alert cannot be set to disabled.
Alert for Sessions with Anomalous Latency
Anomalous Latency is the primary cause for poor session experience. The Anomalous Latency alerts help administrators when there is a significant deviation in the session latency values. The proactive alerting helps administrators identify specific users whose sessions have poor responsiveness.
You can customize the alert conditions for the Sessions with Anomalous Latency alert.
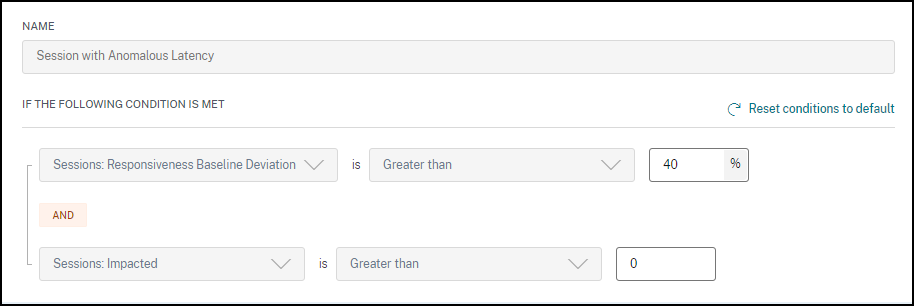
Updating the parameters alters the calculation of the Baseline Insight for Sessions with Anomalous Responsiveness.
This alert shows the number of sessions and users whose session latency readings deviate from the user’s 30-day baseline value. The user-specific baseline is calculated using the P95 ICARTT values measured over the last 30 days.
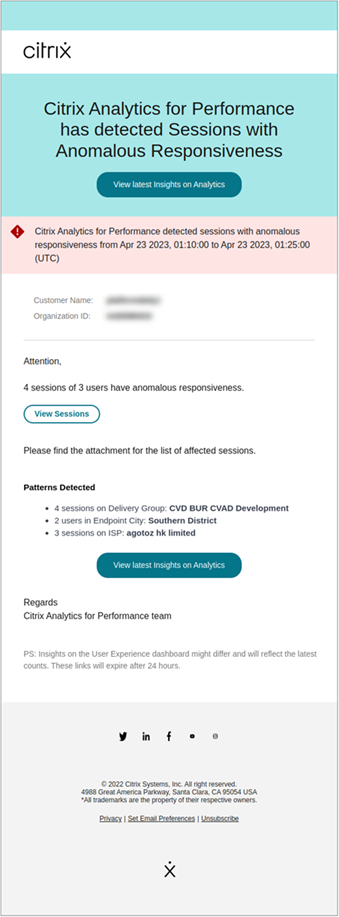
The alert mail shows the number of sessions and users facing anomalous responsiveness in the mentioned time period. Click View Sessions to see the sessions with anomalous responsiveness listed in the Sessions self-service page.
The Patterns Detected section shows the top three patterns noticed in sessions with anomalous responsiveness based on the following criteria:
- Number of sessions with anomalous responsiveness in each Delivery Group
- Number of users with anomalous responsiveness in each Endpoint City
- Number of sessions with anomalous responsiveness in each ISP
The View latest insights on Analytics link leads to the User Experience dashboard showing the latest statistics in the Insights panel. Analyze the Location, ICARTT, ISP, Bandwidth, and Latency metrics for a specific session to root cause the issue. For more information about the indicators available in the Sessions based Self-service view, see Self-service search for sessions.
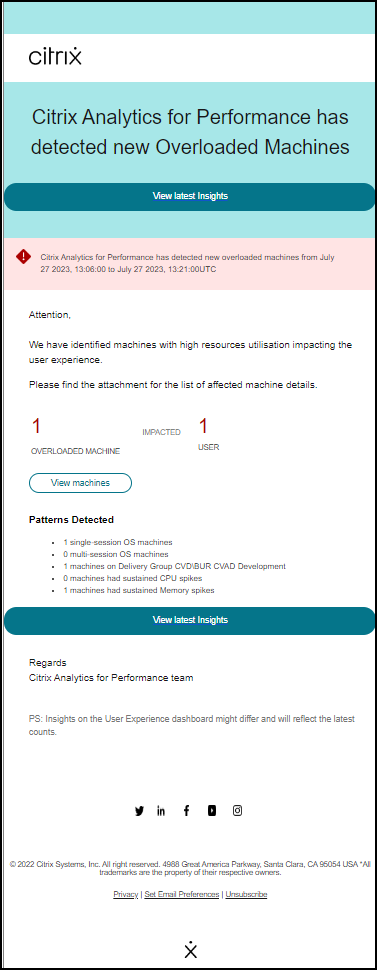
Alert for Overloaded Machines
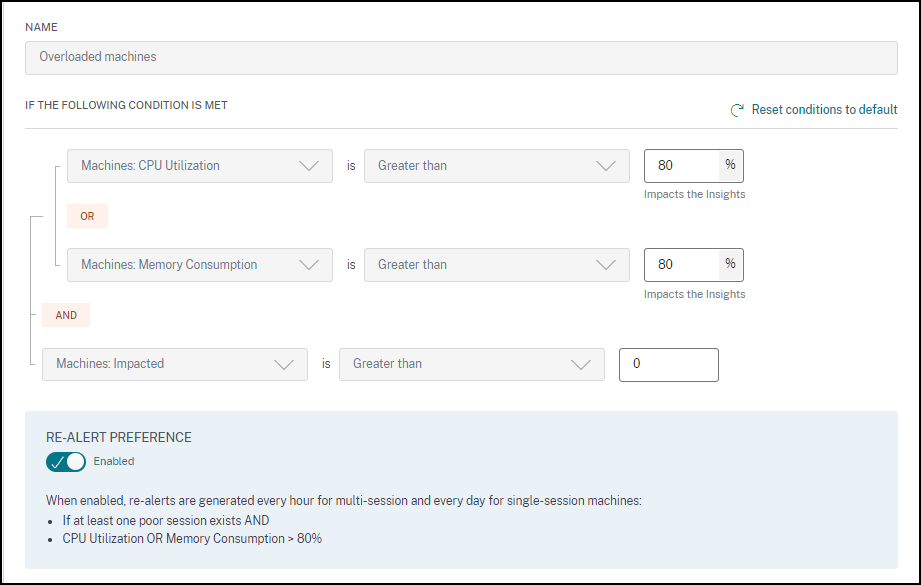
Machines that have experienced sustained CPU spikes, or high memory usage, or both, that have lasted for 5 minutes or more, resulting in a poor user experience during the selected interval are considered to be overloaded.
You can customize the alert conditions and the re-alert preference for the Overloaded Machines alert.
An Overloaded Machines alert mail is sent to administrators when an overloaded machine is detected in the environment in a 15-minute interval.
If the machine remains in an overloaded condition, re-alert mails are generated,
- in the case of a single-session machine, once in 24 hours,
- in the case of multi-session machines, up to three times on the first day if the machine has a new session with poor Session Score and once after 24 hours.
The alert mail shows the number of overloaded machines causing poor user experience and the number of users affected during the selected duration.
Click View Machines to see the overloaded machines listed in the Machines self-service page for Overloaded Machines.
The Patterns Detected section shows the top three patterns noticed in overloaded machines with respect to the following criteria:
- Number of overloaded machines in each Delivery Group
- Number of overloaded machines running single-session or multi-session OS
- Number of overloaded machines with Sustained Memory or CPU spikes
The View latest insights link leads to the User Experience dashboard showing the latest statistics in the Insights panel.
Updating the parameters alters the calculation of the Diagnostic Insight for Overloaded Machines.
For more information, see the Insights article.
Alert for Black Hole Machines
Citrix Analytics for Performance scans for black hole machines every 15 minutes and sends out an alert to enable administrators to proactively mitigate session failures faced by users due to black hole machines. Machines that have failed to service four or more consecutive session requests are termed as Black hole machines. With black hole failure alerting, administrators need not be logged into Performance Analytics to know the session failures that occurred due to black hole machines.
You can customize alert conditions and the re-alert preference for the Black Hole Machines alert.
Details of the machines and the session failures caused by them are sent in the alert mails to administrators. The Black Hole Machines alert policy must be enabled to receive these mails.
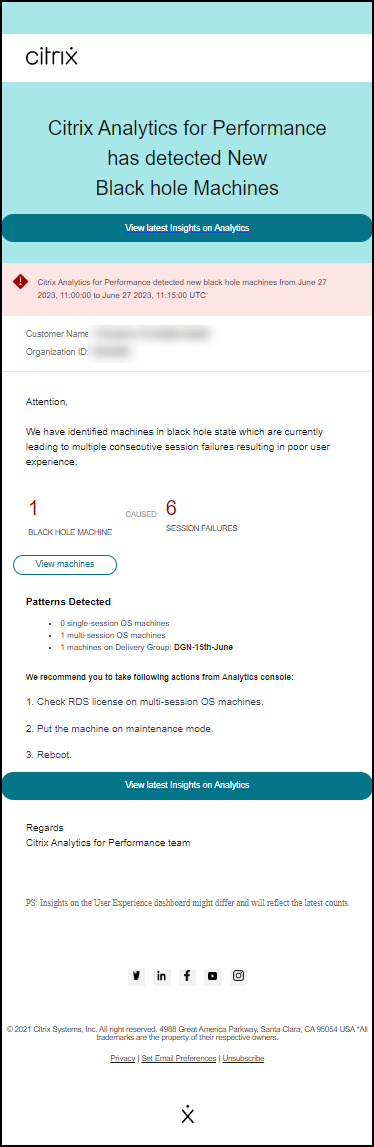
Clicking the View machines link takes you to the Machines self-service view displaying the list of black hole machines during the 15 min interval. In addition, the timeline view shows black hole machines identified over the last 24 hours. Administrators are re-alerted if the number of session failures due to the same black hole machine is doubled within 24 hours and the re-alerting preference is set to Enabled.
The View latest insights link leads to the User Experience dashboard showing the latest statistics in the Insights panel.
The Patterns Detected section shows the top three patterns noticed in black hole machines with respect to the following criteria:
- Number of black hole machines in each Delivery Group
- Number of black hole machines running single-session or multi-session OS
Updating the parameters alters the calculation of the Diagnostic Insight for Black Hole Machines. For more information, see the Insights article.
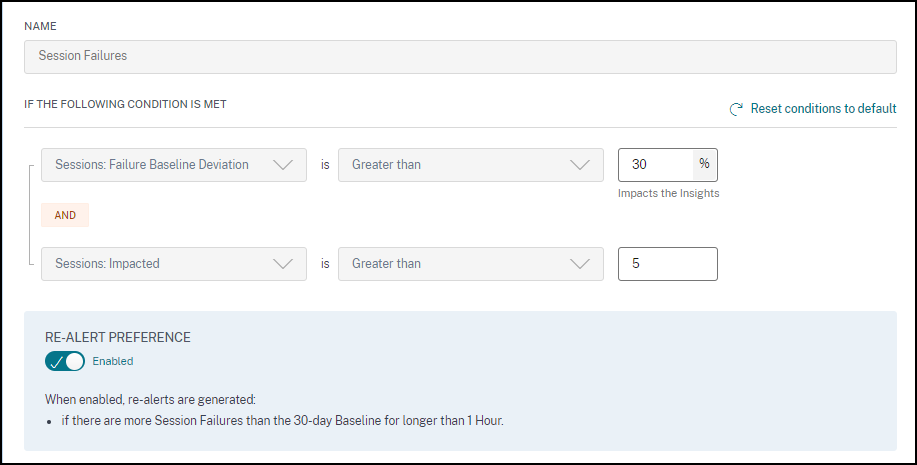
Alert for Session Failures
The Session Failures alert is generated when the number of sessions that have failed to launch has exceeded by 30% or more from the 30-day baseline value and more than 5% of the total number of sessions have failed. The baseline value is calculated as the P80 value of the session failure count measured during the last 30 days for the same time frame.
You can customize alert conditions and the re-alert preference for the Session Failures alert.

Session Failures alert notification is mailed to all configured administrators.
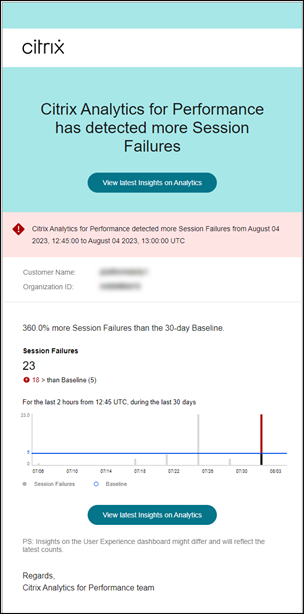
The Session Failures alert mail displays the following information:
- the percentage change in the current session failure count compared to the baseline value
- the current number of session failures
- increase in the number of session failures with respect to the baseline value
- a graph showing the baseline value and session failure count plotted over the last 30 days.
The View latest insights link leads to the User Experience dashboard showing the latest statistics in the Baseline Insights panel.
Updating the parameters alters the calculation of the Baseline Insight for Session Failures. For more information, see the Insights article.
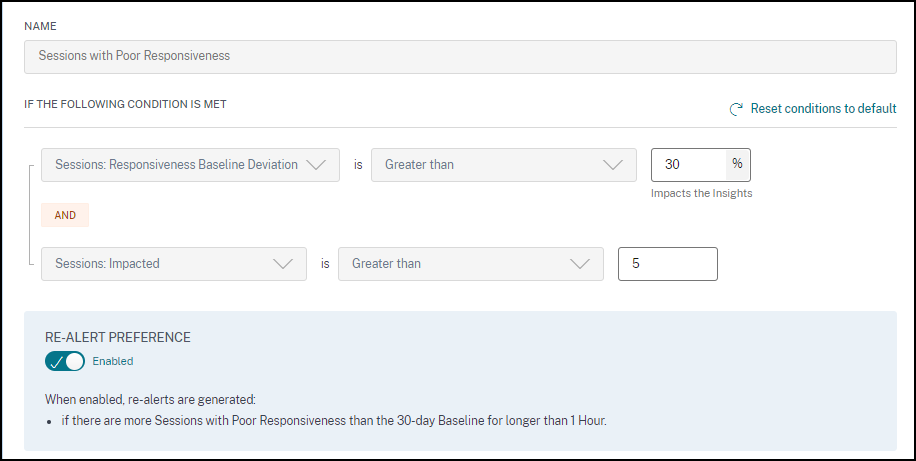
Alert for Sessions with Poor Responsiveness
The Sessions with Poor Responsiveness alert is generated when the number of sessions with poor responsiveness has increased 30% or more from the 30-day baseline value and this increase impacts more than 5% of the sessions. The baseline value is calculated as the P80 value of the number of sessions with poor responsiveness measured during the last 30 days for the same time frame.
You can customize alert conditions and the re-alert preference for the Sessions with Poor Responsiveness alert.
Sessions with Poor Responsiveness alert notification is mailed to the configured administrators.
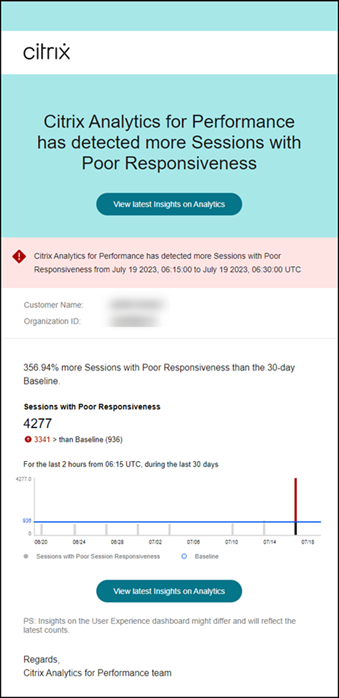
The alert mail contains the following information:
- the percentage change in the current number of sessions with poor responsiveness value compared to the baseline value
- the current number of sessions with poor responsiveness
- the increase or decrease in the sessions with poor responsiveness with respect to the baseline value
- a graph showing the baseline value and the number of sessions with poor responsiveness trend over the last 30 days.
The View latest insights link leads to the User Experience dashboard showing the latest statistics in the Insights panel.
Updating the parameters alters the calculation of the Baseline Insight for Sessions with Poor Responsiveness. For more information, see the Insights article.
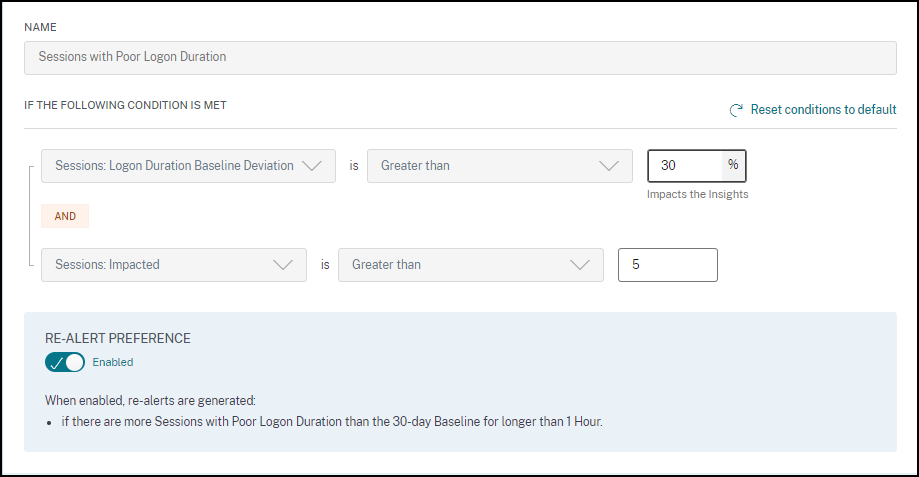
Alert for Sessions with Poor Logon Duration
The Sessions with Poor Logon Duration alert is generated when the number of sessions with poor logon duration has increased 30% or more from the 30-day baseline value and this increase impacts more than 5% of the sessions. The baseline value is calculated as the P80 value of the number of sessions with poor logon duration measured during the last 30 days for the same time frame.
You can customize alert conditions and the re-alert preference for the Sessions with Poor Logon Duration alert.
Sessions with Poor Logon Duration alert notification is mailed to the configured administrators.
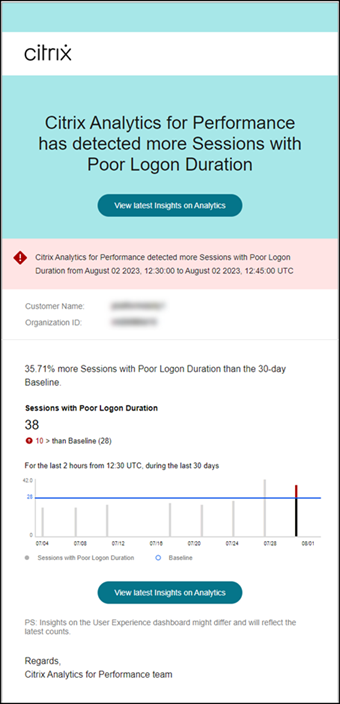
The Sessions with Poor Logon Duration alert mail shows the following information:
- the percentage change in the current number of sessions with poor logon duration value compared to the baseline value
- the current number of sessions with poor logon duration
- increase or decrease in the sessions with poor logon duration with respect to the baseline value
- a graph showing the baseline value and the number of sessions with poor logon duration plotted over the last 30 days
The View latest insights link leads to the User Experience dashboard showing the latest statistics in the Baseline Insights panel.
For more information, see the Insights article.
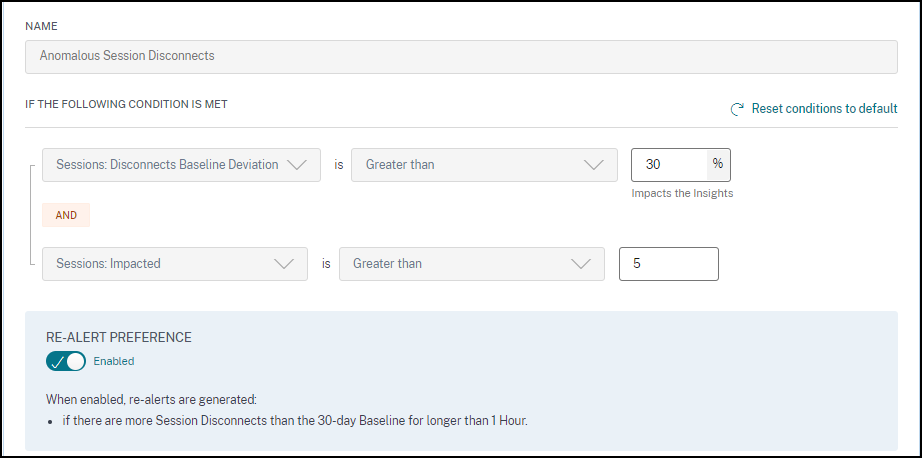
Alert for Anomalous Session Disconnects
The Anomalous Session Disconnects alert is generated when the session disconnects count has increased 30% or more from the 30-day baseline value and this increase impacts more than 5% of the sessions. The baseline value is calculated as the P80 value of the number of sessions disconnects measured during the last 30 days for the same time frame.
You can customize alert conditions and the re-alert preference for the Anomalous Session Disconnects alert.
Sessions with Poor Logon Duration alert notification is mailed to the configured administrators.
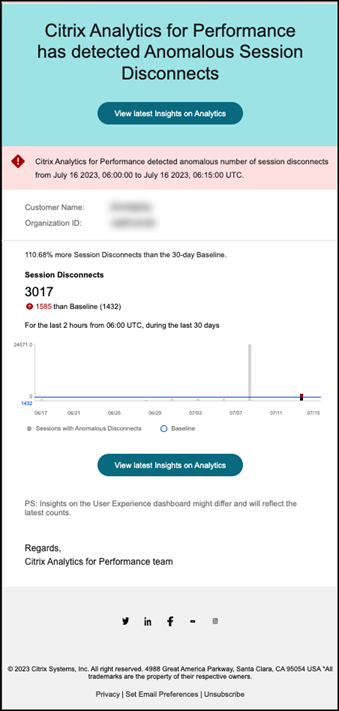
The Anomalous Sessions Disconnects alert mail shows the following information:
- the percentage change in the current session disconnects count as compared to the baseline value
- the current number of session disconnects
- increase in session disconnects with respect to the baseline value
- a graph showing the baseline value and the number of session disconnects plotted over the last 30 days.
The View latest insights link leads to the User Experience dashboard showing the latest statistics in the Baseline Insights panel.
Updating the parameters alters the calculation of the Baseline Insight for Anomalous Session Disconnects. For more information, see the Insights article.
In this article
- Webhook Support for Alert Notifications
- CSV attachments in alert mailers
- Exclude delivery groups from receiving alerts
- Customize Alert Parameters
- Alert for Machines with Zombie Sessions
- Alert for Sessions with Anomalous Latency
- Alert for Overloaded Machines
- Alert for Black Hole Machines
- Alert for Session Failures
- Alert for Sessions with Poor Responsiveness
- Alert for Sessions with Poor Logon Duration
- Alert for Anomalous Session Disconnects