Insights
The Insights panel provides information on the root causes for session failures in your environment. Drilling deeper into specific metrics with these insights helps troubleshoot and resolve session failures faster. Failure Insights specifically help administrators to improve the session availability, which is an important factor that determines user experience. These insights are designed to aid in proactive monitoring of the user experience. Hence, Insights are displayed for a maximum duration of the 1 day even if a 1 month or 1 week time period is selected on the dashboard.
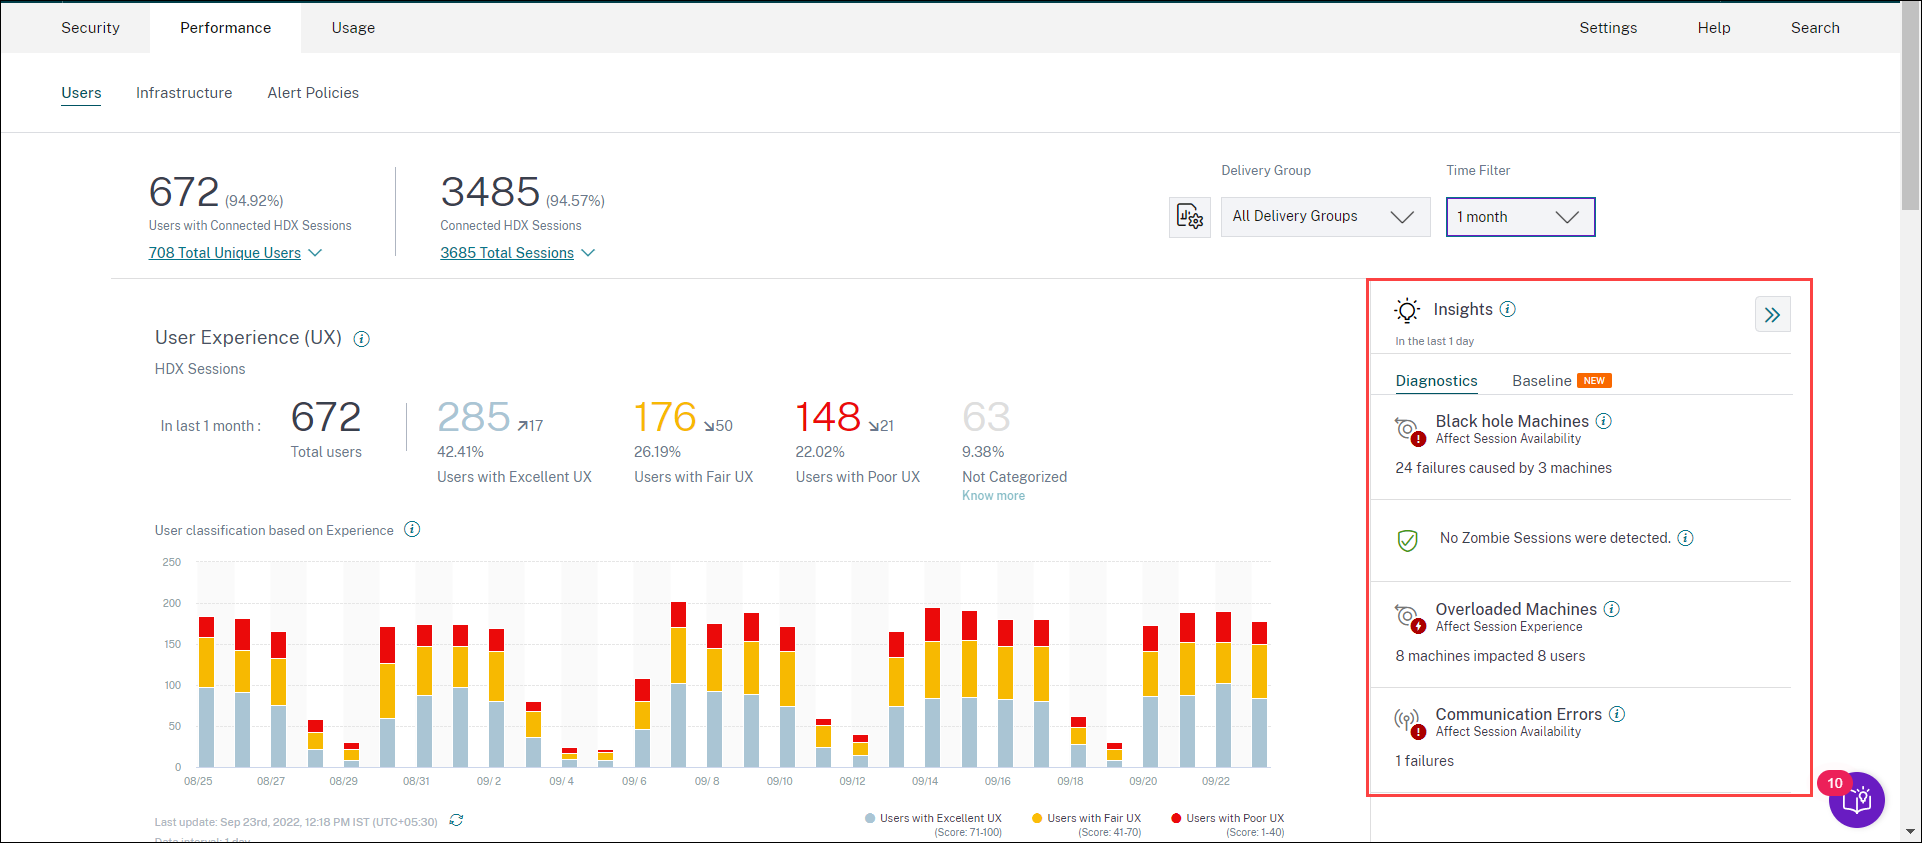
Clicking the insight from the summary pane displays the insight pane with details about the insight and options to drilldown to the Self-service views.
Insights are displayed in two categories:
-
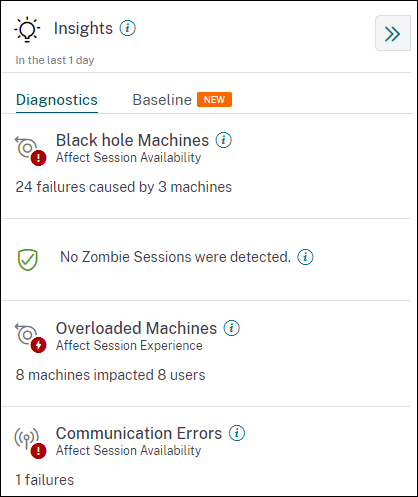
Diagnostic Insights: The Diagnostic subpane shows crucial insights about failures that have occurred on the site. The Blackhole Machines, Zombie Sessions, Overloaded Machines, and Communication Error Diagnostic Insights are available in this subpane. Each insight upon expansion displays a link to the failed sessions or the machines hosting them. This leads to the self-service view containing the failed machines or sessions. Further drill-down is possible from here when you click a specific machine, session, or connector and see the timeline details and the detailed metrics.
Top failure patterns detected with respect to the site, Delivery Group, single or multi-OS session machines is displayed. These patterns are aimed to help you spot if there is a specific cohort of users experiencing the issue. In cases where the system is unable to highlight any pattern due to a distributed cohort, it is recommended to drill down to self-analyze. Also, actions that are recommended to be taken to troubleshoot and resolve the issues are shown.
-
Baseline Insights: The Baseline Insights provide the deviation of key performance metrics from the historical baseline. These insights show if key metrics are improving or deteriorating in a glance. They help spot incident indicators quickly and take proactive steps to improve the performance of your environment.
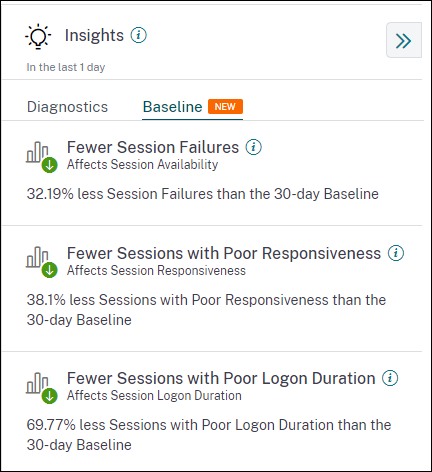
Baseline Insights for Poor Session Failures, Session Responsiveness, and Session Logon Duration are available on the Baseline subpane. The panes show if you have fewer or more sessions with Session Failures, Poor Session Responsiveness, and Poor Session Logon Duration. The baseline is based on the P80 value of the metric over the last 30 days measured during the same time interval as the one for which the insight is being derived. The P80 value is used to ensure that outlier conditions like outages do not inflate the baseline. For example, if the current time stamp is Sep 23, 2022, 02:35 PM, and you choose to see the Session Failure Baseline Insights for the last 2 hours. The baseline is calculated as the P80 value of Session Failures during the interval 012:35 p.m. - 02:35 p.m. over the last 30 days.
Note:
- Baseline Insights are available seven days after a new customer is onboarded.
- Updating alert parameters also alters the calculation of the corresponding insight on the UX dashboard. For more information, see Alerts.
Diagnostic Insights: Black hole machines
Some machines in your environment though registered and appearing healthy might not service sessions brokered to them, resulting in failures. Machines that have failed to service four or more consecutive session requests are termed as Black hole machines. The reasons for these failures are related to various factors that might affect the machine, such as insufficient RDS licenses, intermittent networking issues, or instantaneous load on the machine. These failures do not include failures due to capacity or license availability. The presence of black hole machines in the environment increases session failures resulting in poor session availability. The Black hole machines insights show the number of black hole machines identified in your environment during the selected time period.
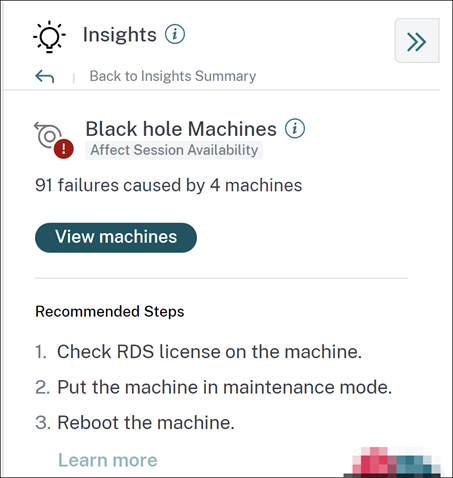
Clicking View machines opens the Machines based self-service view that is filtered to show all the black hole machines in your environment during the selected time period. Here, you can analyze the individual performance metrics of the machine to identify and understand possible reasons for the machine not accepting session requests. For more information about the performance indicators available on the Machines based self-service view, see Self-service search for Machines. Further, clicking the machine name opens the Machine Statistics view that helps correlate the resource performance parameters of the machine with the session performance parameters during the same time period. For more information see the Machine Statistics view article.
Recommended Steps to help reduce the number of black holes are provided,
- to check the RDS license status,
- to put the machine in maintenance mode, or
- to reboot the machine.
The Patterns Detected section shows the top three patterns noticed in black hole machines with respect to the following criteria:
- Number of black hole machines in each Delivery Group
- Number of black hole machines running single-session or multi-session OS
For more information about Black Hole Machine Alerts, see the Alerts article.
Diagnostic Insights: Communication Errors
The Communication Errors subpane lists the number of session failures due to communication errors between the endpoint (where the user launches the session) and the machine. These errors can occur due to incorrect firewall configurations or other errors on the network path.
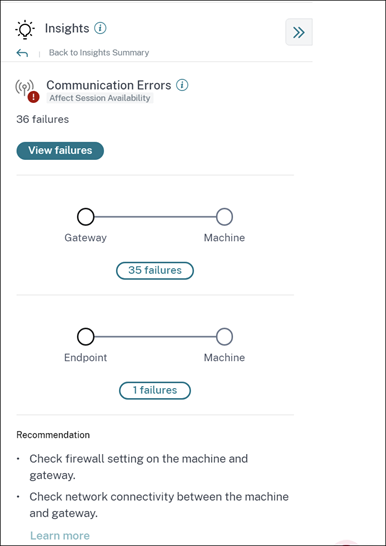
The two categories of communication errors are:
- Endpoint to machine—lists the sessions where communication errors have occurred between the endpoint and the machine.
- Gateway to machine—lists the sessions where communication errors have occurred between the gateway and the machine.
Additionally, the Communication Error subpane displays the following recommendations to resolve the errors.
- Check the firewall settings on the machine and gateway.
- Check network connectivity between the machine and gateway.
Clicking the failure number opens the sessions based self-service view that is filtered to show all the sessions that have failed due to communication errors in your environment during the selected time period. This view helps analyze the individual sessions that have failed and get a possible root cause. For more information about the indicators available on the sessions based self-service view, see Self-service search for sessions.
Diagnostic Insights: Zombie sessions
The Zombie Sessions subpane shows information on session failures that have occurred due to zombie sessions in the environment. A zombie session is an abandoned session on a single-session OS machine resulting in new session launches on the machine to fail. Attempts to launch sessions on this machine fails with an Unavailable Capacity error. All future session launch attempts fail until the abandoned session is terminated. Zombie Sessions insights aim to help in spotting these machines with abandoned sessions and to proactively mitigate these failures.
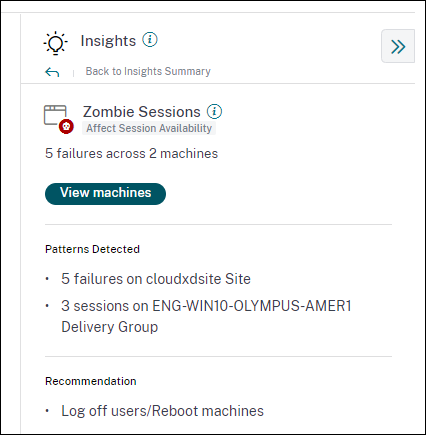
Click View machines to go to the Self-service view filtered with the list of machines containing Zombie Sessions.
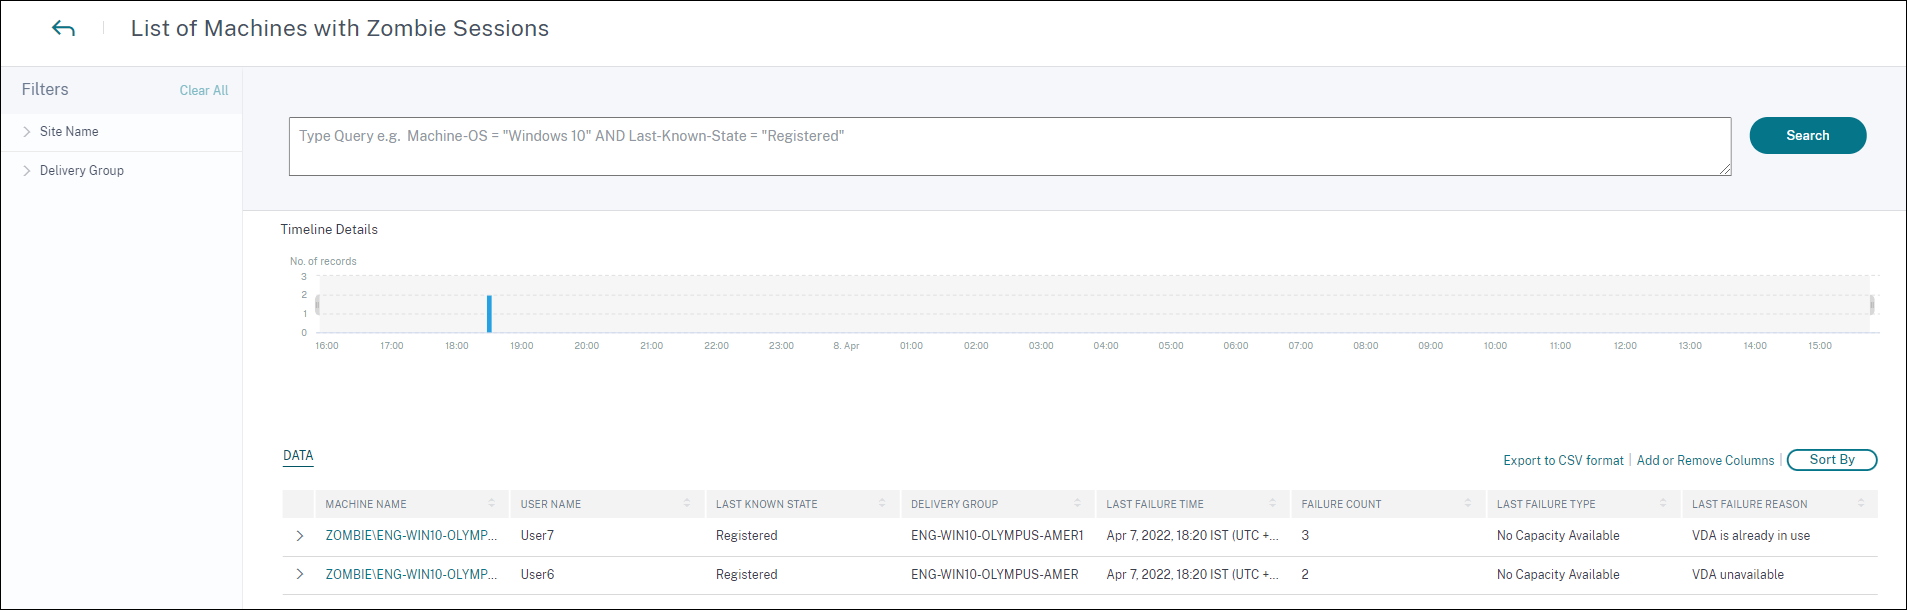
Here, Failure Count represents the number of session failures that have occurred in the selected interval. The Last Failure Type and Reason help root cause reasons for machines containing zombie sessions.
A Zombie session alert mail is generated when a new machine with a zombie session is detected in the environment in a 15 mins interval. For more information, see the [Alert for Machines with Zombie Sessions] Self-service search for sessions article.
Recommended actions for Zombie Sessions
You can either log the users off or reboot the machines containing Zombie sessions.
-
You can log the users out of the zombie sessions using Monitor for Citrix DaaS sites. For more information, see the Site Analytics article.
-
You can reboot the machines containing zombie sessions from Performance Analytics, see the Machine actions article.
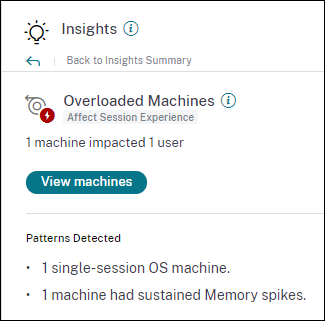
Diagnostic Insights: Overloaded Machines
Overloaded Machines Insight gives visibility into overloaded resources causing poor experience. Machines that have experienced sustained CPU spikes, or high memory usage, or both, that have lasted for 5 minutes or more, resulting in a poor user experience in the selected duration are considered to be overloaded. There might be other machines in the environment with high resource usage but not impacting the User Experience. These machines are not categorized as overloaded machines.
The Overloaded Machines Insight shows the number of overloaded machines and the number of users affected in the selected duration.
Click View Machines to see the overloaded machines listed on the Machines self-service page for Overloaded Machines. Overloaded machines are listed with the number of Sustained Memory and CPU Spikes that have occurred on these machines during the selected interval.
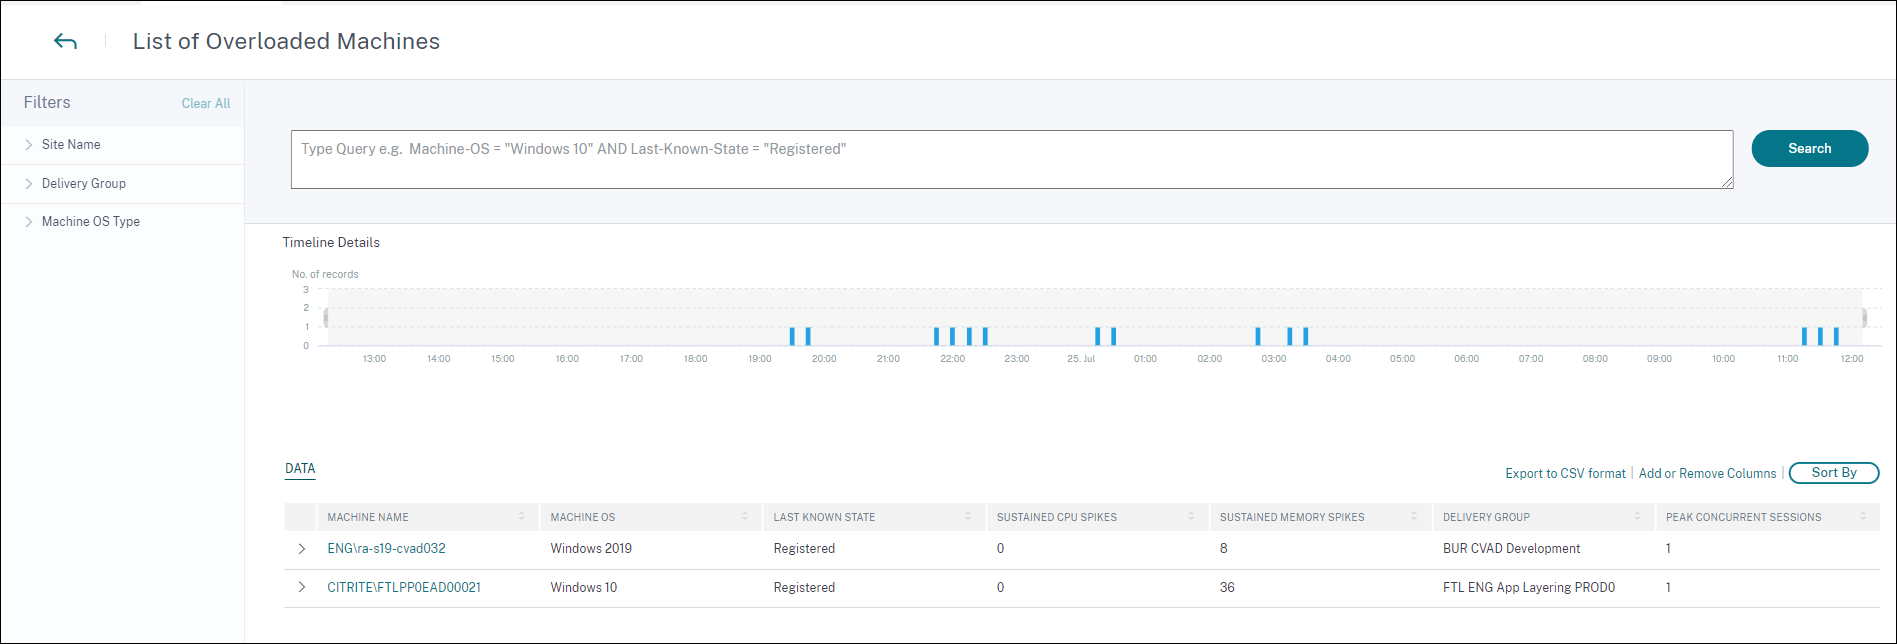
The timeline graph shows the number of machines that have been overloaded over the selected time interval plotted at a 15-minute interval. You can further click a specific machine to see the Machine Statistics view.
The Patterns Detected section shows the top three patterns noticed in overloaded machines with respect to the following criteria:
- Number of overloaded machines in each Delivery Group
- Number of overloaded machines running single-session or multi-session OS
- Number of overloaded machines with Sustained Memory or CPU spikes
For more information about Overloaded Machine Alerts, see the Alerts article.
Baseline Insights: Session Failures
This insight shows the deviation of the session failure count from the 30-day baseline value. The baseline value is calculated as the P80 value of the session failure count measured during the last 30 days for the same time frame.
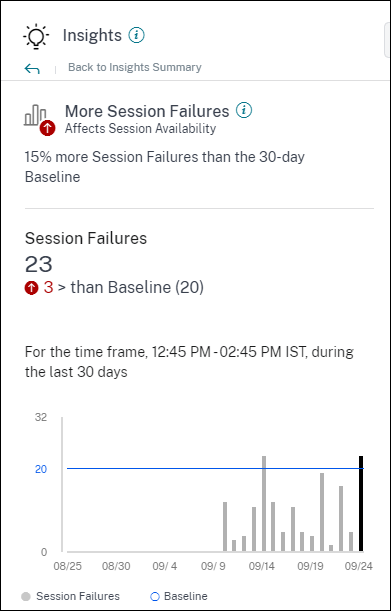 Session Failures Baseline insight on expansion shows the following:
- the percentage change in the current session failures count compared to the baseline value
- the current number of session failures
- increase or decrease in the number of session failures with respect to the baseline value
- a graph showing the baseline value and session failure count plotted over the last 30 days
Baseline Insights: Session Responsiveness
This insight shows the deviation of the number of sessions with poor responsiveness from the 30-day baseline value. The baseline value is calculated as the P80 value of the number of sessions with poor responsiveness measured during the last 30 days for the same time frame.
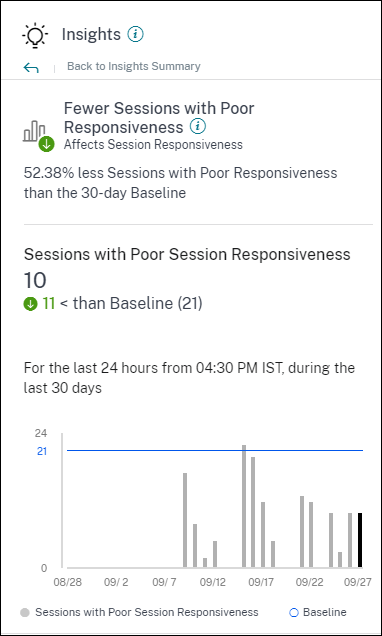
Session Responsiveness Baseline insight on expansion shows the following:
- the percentage change in the current number of sessions with poor responsiveness value as compared with the baseline value.
- the current number of sessions with poor responsiveness.
- increase or decrease in the number of sessions with poor responsiveness with respect to the baseline value
- a graph showing the baseline value and number of sessions with poor responsiveness plotted over the last 30 days
Baseline Insights: Session Logon Duration
The Sessions with Poor Logon Duration Baseline Insight shows the deviation of the number of sessions with poor logon duration from the 30-day baseline value. The baseline value is calculated as the P80 value of the number of sessions with poor logon duration measured during the last 30 days for the same time frame.
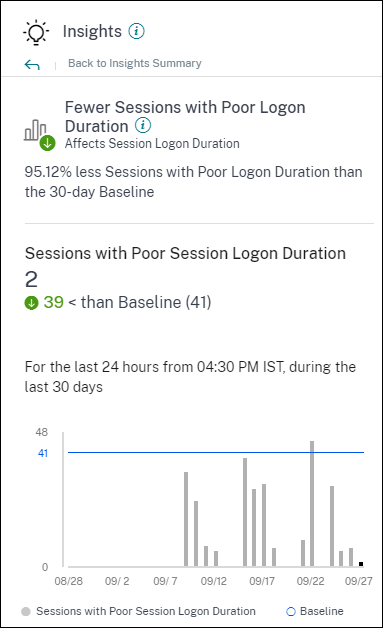
Session Logon Duration Baseline insight on expansion shows the following:
- the percentage change in the current number of sessions with poor logon duration as compared with the baseline value
- the current number of sessions with poor logon duration
- increase or decrease in the number of sessions with poor logon duration with respect to the baseline value
- a graph showing the baseline value and number of sessions with poor logon duration plotted over the last 30 days
Baseline Insights: Sessions with Anomalous Responsiveness
This insight shows the number of sessions and users whose responsiveness is higher than the 30-day user-specific baseline value for responsiveness. The baseline value is calculated using the P95 ICARTT values measured over the last 30 days for the same time frame.
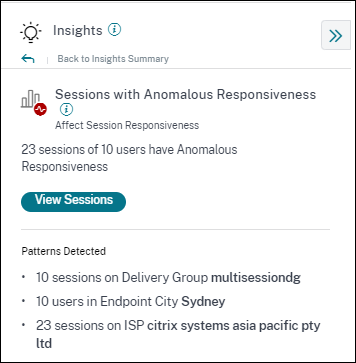
This insight on expansion shows the following data:
- View Sessions link takes you to the Self-Service view listing the sessions with anomalous responsiveness during the selected time frame.
- Top patterns detected with respect to Delivery Group, Endpoint City and ISP are displayed to help you spot if there is a specific cohort of users experiencing the issue.
Baseline Insights: Anomalous Session Disconnects
The Anomalous Session Disconnects Baseline Insight shows the deviation of the number of session disconnects from the 30-day baseline value. The baseline value is calculated as the P80 value of the number of session disconnects measured during the last 30 days for the same time frame.
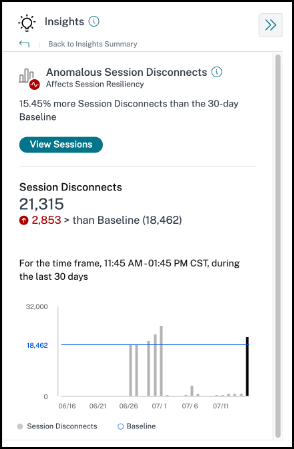
Session Disconnects Baseline insight on expansion shows the following:
- the percentage change in the current number of session disconnects as compared with the baseline value
- the current number of session disconnects
- increase or decrease in the number of session disconnects with respect to the baseline value
- a graph showing the baseline value and number of session disconnects plotted over the last 30 days
In this article
- Diagnostic Insights: Black hole machines
- Diagnostic Insights: Communication Errors
- Diagnostic Insights: Zombie sessions
- Diagnostic Insights: Overloaded Machines
- Baseline Insights: Session Failures
- Baseline Insights: Session Responsiveness
- Baseline Insights: Session Logon Duration
- Baseline Insights: Sessions with Anomalous Responsiveness
- Baseline Insights: Anomalous Session Disconnects