Site-level user activity reporting
Based on event detection in recorded sessions, Session Recording empowers you to identify incidents from events. It also displays the event and incident data in the cloud for aggregation and analysis, providing a comprehensive view of user activity across an entire site.
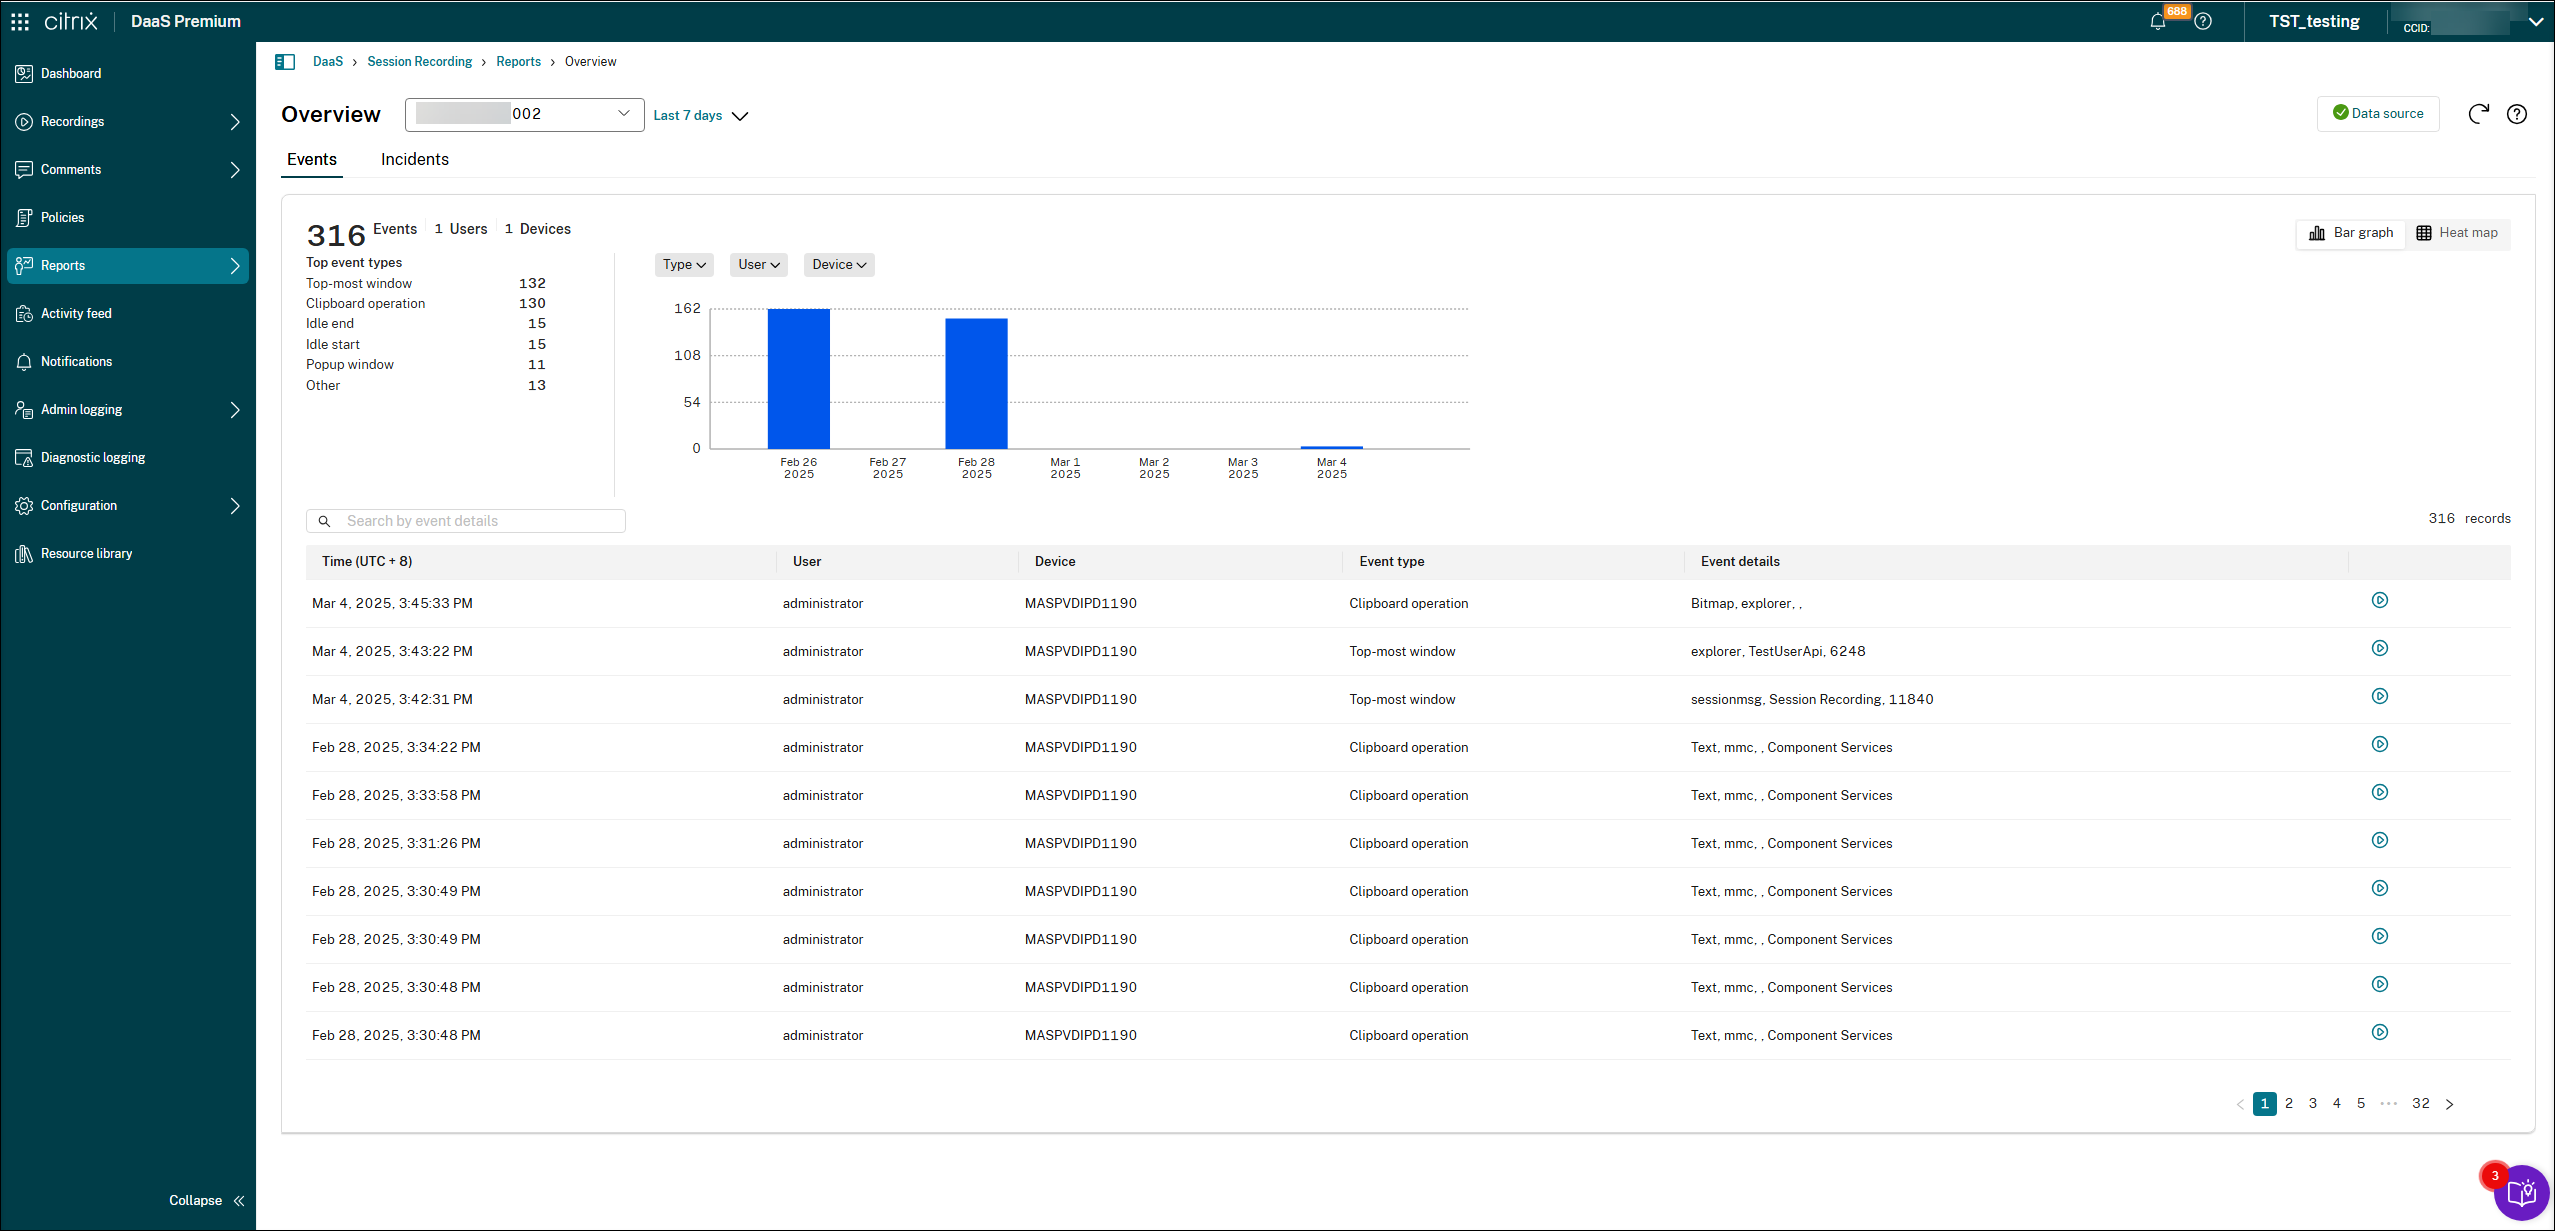
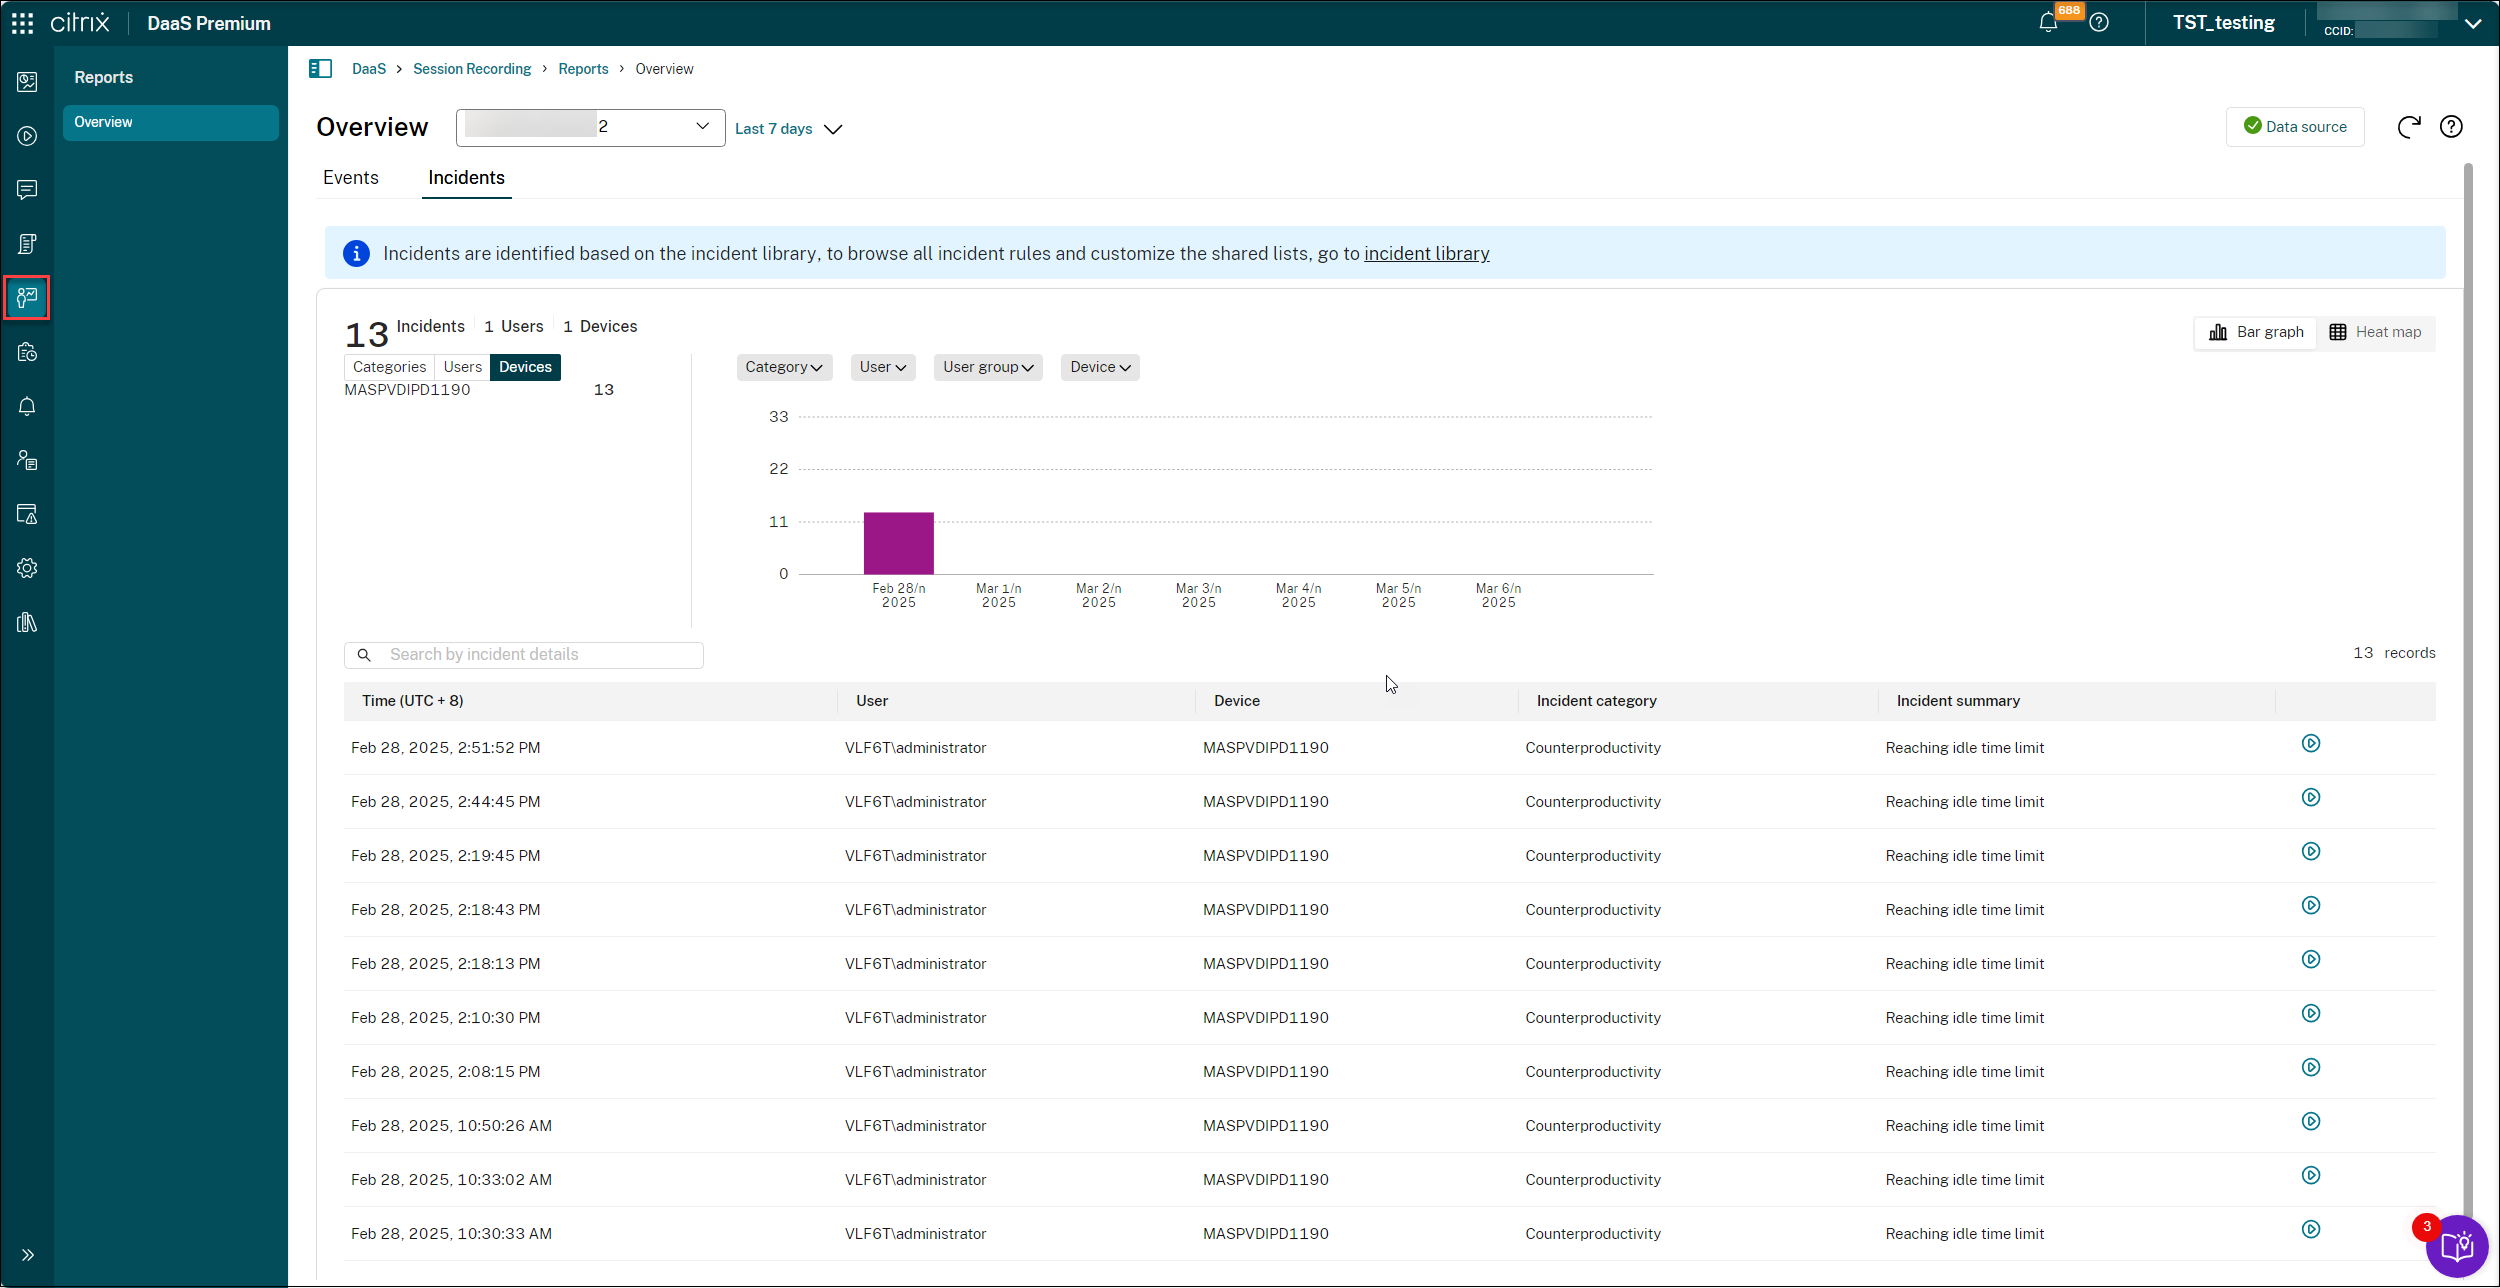
The following screen captures illustrate a site-specific overview of events and incidents.
This site-level reporting feature enables you to:
- Quickly filter incidents from events by category.
- Identify abnormal activity with greater efficiency.
- Gain a broader understanding of user activity patterns across your site.
Prerequisites
-
The availability of the event data in the cloud is solely determined by the active event detection policy, and is independent of settings or Session Recording server versions. Therefore, if the active policy dictates event data, it will always be displayed in the cloud.
-
The availability of the incident data in the cloud is governed by three factors: the active event detection policy, site-specific event data analysis settings, and incident library settings that identify incidents from events. Separately, Session Recording 2503 or later is required for incident identification and display in the cloud.
For information about the event detection policy settings, see Configure event detection policies.
For information about the event data analysis and incident library settings, see Configure site-level user activity reporting later in this article.
View site-specific user activity reports
Site-level user activity reporting delivers a comprehensive perspective of events and incidents across an entire site, enabling enhanced monitoring and analysis. To view site-specific user activity reports, proceed with the following steps:
- Sign in to Citrix Cloud.
- In the upper left menu, select My Services > DaaS.
- In the DaaS tile, scroll down in the left navigation pane and select Session Recording.
- In the Session Recording service view, select Reports from the left navigation.
-
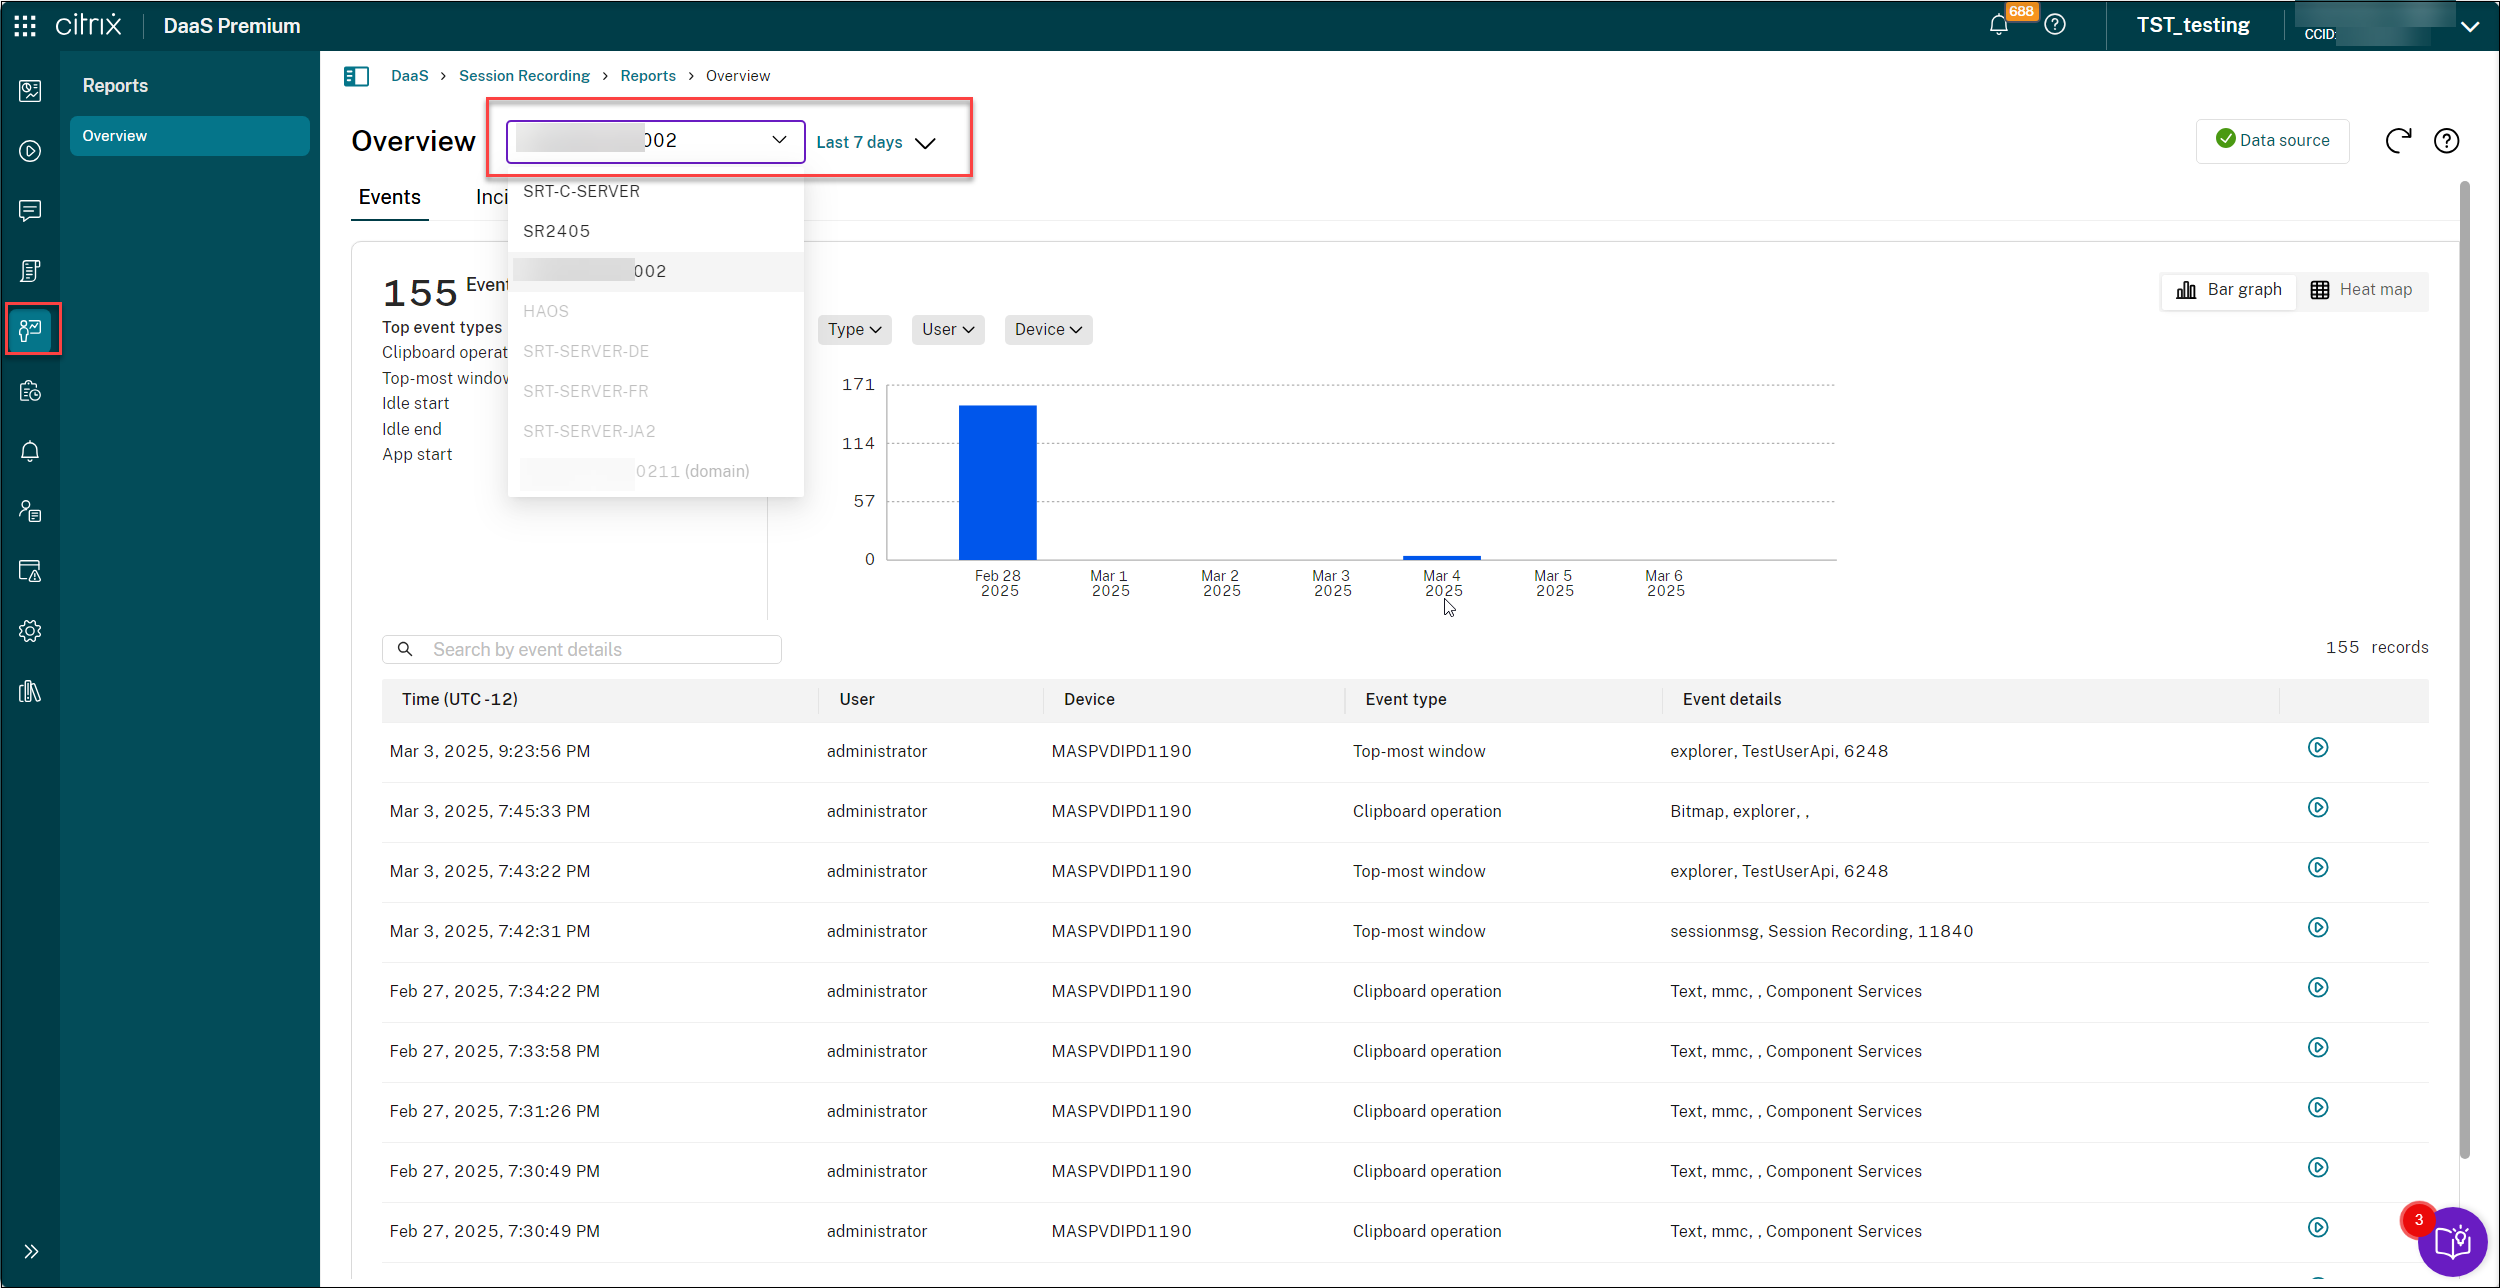
Select a target site and specify the time range and time zone.
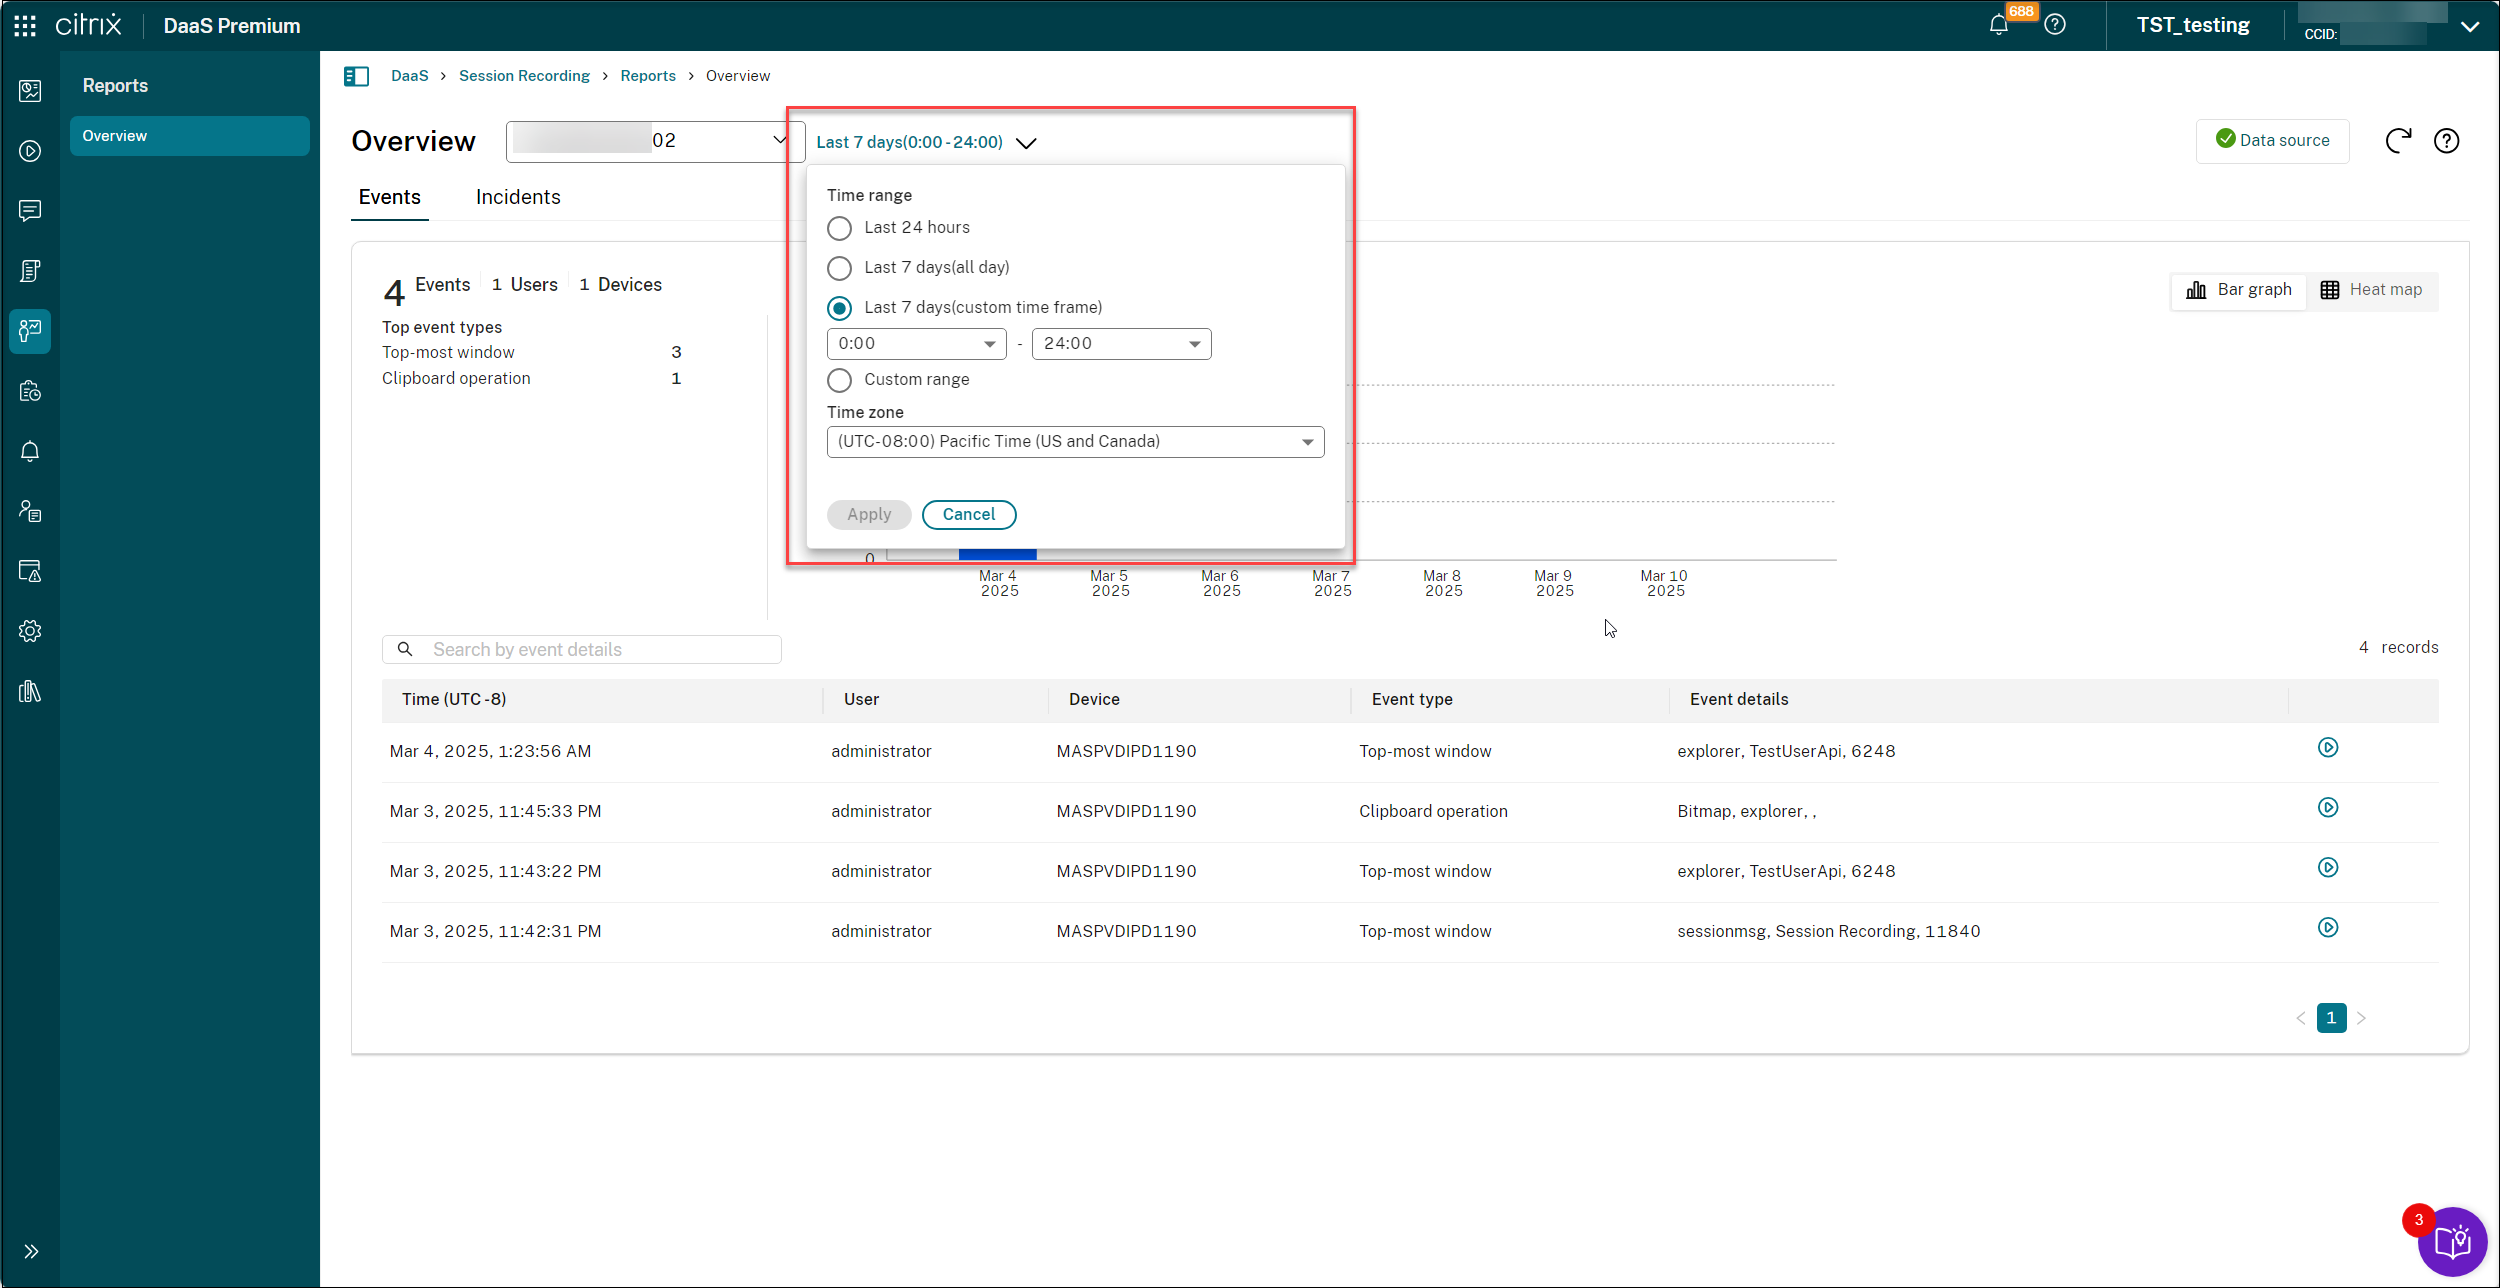
-
Use the Events and Incidents tabs to review detected events within recorded sessions and incidents identified from those events.
You can filter events and incidents for detailed analysis.
To find specific events on the Events tab, you can filter by event type, session user, and client device. You can also use the search box to find events by keyword. Filters are combined using ‘AND’.

To find specific incidents on the Incidents tab, you can filter by category, session user, user group, and client device. You can also use the search box to find events by keyword. Filters are combined using ‘AND’.

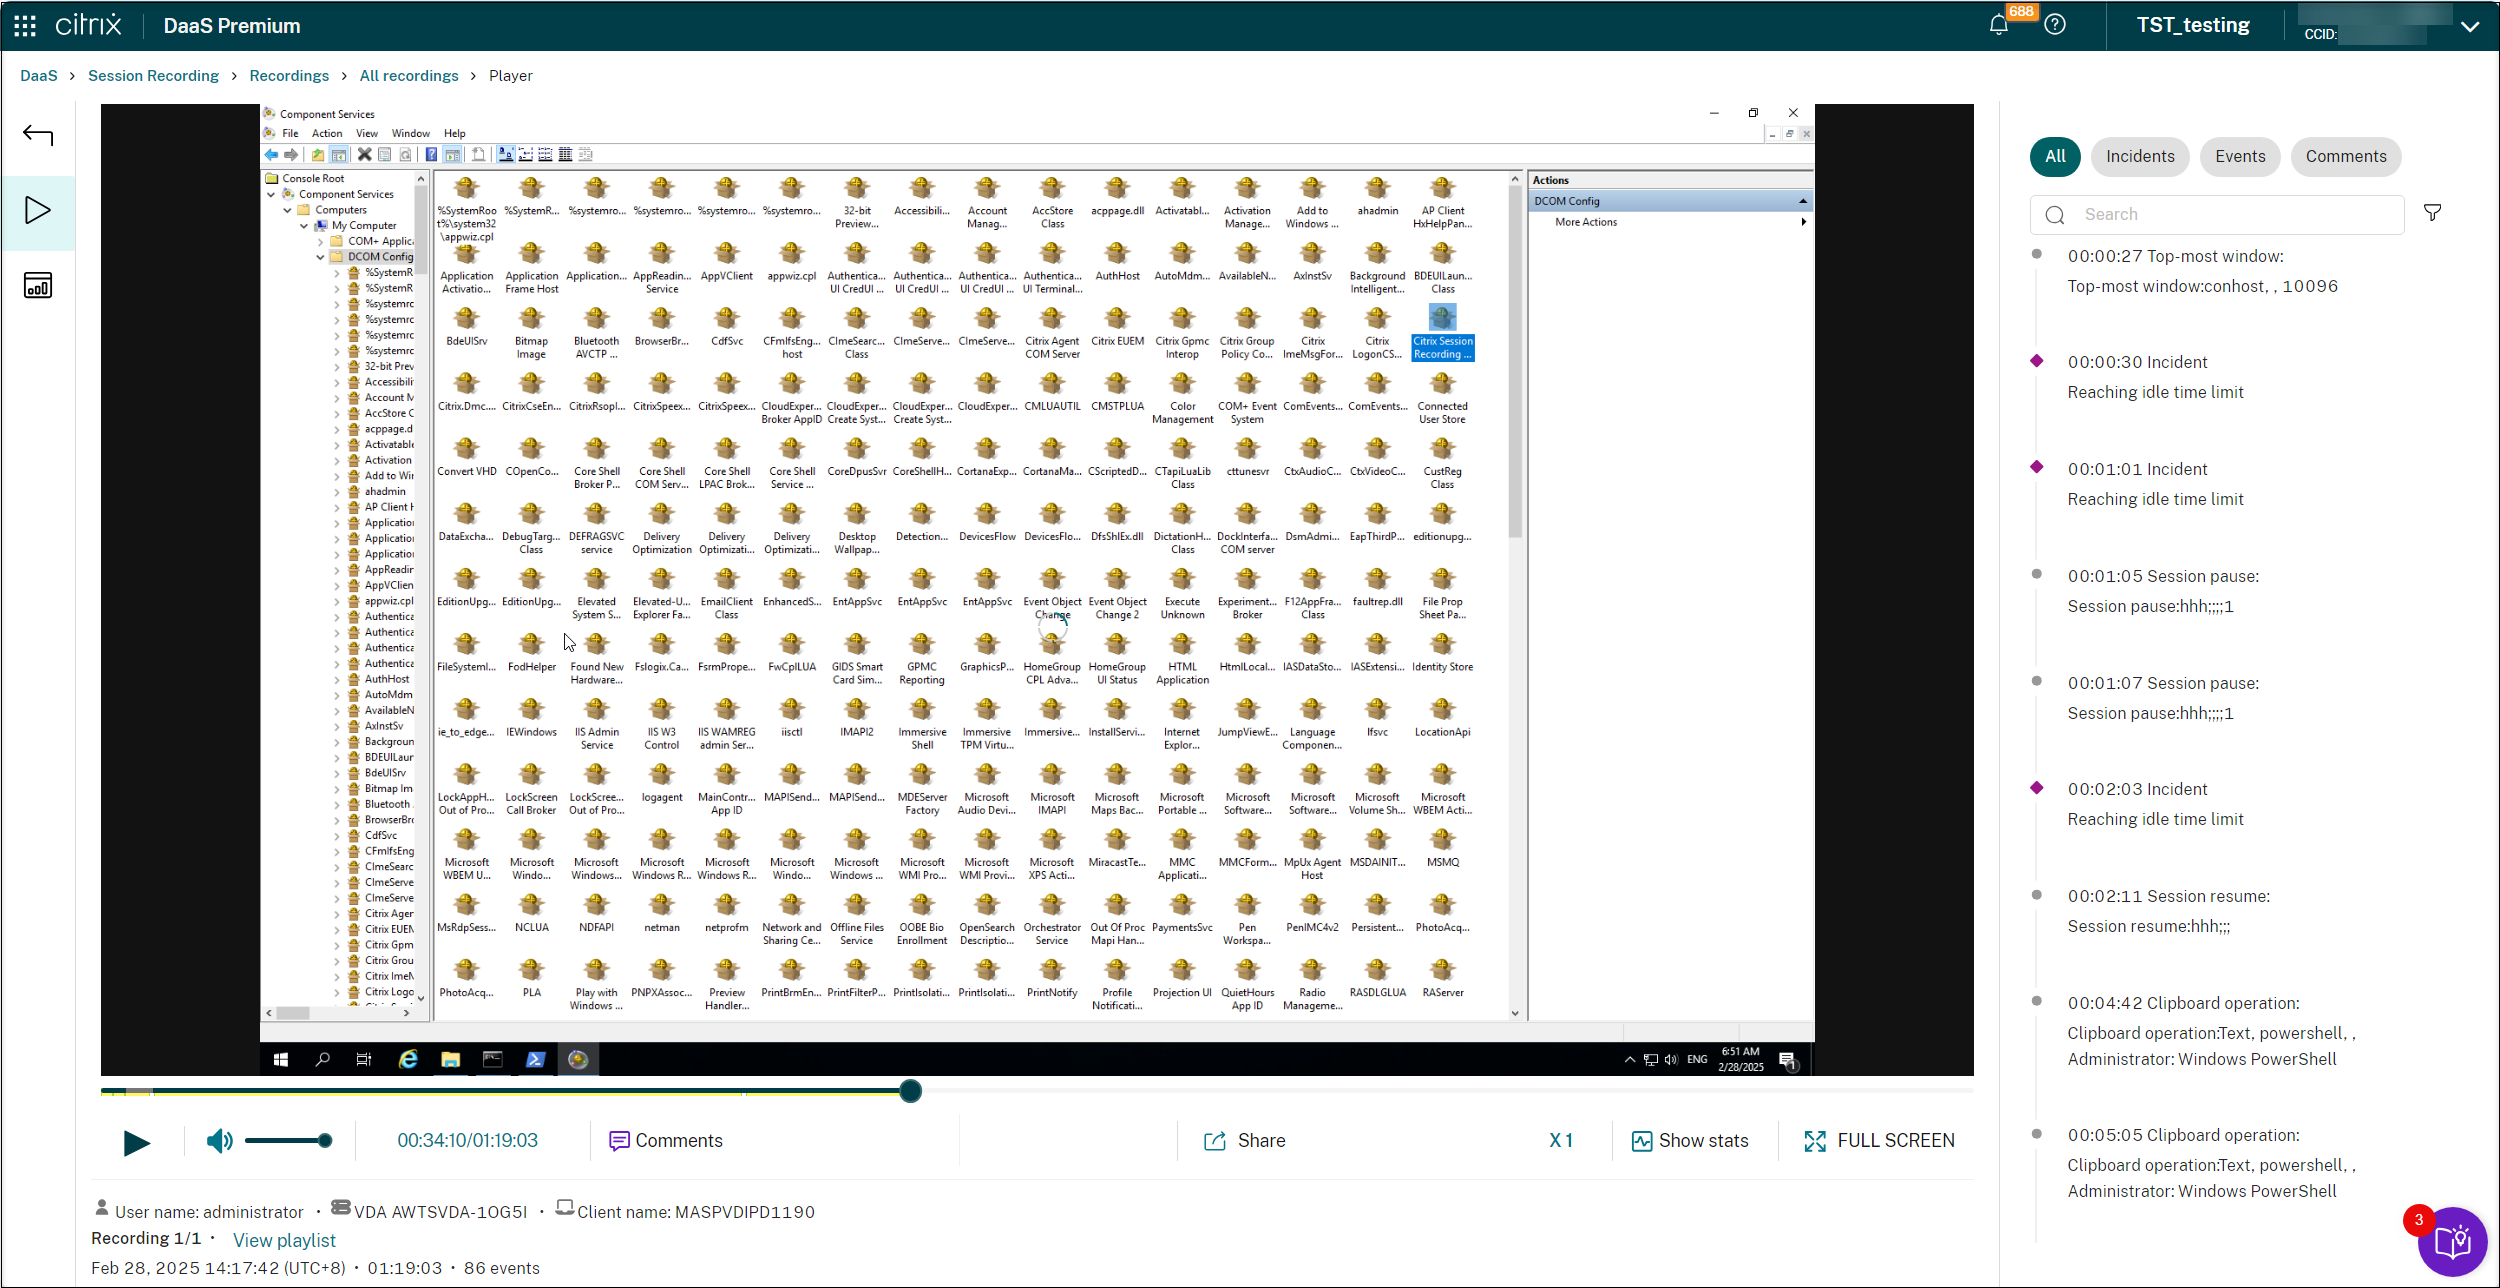
Both events and incidents are tagged within recordings, allowing for easy search and playback review. Clicking the play button takes you to the recording playback page, where you can view the events, incidents, and comments for the recorded session.
For example, see the following screen capture:
Configure site-level user activity reporting
To enable the presentation of event and incident data in the cloud for enhanced user activity monitoring and analysis, follow the configuration steps outlined below.
Step 1: Enable the presentation of event data in the cloud
Configure and activate an event detection policy. Verify that the policy includes all event types necessary for comprehensive data capture. Event data captured by the policy will be displayed in the cloud for user activity monitoring and analysis. To also enable cloud presentation of incident data, continue with Step 2 below.
For information about the event detection policy settings, see Configure event detection policies.
Step 2: Enable the presentation of incident data in the cloud
- Select Configuration > Server Management from the left navigation of the Session Recording service.
- Click Settings for the target site.
-
On the Event data analysis page, select Upload event data to the Session Recording service and Generate reports with event data. Specify whether to upload all captured events or select specific types of events.
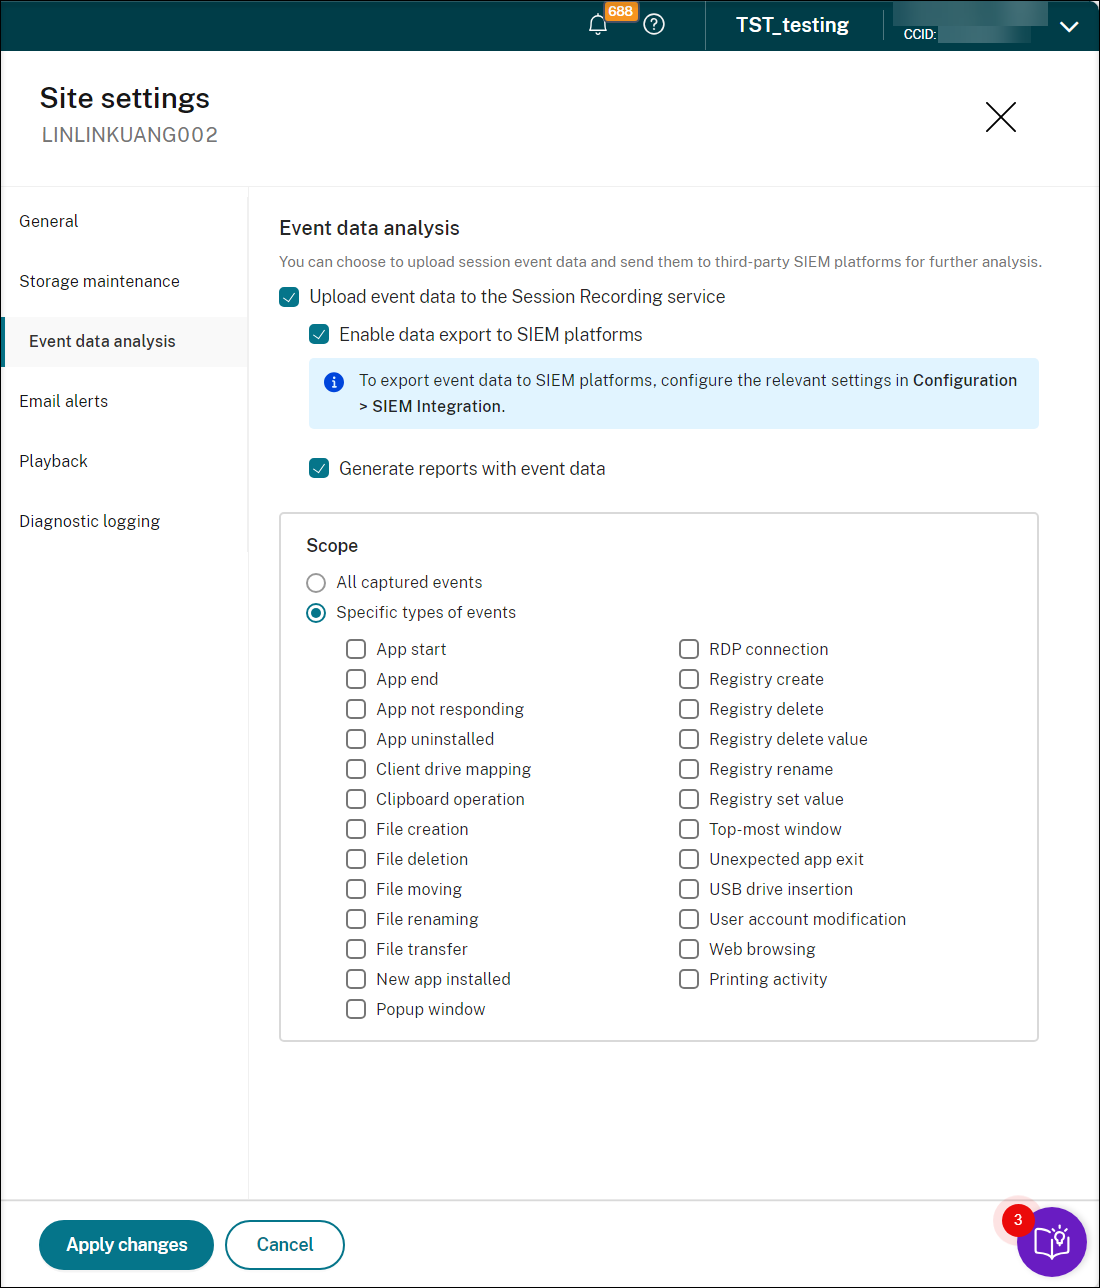
-
Access the incident library settings and configure the incident identification rules to analyze the uploaded event data and identify incidents from them.
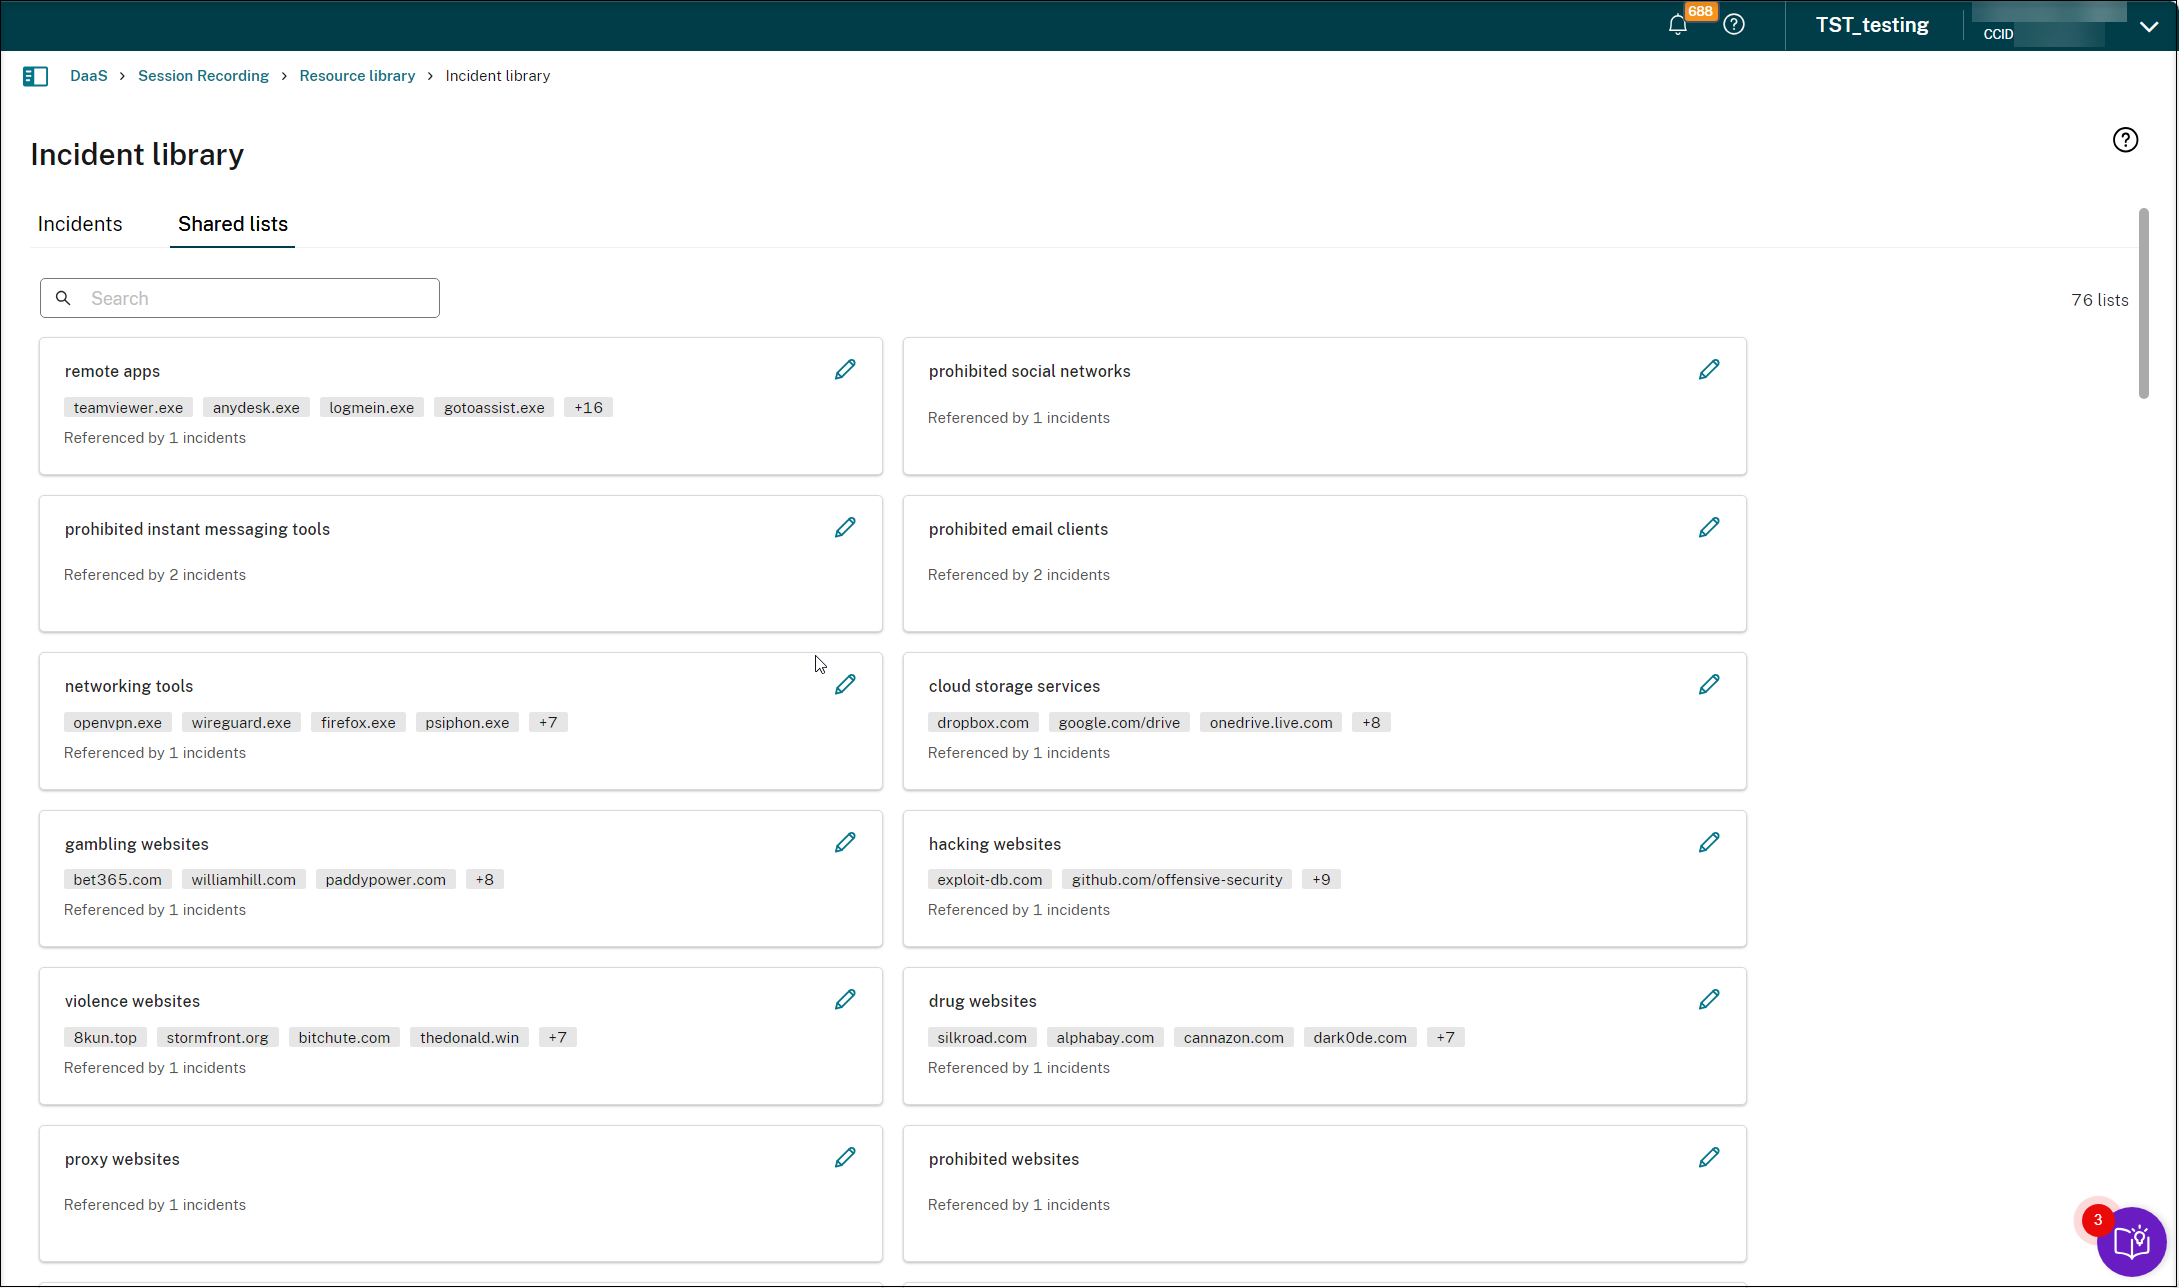
To access the incident library settings, click Resource Library from the left navigation pane of the Session Recording service page and then click Incident library.
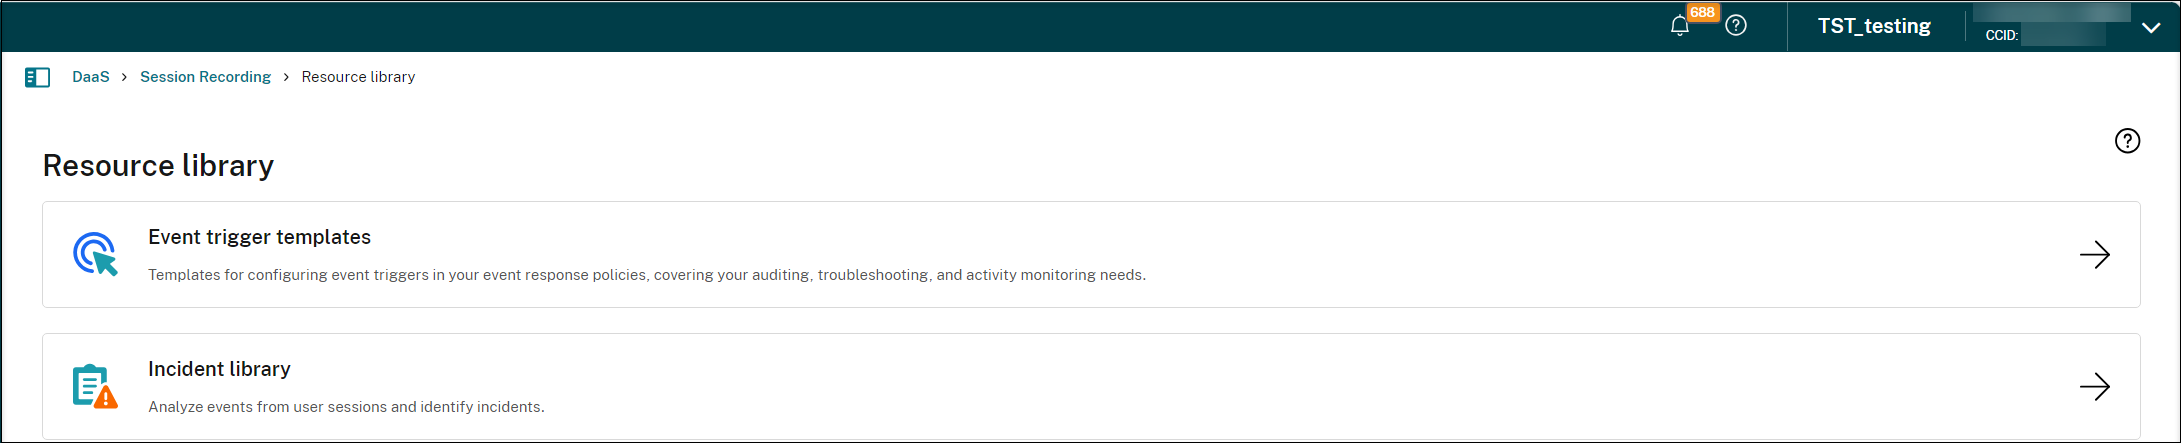
The Incident library page contains two tabs, Incidents and Shared lists.
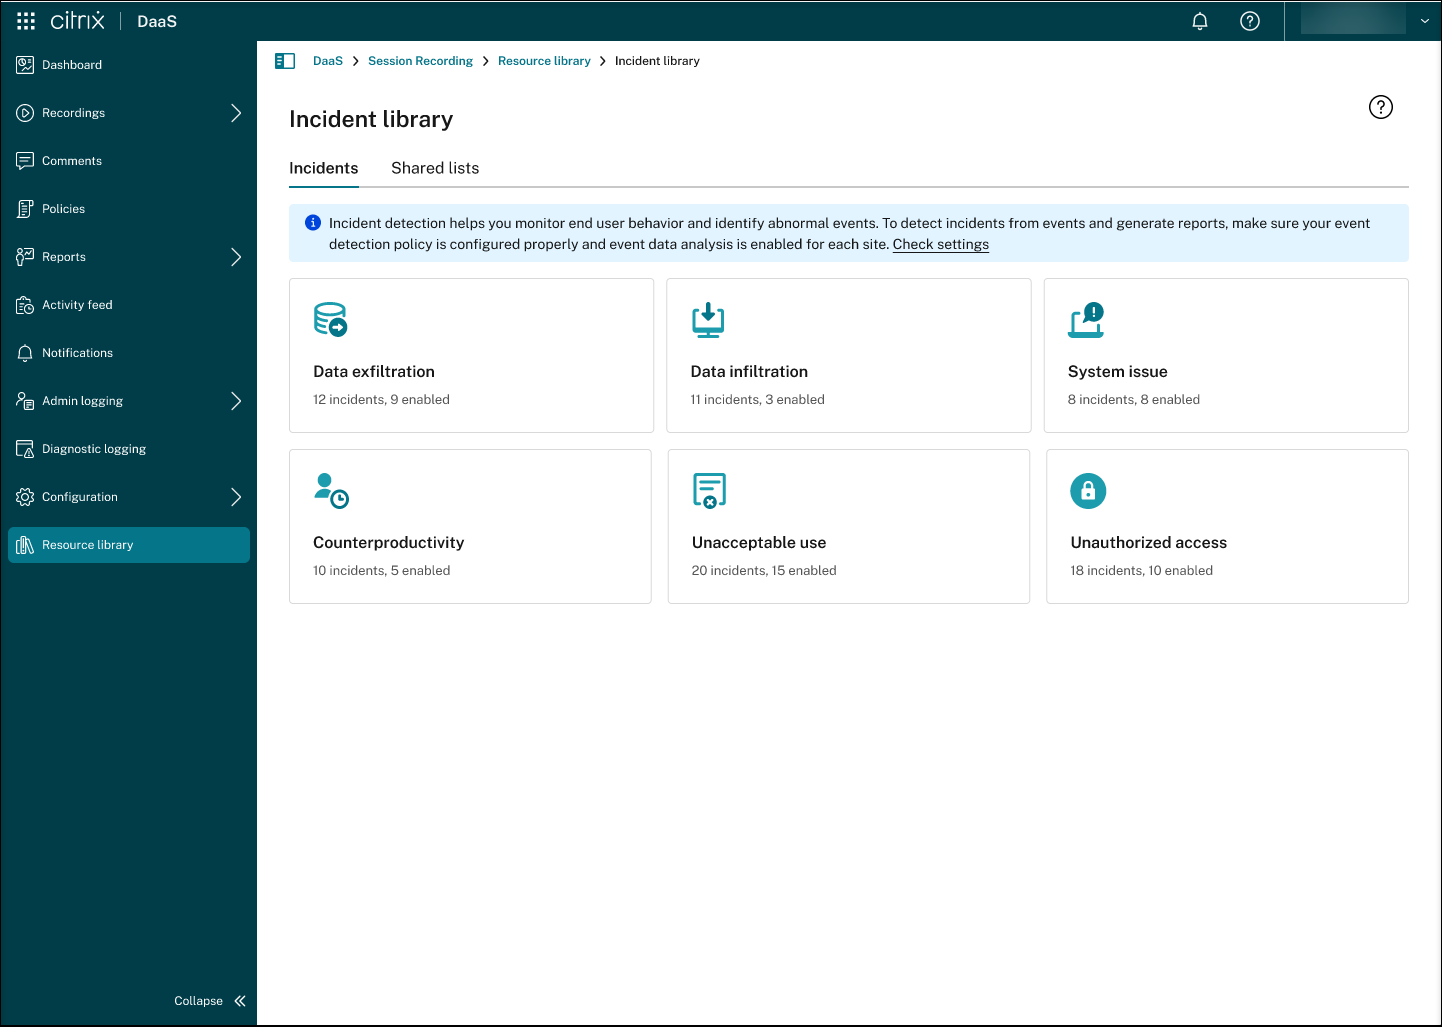
The Incidents tab displays categories of incidents that can be reported, each containing pre-defined incidents related to that category. For example, to view all pre-defined incidents related to the data exfiltration category that can be reported, click Data exfiltration.
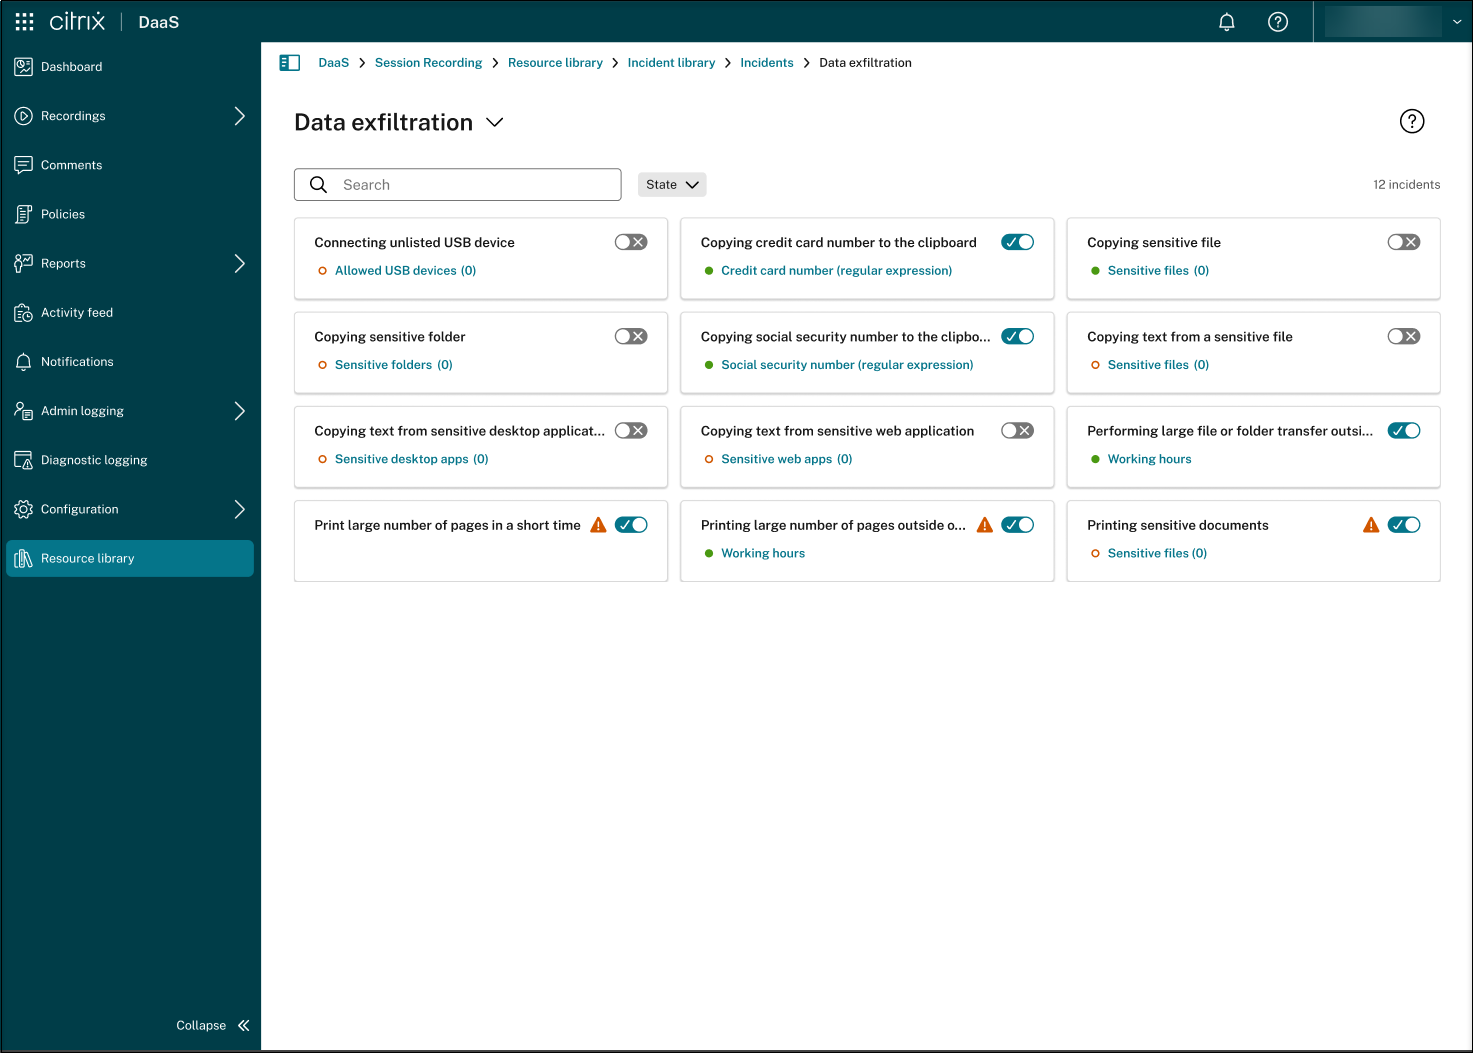
To enable or disable reporting for a pre-defined incident related to a category, toggle the switch next to it. Some of the pre-defined incidents have a filter to define identification criteria. For example, the allowed USB devices filter lets you define an allow list. When a USB device not on this list is connected during a recorded session, an incident is triggered.

You can find a collection of these filters on the Shared lists tab.